

Key Insights
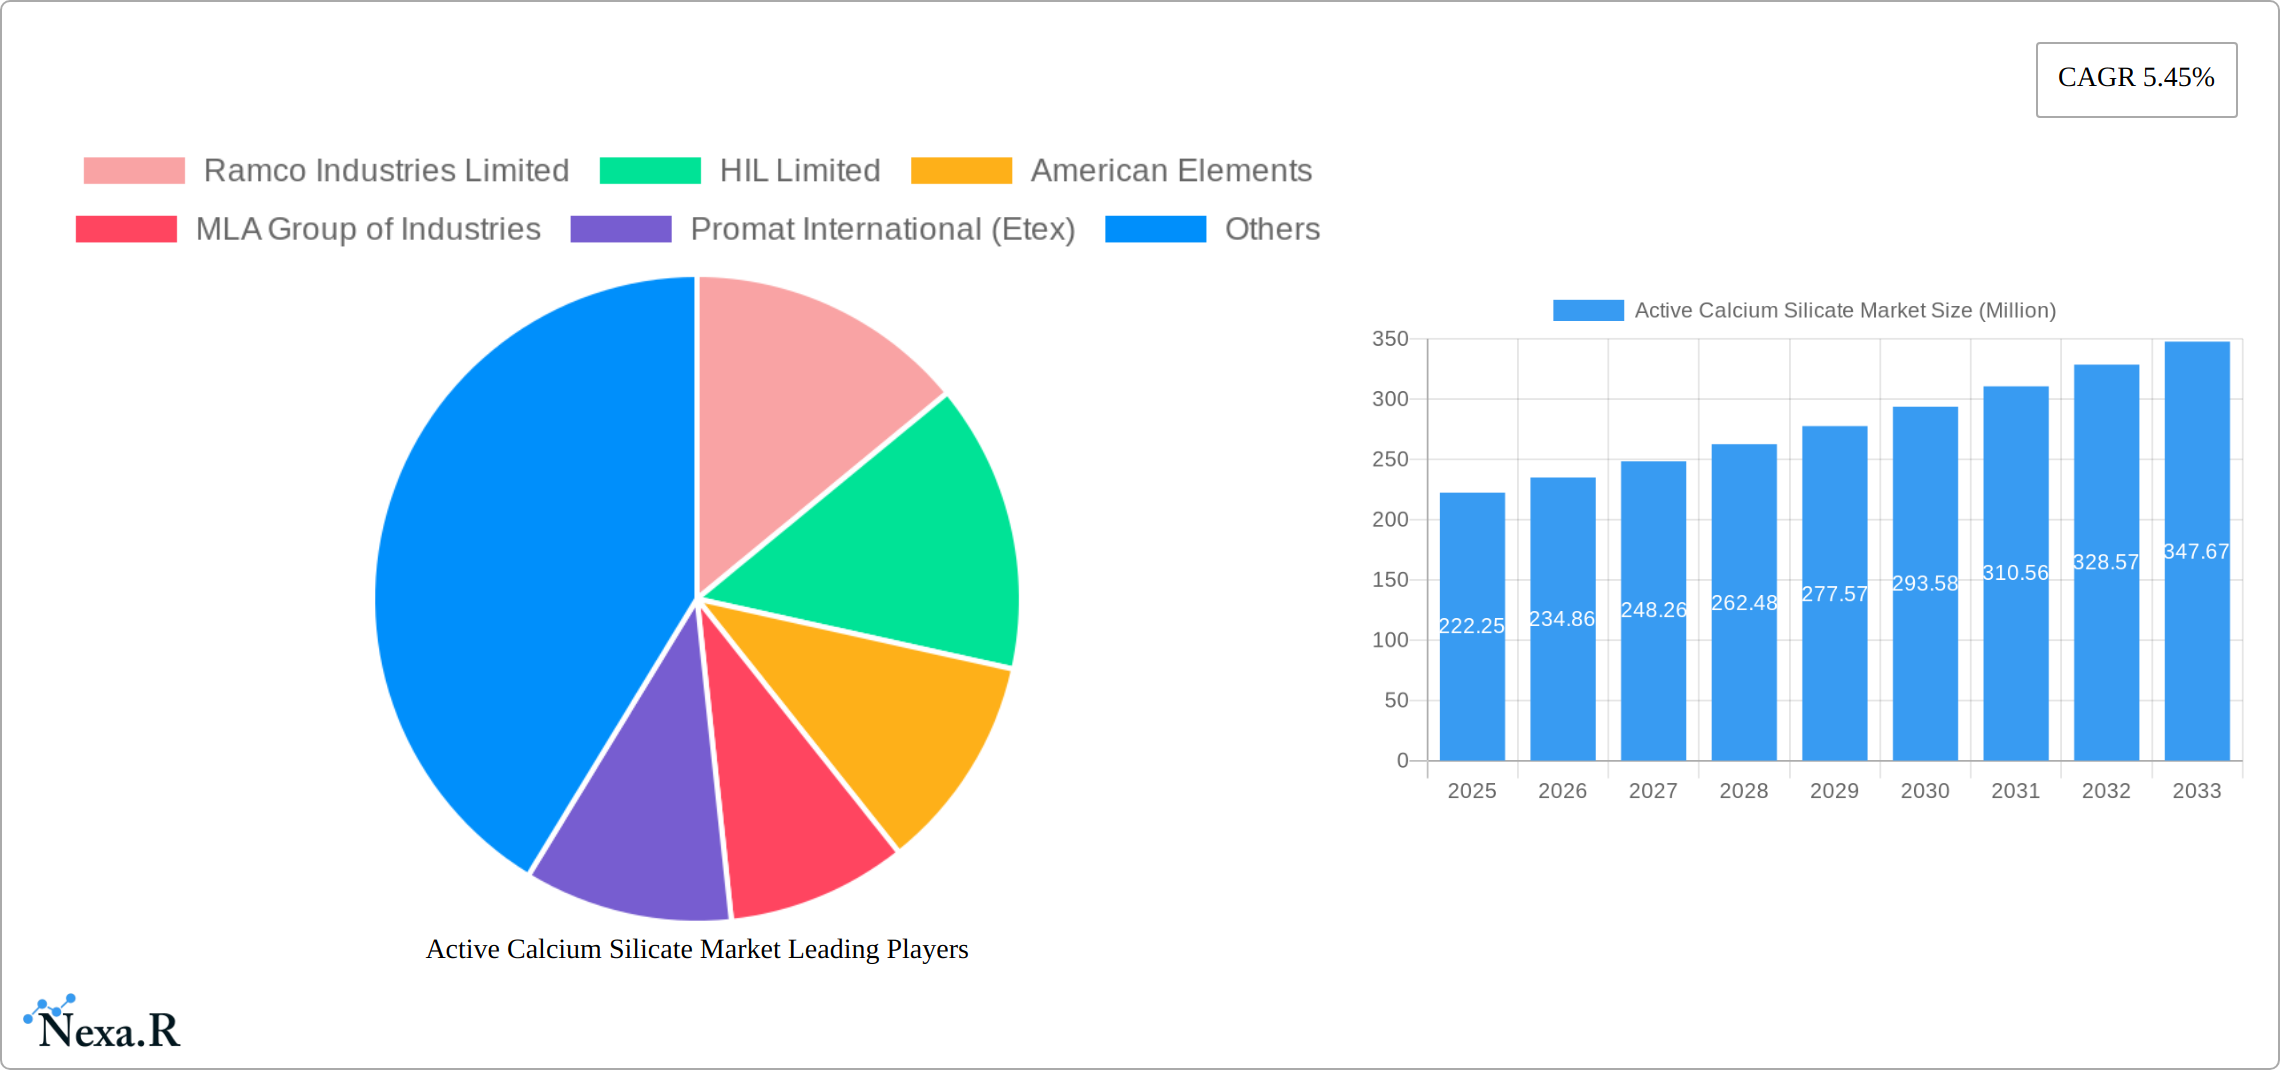
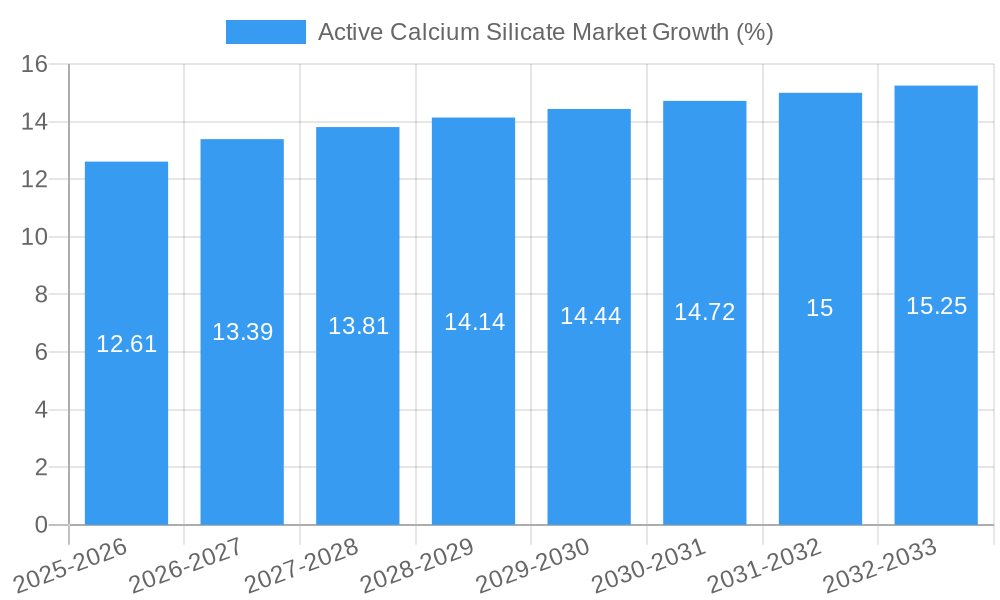
The Active Calcium Silicate market, valued at $222.25 million in 2025, is projected to experience robust growth, driven by a Compound Annual Growth Rate (CAGR) of 5.45% from 2025 to 2033. This expansion is fueled by several key factors. The increasing demand for energy-efficient building materials is significantly boosting the adoption of active calcium silicate in insulation applications. Furthermore, the rising awareness of fire safety regulations and the inherent fire-resistant properties of this material are driving its use in fire protection solutions across various sectors, including construction and industrial applications. The growing construction industry globally, particularly in developing economies, further contributes to market growth. The versatility of active calcium silicate, enabling its incorporation into paints & coatings, ceramics, and cement, broadens its application scope and fuels market expansion. While competitive pressures from alternative materials exist, the unique properties of active calcium silicate, such as its thermal insulation, fire resistance, and durability, position it favorably for continued market penetration. Technological advancements focused on improving its performance characteristics and expanding its applications are also expected to contribute positively to the market trajectory.
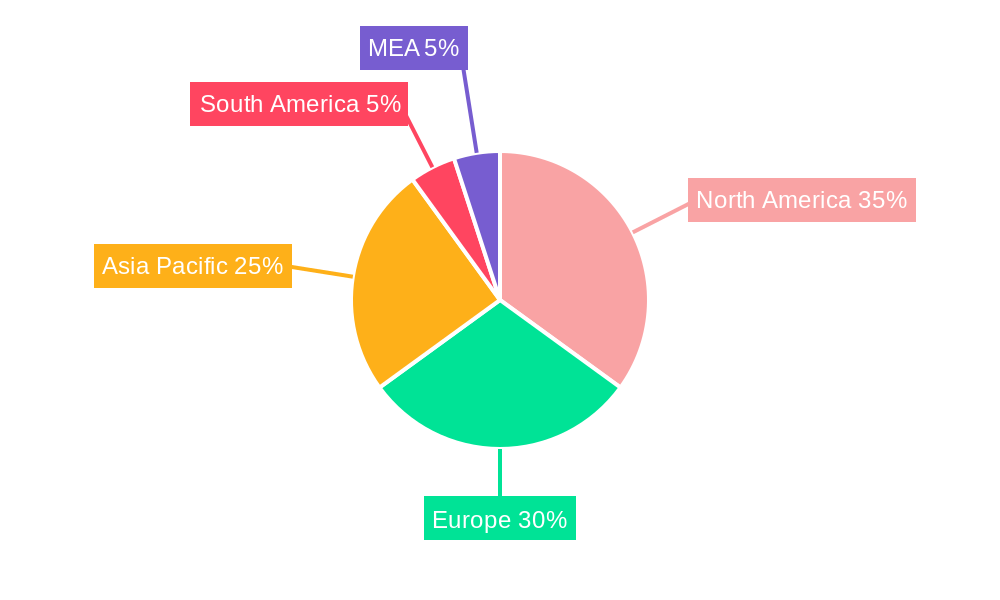
The market segmentation reveals a diverse application landscape. Insulation and fire protection are currently the leading segments, reflecting the growing focus on energy efficiency and safety. However, growing applications in paints & coatings, driven by the need for enhanced performance and durability, are expected to show significant growth in the forecast period. Geographically, North America and Europe currently hold significant market shares, driven by strong regulatory frameworks and established construction industries. However, Asia-Pacific is expected to witness the fastest growth, fueled by rapid urbanization and infrastructure development in countries like China and India. Companies like Ramco Industries Limited, HIL Limited, and others are key players in the market, leveraging their technological capabilities and distribution networks to capture market share. The competitive landscape is characterized by both established players and emerging entrants, leading to innovation and competition. The continued focus on sustainable construction practices further supports the long-term growth prospects of the active calcium silicate market.
Active Calcium Silicate Market: A Comprehensive Report (2019-2033)
This comprehensive report provides an in-depth analysis of the Active Calcium Silicate market, encompassing market dynamics, growth trends, regional insights, product landscape, key players, and future outlook. The report covers the period from 2019 to 2033, with 2025 as the base year and a forecast period extending to 2033. The market is segmented by application (Insulation, Fire Protection, Paints & Coatings, Ceramics, Cement, Others), providing granular insights into specific industry segments. The parent market is the broader construction materials industry, and the child market focuses specifically on high-performance, calcium silicate-based materials. This report is invaluable for industry professionals, investors, and strategic decision-makers seeking to understand and capitalize on the opportunities within this growing market. The projected market size in 2025 is estimated at XX Million units.
Active Calcium Silicate Market Market Dynamics & Structure
The Active Calcium Silicate market is characterized by moderate concentration, with key players holding significant market share. Technological innovation, particularly in improving thermal and acoustic insulation properties, is a major driver. Stringent building codes and fire safety regulations globally influence market demand, impacting the adoption of calcium silicate-based products in construction. Competitive substitutes include other insulation materials like fiberglass and mineral wool, posing challenges to market growth. End-user demographics show a strong correlation with construction activity levels, with growth primarily driven by residential and commercial building projects. M&A activity within the sector has been moderate, primarily focused on strategic acquisitions to expand product portfolios and geographic reach.
- Market Concentration: Moderately concentrated, with top 5 players holding approximately xx% market share in 2025.
- Technological Innovation: Focus on enhancing thermal efficiency, fire resistance, and sustainability.
- Regulatory Landscape: Stringent building codes and environmental regulations drive demand for high-performance materials.
- Competitive Substitutes: Fiberglass, mineral wool, and other insulation materials.
- End-User Demographics: Primarily driven by residential and commercial construction, with growth correlating to economic activity.
- M&A Trends: Moderate activity, with strategic acquisitions to expand product portfolios and geographic reach. An estimated xx M&A deals occurred between 2019 and 2024.
Active Calcium Silicate Market Growth Trends & Insights
The Active Calcium Silicate market experienced a CAGR of xx% during the historical period (2019-2024), driven by increasing demand for energy-efficient and fire-resistant building materials. This growth is expected to continue during the forecast period (2025-2033), with a projected CAGR of xx%. Market penetration in key regions is increasing, particularly in developing economies experiencing rapid urbanization and infrastructure development. Technological disruptions, such as the development of advanced composite materials incorporating calcium silicate, are expanding applications beyond traditional insulation and fire protection. Shifting consumer preferences towards sustainable and eco-friendly building materials are also boosting market growth. The increasing focus on green building standards and energy efficiency regulations worldwide is further propelling market expansion. Market size is expected to reach XX Million units by 2033.
Dominant Regions, Countries, or Segments in Active Calcium Silicate Market
The Asia-Pacific region currently dominates the Active Calcium Silicate market, fueled by rapid infrastructure development and urbanization, particularly in China and India. Robust economic growth and rising disposable incomes are driving demand for improved residential and commercial construction. The Insulation segment commands the largest market share, followed by Fire Protection. Within insulation, the demand for high-performance materials is escalating due to stringent energy efficiency regulations in developed nations and a growing awareness of energy conservation in developing ones. This trend is further amplified by government incentives and policies promoting sustainable building practices across the region.
- Key Drivers in Asia-Pacific: Rapid urbanization, substantial infrastructure investments, government support for green building initiatives, and rising energy costs.
- Key Drivers in Insulation Segment: Stringent energy efficiency standards, increasing energy costs, and growing awareness of the environmental impact of building materials.
- Market Share (Projected 2025): Asia-Pacific is projected to hold approximately [Insert Percentage]% of the global market share in 2025. (Note: Replace "[Insert Percentage]%" with the actual projected market share data).
- Growth Potential: Significant growth potential exists in emerging markets due to ongoing and planned construction activities, coupled with the increasing adoption of sustainable building practices.
Active Calcium Silicate Market Product Landscape
The Active Calcium Silicate product landscape is dynamic, with continuous innovation focused on enhancing performance characteristics. Manufacturers are developing formulations with improved thermal insulation, fire resistance, and acoustic properties. Advanced additives are incorporated to enhance durability, reduce environmental impact, and expand applications into specialized areas, such as high-temperature insulation in industrial settings and advanced acoustic dampening solutions for noise-sensitive environments. Key selling points for these products include superior performance compared to traditional alternatives, eco-friendly attributes, and cost-effectiveness in the long run due to their durability and energy-saving properties.
Key Drivers, Barriers & Challenges in Active Calcium Silicate Market
Key Drivers:
- Escalating demand for energy-efficient and sustainable building materials driven by consumer and regulatory pressures.
- Stringent building codes and increasingly stricter fire safety regulations globally.
- Growing awareness of the environmental impact of traditional building materials and the push for eco-friendly alternatives.
- Expansion of applications into diverse sectors, including automotive, aerospace, and specialized industrial applications requiring high-performance insulation.
Key Challenges:
- Competition from substitute materials, such as fiberglass and mineral wool, necessitates continuous innovation and differentiation.
- Fluctuations in raw material prices, particularly for key components like calcium silicate, impact profitability and pricing strategies.
- Supply chain disruptions and rising transportation costs can lead to production delays and increased costs.
- Stringent environmental regulations impacting production processes and disposal methods pose significant challenges and require ongoing compliance efforts. This factor is estimated to have reduced market growth by approximately [Insert Percentage]% in 2024. (Note: Replace "[Insert Percentage]%" with the actual data).
Emerging Opportunities in Active Calcium Silicate Market
- Expanding applications in emerging markets with rapid construction growth.
- Development of innovative composite materials with enhanced performance.
- Increased demand for sustainable and eco-friendly building materials.
- Growing focus on improving the acoustic properties of calcium silicate products.
Growth Accelerators in the Active Calcium Silicate Market Industry
Technological breakthroughs in material science, leading to lighter, stronger, and more energy-efficient calcium silicate products, are key growth accelerators. Strategic partnerships between manufacturers and building companies are expanding market reach and facilitating the adoption of new technologies. Expansion into new geographic markets and diversification into specialized applications further accelerates market growth.
Key Players Shaping the Active Calcium Silicate Market Market
- Ramco Industries Limited
- HIL Limited
- American Elements
- MLA Group of Industries
- Promat International (Etex)
- Sibelco
- Skamol Group
- Weifang Hongyuan Chemical Co Ltd
- Johns Manville
- Xella Group
Notable Milestones in Active Calcium Silicate Market Sector
- 2020: Introduction of a new generation of high-performance calcium silicate insulation by Xella Group.
- 2022: Acquisition of a smaller calcium silicate manufacturer by Promat International (Etex) to expand its product portfolio.
- 2023: Launch of a sustainable, recycled calcium silicate insulation product by Ramco Industries Limited.
In-Depth Active Calcium Silicate Market Market Outlook
The Active Calcium Silicate market is poised for continued growth, driven by increasing demand for sustainable and high-performance building materials. Technological advancements, strategic partnerships, and expanding applications across diverse industries will further fuel market expansion. The focus on energy efficiency and sustainable construction practices presents significant opportunities for market players to develop and commercialize innovative calcium silicate-based products. The market is expected to witness significant growth, especially in emerging economies with robust infrastructure development plans.
Active Calcium Silicate Market Segmentation
-
1. Application
- 1.1. Insulation
- 1.2. Fire Protection
- 1.3. Paints & Coatings
- 1.4. Ceramics
- 1.5. Cement
- 1.6. Others
Active Calcium Silicate Market Segmentation By Geography
-
1. Asia Pacific
- 1.1. China
- 1.2. India
- 1.3. Japan
- 1.4. South Korea
- 1.5. Rest of Asia Pacific
-
2. North America
- 2.1. United States
- 2.2. Canada
- 2.3. Mexico
-
3. Europe
- 3.1. Germany
- 3.2. United Kingdom
- 3.3. France
- 3.4. Italy
- 3.5. Rest of Europe
-
4. South America
- 4.1. Brazil
- 4.2. Argentina
- 4.3. Rest of South America
-
5. Middle East and Africa
- 5.1. Saudi Arabia
- 5.2. South Africa
- 5.3. Rest of Middle East and Africa
Active Calcium Silicate Market REPORT HIGHLIGHTS
| Aspects | Details |
|---|---|
| Study Period | 2019-2033 |
| Base Year | 2024 |
| Estimated Year | 2025 |
| Forecast Period | 2025-2033 |
| Historical Period | 2019-2024 |
| Growth Rate | CAGR of 5.45% from 2019-2033 |
| Segmentation |
|
Table of Contents
- 1. Introduction
- 1.1. Research Scope
- 1.2. Market Segmentation
- 1.3. Research Methodology
- 1.4. Definitions and Assumptions
- 2. Executive Summary
- 2.1. Introduction
- 3. Market Dynamics
- 3.1. Introduction
- 3.2. Market Drivers
- 3.2.1. Growing Demand from the Construction Industry in Asia-Pacific; Increasing Usage in the Ceramic Industry; Other Drivers
- 3.3. Market Restrains
- 3.3.1. Stringent Regulations Pertaining to Permissible Exposure Limit of the Product; Other Restraints
- 3.4. Market Trends
- 3.4.1. Growing Demand from Insulation and Fire Protection Segment
- 4. Market Factor Analysis
- 4.1. Porters Five Forces
- 4.2. Supply/Value Chain
- 4.3. PESTEL analysis
- 4.4. Market Entropy
- 4.5. Patent/Trademark Analysis
- 5. Global Active Calcium Silicate Market Analysis, Insights and Forecast, 2019-2031
- 5.1. Market Analysis, Insights and Forecast - by Application
- 5.1.1. Insulation
- 5.1.2. Fire Protection
- 5.1.3. Paints & Coatings
- 5.1.4. Ceramics
- 5.1.5. Cement
- 5.1.6. Others
- 5.2. Market Analysis, Insights and Forecast - by Region
- 5.2.1. Asia Pacific
- 5.2.2. North America
- 5.2.3. Europe
- 5.2.4. South America
- 5.2.5. Middle East and Africa
- 5.1. Market Analysis, Insights and Forecast - by Application
- 6. Asia Pacific Active Calcium Silicate Market Analysis, Insights and Forecast, 2019-2031
- 6.1. Market Analysis, Insights and Forecast - by Application
- 6.1.1. Insulation
- 6.1.2. Fire Protection
- 6.1.3. Paints & Coatings
- 6.1.4. Ceramics
- 6.1.5. Cement
- 6.1.6. Others
- 6.1. Market Analysis, Insights and Forecast - by Application
- 7. North America Active Calcium Silicate Market Analysis, Insights and Forecast, 2019-2031
- 7.1. Market Analysis, Insights and Forecast - by Application
- 7.1.1. Insulation
- 7.1.2. Fire Protection
- 7.1.3. Paints & Coatings
- 7.1.4. Ceramics
- 7.1.5. Cement
- 7.1.6. Others
- 7.1. Market Analysis, Insights and Forecast - by Application
- 8. Europe Active Calcium Silicate Market Analysis, Insights and Forecast, 2019-2031
- 8.1. Market Analysis, Insights and Forecast - by Application
- 8.1.1. Insulation
- 8.1.2. Fire Protection
- 8.1.3. Paints & Coatings
- 8.1.4. Ceramics
- 8.1.5. Cement
- 8.1.6. Others
- 8.1. Market Analysis, Insights and Forecast - by Application
- 9. South America Active Calcium Silicate Market Analysis, Insights and Forecast, 2019-2031
- 9.1. Market Analysis, Insights and Forecast - by Application
- 9.1.1. Insulation
- 9.1.2. Fire Protection
- 9.1.3. Paints & Coatings
- 9.1.4. Ceramics
- 9.1.5. Cement
- 9.1.6. Others
- 9.1. Market Analysis, Insights and Forecast - by Application
- 10. Middle East and Africa Active Calcium Silicate Market Analysis, Insights and Forecast, 2019-2031
- 10.1. Market Analysis, Insights and Forecast - by Application
- 10.1.1. Insulation
- 10.1.2. Fire Protection
- 10.1.3. Paints & Coatings
- 10.1.4. Ceramics
- 10.1.5. Cement
- 10.1.6. Others
- 10.1. Market Analysis, Insights and Forecast - by Application
- 11. North America Active Calcium Silicate Market Analysis, Insights and Forecast, 2019-2031
- 11.1. Market Analysis, Insights and Forecast - By Country/Sub-region
- 11.1.1 United States
- 11.1.2 Canada
- 11.1.3 Mexico
- 12. Europe Active Calcium Silicate Market Analysis, Insights and Forecast, 2019-2031
- 12.1. Market Analysis, Insights and Forecast - By Country/Sub-region
- 12.1.1 Germany
- 12.1.2 France
- 12.1.3 Italy
- 12.1.4 United Kingdom
- 12.1.5 Netherlands
- 12.1.6 Rest of Europe
- 13. Asia Pacific Active Calcium Silicate Market Analysis, Insights and Forecast, 2019-2031
- 13.1. Market Analysis, Insights and Forecast - By Country/Sub-region
- 13.1.1 China
- 13.1.2 Japan
- 13.1.3 India
- 13.1.4 South Korea
- 13.1.5 Taiwan
- 13.1.6 Australia
- 13.1.7 Rest of Asia-Pacific
- 14. South America Active Calcium Silicate Market Analysis, Insights and Forecast, 2019-2031
- 14.1. Market Analysis, Insights and Forecast - By Country/Sub-region
- 14.1.1 Brazil
- 14.1.2 Argentina
- 14.1.3 Rest of South America
- 15. MEA Active Calcium Silicate Market Analysis, Insights and Forecast, 2019-2031
- 15.1. Market Analysis, Insights and Forecast - By Country/Sub-region
- 15.1.1 Middle East
- 15.1.2 Africa
- 16. Competitive Analysis
- 16.1. Global Market Share Analysis 2024
- 16.2. Company Profiles
- 16.2.1 Ramco Industries Limited
- 16.2.1.1. Overview
- 16.2.1.2. Products
- 16.2.1.3. SWOT Analysis
- 16.2.1.4. Recent Developments
- 16.2.1.5. Financials (Based on Availability)
- 16.2.2 HIL Limited
- 16.2.2.1. Overview
- 16.2.2.2. Products
- 16.2.2.3. SWOT Analysis
- 16.2.2.4. Recent Developments
- 16.2.2.5. Financials (Based on Availability)
- 16.2.3 American Elements
- 16.2.3.1. Overview
- 16.2.3.2. Products
- 16.2.3.3. SWOT Analysis
- 16.2.3.4. Recent Developments
- 16.2.3.5. Financials (Based on Availability)
- 16.2.4 MLA Group of Industries
- 16.2.4.1. Overview
- 16.2.4.2. Products
- 16.2.4.3. SWOT Analysis
- 16.2.4.4. Recent Developments
- 16.2.4.5. Financials (Based on Availability)
- 16.2.5 Promat International (Etex)
- 16.2.5.1. Overview
- 16.2.5.2. Products
- 16.2.5.3. SWOT Analysis
- 16.2.5.4. Recent Developments
- 16.2.5.5. Financials (Based on Availability)
- 16.2.6 Sibelco
- 16.2.6.1. Overview
- 16.2.6.2. Products
- 16.2.6.3. SWOT Analysis
- 16.2.6.4. Recent Developments
- 16.2.6.5. Financials (Based on Availability)
- 16.2.7 Skamol Group
- 16.2.7.1. Overview
- 16.2.7.2. Products
- 16.2.7.3. SWOT Analysis
- 16.2.7.4. Recent Developments
- 16.2.7.5. Financials (Based on Availability)
- 16.2.8 Weifang Hongyuan Chemical Co Ltd
- 16.2.8.1. Overview
- 16.2.8.2. Products
- 16.2.8.3. SWOT Analysis
- 16.2.8.4. Recent Developments
- 16.2.8.5. Financials (Based on Availability)
- 16.2.9 Johns Manville
- 16.2.9.1. Overview
- 16.2.9.2. Products
- 16.2.9.3. SWOT Analysis
- 16.2.9.4. Recent Developments
- 16.2.9.5. Financials (Based on Availability)
- 16.2.10 Xella Group
- 16.2.10.1. Overview
- 16.2.10.2. Products
- 16.2.10.3. SWOT Analysis
- 16.2.10.4. Recent Developments
- 16.2.10.5. Financials (Based on Availability)
- 16.2.1 Ramco Industries Limited
List of Figures
- Figure 1: Global Active Calcium Silicate Market Revenue Breakdown (Million, %) by Region 2024 & 2032
- Figure 2: Global Active Calcium Silicate Market Volume Breakdown (K Tons, %) by Region 2024 & 2032
- Figure 3: North America Active Calcium Silicate Market Revenue (Million), by Country 2024 & 2032
- Figure 4: North America Active Calcium Silicate Market Volume (K Tons), by Country 2024 & 2032
- Figure 5: North America Active Calcium Silicate Market Revenue Share (%), by Country 2024 & 2032
- Figure 6: North America Active Calcium Silicate Market Volume Share (%), by Country 2024 & 2032
- Figure 7: Europe Active Calcium Silicate Market Revenue (Million), by Country 2024 & 2032
- Figure 8: Europe Active Calcium Silicate Market Volume (K Tons), by Country 2024 & 2032
- Figure 9: Europe Active Calcium Silicate Market Revenue Share (%), by Country 2024 & 2032
- Figure 10: Europe Active Calcium Silicate Market Volume Share (%), by Country 2024 & 2032
- Figure 11: Asia Pacific Active Calcium Silicate Market Revenue (Million), by Country 2024 & 2032
- Figure 12: Asia Pacific Active Calcium Silicate Market Volume (K Tons), by Country 2024 & 2032
- Figure 13: Asia Pacific Active Calcium Silicate Market Revenue Share (%), by Country 2024 & 2032
- Figure 14: Asia Pacific Active Calcium Silicate Market Volume Share (%), by Country 2024 & 2032
- Figure 15: South America Active Calcium Silicate Market Revenue (Million), by Country 2024 & 2032
- Figure 16: South America Active Calcium Silicate Market Volume (K Tons), by Country 2024 & 2032
- Figure 17: South America Active Calcium Silicate Market Revenue Share (%), by Country 2024 & 2032
- Figure 18: South America Active Calcium Silicate Market Volume Share (%), by Country 2024 & 2032
- Figure 19: MEA Active Calcium Silicate Market Revenue (Million), by Country 2024 & 2032
- Figure 20: MEA Active Calcium Silicate Market Volume (K Tons), by Country 2024 & 2032
- Figure 21: MEA Active Calcium Silicate Market Revenue Share (%), by Country 2024 & 2032
- Figure 22: MEA Active Calcium Silicate Market Volume Share (%), by Country 2024 & 2032
- Figure 23: Asia Pacific Active Calcium Silicate Market Revenue (Million), by Application 2024 & 2032
- Figure 24: Asia Pacific Active Calcium Silicate Market Volume (K Tons), by Application 2024 & 2032
- Figure 25: Asia Pacific Active Calcium Silicate Market Revenue Share (%), by Application 2024 & 2032
- Figure 26: Asia Pacific Active Calcium Silicate Market Volume Share (%), by Application 2024 & 2032
- Figure 27: Asia Pacific Active Calcium Silicate Market Revenue (Million), by Country 2024 & 2032
- Figure 28: Asia Pacific Active Calcium Silicate Market Volume (K Tons), by Country 2024 & 2032
- Figure 29: Asia Pacific Active Calcium Silicate Market Revenue Share (%), by Country 2024 & 2032
- Figure 30: Asia Pacific Active Calcium Silicate Market Volume Share (%), by Country 2024 & 2032
- Figure 31: North America Active Calcium Silicate Market Revenue (Million), by Application 2024 & 2032
- Figure 32: North America Active Calcium Silicate Market Volume (K Tons), by Application 2024 & 2032
- Figure 33: North America Active Calcium Silicate Market Revenue Share (%), by Application 2024 & 2032
- Figure 34: North America Active Calcium Silicate Market Volume Share (%), by Application 2024 & 2032
- Figure 35: North America Active Calcium Silicate Market Revenue (Million), by Country 2024 & 2032
- Figure 36: North America Active Calcium Silicate Market Volume (K Tons), by Country 2024 & 2032
- Figure 37: North America Active Calcium Silicate Market Revenue Share (%), by Country 2024 & 2032
- Figure 38: North America Active Calcium Silicate Market Volume Share (%), by Country 2024 & 2032
- Figure 39: Europe Active Calcium Silicate Market Revenue (Million), by Application 2024 & 2032
- Figure 40: Europe Active Calcium Silicate Market Volume (K Tons), by Application 2024 & 2032
- Figure 41: Europe Active Calcium Silicate Market Revenue Share (%), by Application 2024 & 2032
- Figure 42: Europe Active Calcium Silicate Market Volume Share (%), by Application 2024 & 2032
- Figure 43: Europe Active Calcium Silicate Market Revenue (Million), by Country 2024 & 2032
- Figure 44: Europe Active Calcium Silicate Market Volume (K Tons), by Country 2024 & 2032
- Figure 45: Europe Active Calcium Silicate Market Revenue Share (%), by Country 2024 & 2032
- Figure 46: Europe Active Calcium Silicate Market Volume Share (%), by Country 2024 & 2032
- Figure 47: South America Active Calcium Silicate Market Revenue (Million), by Application 2024 & 2032
- Figure 48: South America Active Calcium Silicate Market Volume (K Tons), by Application 2024 & 2032
- Figure 49: South America Active Calcium Silicate Market Revenue Share (%), by Application 2024 & 2032
- Figure 50: South America Active Calcium Silicate Market Volume Share (%), by Application 2024 & 2032
- Figure 51: South America Active Calcium Silicate Market Revenue (Million), by Country 2024 & 2032
- Figure 52: South America Active Calcium Silicate Market Volume (K Tons), by Country 2024 & 2032
- Figure 53: South America Active Calcium Silicate Market Revenue Share (%), by Country 2024 & 2032
- Figure 54: South America Active Calcium Silicate Market Volume Share (%), by Country 2024 & 2032
- Figure 55: Middle East and Africa Active Calcium Silicate Market Revenue (Million), by Application 2024 & 2032
- Figure 56: Middle East and Africa Active Calcium Silicate Market Volume (K Tons), by Application 2024 & 2032
- Figure 57: Middle East and Africa Active Calcium Silicate Market Revenue Share (%), by Application 2024 & 2032
- Figure 58: Middle East and Africa Active Calcium Silicate Market Volume Share (%), by Application 2024 & 2032
- Figure 59: Middle East and Africa Active Calcium Silicate Market Revenue (Million), by Country 2024 & 2032
- Figure 60: Middle East and Africa Active Calcium Silicate Market Volume (K Tons), by Country 2024 & 2032
- Figure 61: Middle East and Africa Active Calcium Silicate Market Revenue Share (%), by Country 2024 & 2032
- Figure 62: Middle East and Africa Active Calcium Silicate Market Volume Share (%), by Country 2024 & 2032
List of Tables
- Table 1: Global Active Calcium Silicate Market Revenue Million Forecast, by Region 2019 & 2032
- Table 2: Global Active Calcium Silicate Market Volume K Tons Forecast, by Region 2019 & 2032
- Table 3: Global Active Calcium Silicate Market Revenue Million Forecast, by Application 2019 & 2032
- Table 4: Global Active Calcium Silicate Market Volume K Tons Forecast, by Application 2019 & 2032
- Table 5: Global Active Calcium Silicate Market Revenue Million Forecast, by Region 2019 & 2032
- Table 6: Global Active Calcium Silicate Market Volume K Tons Forecast, by Region 2019 & 2032
- Table 7: Global Active Calcium Silicate Market Revenue Million Forecast, by Country 2019 & 2032
- Table 8: Global Active Calcium Silicate Market Volume K Tons Forecast, by Country 2019 & 2032
- Table 9: United States Active Calcium Silicate Market Revenue (Million) Forecast, by Application 2019 & 2032
- Table 10: United States Active Calcium Silicate Market Volume (K Tons) Forecast, by Application 2019 & 2032
- Table 11: Canada Active Calcium Silicate Market Revenue (Million) Forecast, by Application 2019 & 2032
- Table 12: Canada Active Calcium Silicate Market Volume (K Tons) Forecast, by Application 2019 & 2032
- Table 13: Mexico Active Calcium Silicate Market Revenue (Million) Forecast, by Application 2019 & 2032
- Table 14: Mexico Active Calcium Silicate Market Volume (K Tons) Forecast, by Application 2019 & 2032
- Table 15: Global Active Calcium Silicate Market Revenue Million Forecast, by Country 2019 & 2032
- Table 16: Global Active Calcium Silicate Market Volume K Tons Forecast, by Country 2019 & 2032
- Table 17: Germany Active Calcium Silicate Market Revenue (Million) Forecast, by Application 2019 & 2032
- Table 18: Germany Active Calcium Silicate Market Volume (K Tons) Forecast, by Application 2019 & 2032
- Table 19: France Active Calcium Silicate Market Revenue (Million) Forecast, by Application 2019 & 2032
- Table 20: France Active Calcium Silicate Market Volume (K Tons) Forecast, by Application 2019 & 2032
- Table 21: Italy Active Calcium Silicate Market Revenue (Million) Forecast, by Application 2019 & 2032
- Table 22: Italy Active Calcium Silicate Market Volume (K Tons) Forecast, by Application 2019 & 2032
- Table 23: United Kingdom Active Calcium Silicate Market Revenue (Million) Forecast, by Application 2019 & 2032
- Table 24: United Kingdom Active Calcium Silicate Market Volume (K Tons) Forecast, by Application 2019 & 2032
- Table 25: Netherlands Active Calcium Silicate Market Revenue (Million) Forecast, by Application 2019 & 2032
- Table 26: Netherlands Active Calcium Silicate Market Volume (K Tons) Forecast, by Application 2019 & 2032
- Table 27: Rest of Europe Active Calcium Silicate Market Revenue (Million) Forecast, by Application 2019 & 2032
- Table 28: Rest of Europe Active Calcium Silicate Market Volume (K Tons) Forecast, by Application 2019 & 2032
- Table 29: Global Active Calcium Silicate Market Revenue Million Forecast, by Country 2019 & 2032
- Table 30: Global Active Calcium Silicate Market Volume K Tons Forecast, by Country 2019 & 2032
- Table 31: China Active Calcium Silicate Market Revenue (Million) Forecast, by Application 2019 & 2032
- Table 32: China Active Calcium Silicate Market Volume (K Tons) Forecast, by Application 2019 & 2032
- Table 33: Japan Active Calcium Silicate Market Revenue (Million) Forecast, by Application 2019 & 2032
- Table 34: Japan Active Calcium Silicate Market Volume (K Tons) Forecast, by Application 2019 & 2032
- Table 35: India Active Calcium Silicate Market Revenue (Million) Forecast, by Application 2019 & 2032
- Table 36: India Active Calcium Silicate Market Volume (K Tons) Forecast, by Application 2019 & 2032
- Table 37: South Korea Active Calcium Silicate Market Revenue (Million) Forecast, by Application 2019 & 2032
- Table 38: South Korea Active Calcium Silicate Market Volume (K Tons) Forecast, by Application 2019 & 2032
- Table 39: Taiwan Active Calcium Silicate Market Revenue (Million) Forecast, by Application 2019 & 2032
- Table 40: Taiwan Active Calcium Silicate Market Volume (K Tons) Forecast, by Application 2019 & 2032
- Table 41: Australia Active Calcium Silicate Market Revenue (Million) Forecast, by Application 2019 & 2032
- Table 42: Australia Active Calcium Silicate Market Volume (K Tons) Forecast, by Application 2019 & 2032
- Table 43: Rest of Asia-Pacific Active Calcium Silicate Market Revenue (Million) Forecast, by Application 2019 & 2032
- Table 44: Rest of Asia-Pacific Active Calcium Silicate Market Volume (K Tons) Forecast, by Application 2019 & 2032
- Table 45: Global Active Calcium Silicate Market Revenue Million Forecast, by Country 2019 & 2032
- Table 46: Global Active Calcium Silicate Market Volume K Tons Forecast, by Country 2019 & 2032
- Table 47: Brazil Active Calcium Silicate Market Revenue (Million) Forecast, by Application 2019 & 2032
- Table 48: Brazil Active Calcium Silicate Market Volume (K Tons) Forecast, by Application 2019 & 2032
- Table 49: Argentina Active Calcium Silicate Market Revenue (Million) Forecast, by Application 2019 & 2032
- Table 50: Argentina Active Calcium Silicate Market Volume (K Tons) Forecast, by Application 2019 & 2032
- Table 51: Rest of South America Active Calcium Silicate Market Revenue (Million) Forecast, by Application 2019 & 2032
- Table 52: Rest of South America Active Calcium Silicate Market Volume (K Tons) Forecast, by Application 2019 & 2032
- Table 53: Global Active Calcium Silicate Market Revenue Million Forecast, by Country 2019 & 2032
- Table 54: Global Active Calcium Silicate Market Volume K Tons Forecast, by Country 2019 & 2032
- Table 55: Middle East Active Calcium Silicate Market Revenue (Million) Forecast, by Application 2019 & 2032
- Table 56: Middle East Active Calcium Silicate Market Volume (K Tons) Forecast, by Application 2019 & 2032
- Table 57: Africa Active Calcium Silicate Market Revenue (Million) Forecast, by Application 2019 & 2032
- Table 58: Africa Active Calcium Silicate Market Volume (K Tons) Forecast, by Application 2019 & 2032
- Table 59: Global Active Calcium Silicate Market Revenue Million Forecast, by Application 2019 & 2032
- Table 60: Global Active Calcium Silicate Market Volume K Tons Forecast, by Application 2019 & 2032
- Table 61: Global Active Calcium Silicate Market Revenue Million Forecast, by Country 2019 & 2032
- Table 62: Global Active Calcium Silicate Market Volume K Tons Forecast, by Country 2019 & 2032
- Table 63: China Active Calcium Silicate Market Revenue (Million) Forecast, by Application 2019 & 2032
- Table 64: China Active Calcium Silicate Market Volume (K Tons) Forecast, by Application 2019 & 2032
- Table 65: India Active Calcium Silicate Market Revenue (Million) Forecast, by Application 2019 & 2032
- Table 66: India Active Calcium Silicate Market Volume (K Tons) Forecast, by Application 2019 & 2032
- Table 67: Japan Active Calcium Silicate Market Revenue (Million) Forecast, by Application 2019 & 2032
- Table 68: Japan Active Calcium Silicate Market Volume (K Tons) Forecast, by Application 2019 & 2032
- Table 69: South Korea Active Calcium Silicate Market Revenue (Million) Forecast, by Application 2019 & 2032
- Table 70: South Korea Active Calcium Silicate Market Volume (K Tons) Forecast, by Application 2019 & 2032
- Table 71: Rest of Asia Pacific Active Calcium Silicate Market Revenue (Million) Forecast, by Application 2019 & 2032
- Table 72: Rest of Asia Pacific Active Calcium Silicate Market Volume (K Tons) Forecast, by Application 2019 & 2032
- Table 73: Global Active Calcium Silicate Market Revenue Million Forecast, by Application 2019 & 2032
- Table 74: Global Active Calcium Silicate Market Volume K Tons Forecast, by Application 2019 & 2032
- Table 75: Global Active Calcium Silicate Market Revenue Million Forecast, by Country 2019 & 2032
- Table 76: Global Active Calcium Silicate Market Volume K Tons Forecast, by Country 2019 & 2032
- Table 77: United States Active Calcium Silicate Market Revenue (Million) Forecast, by Application 2019 & 2032
- Table 78: United States Active Calcium Silicate Market Volume (K Tons) Forecast, by Application 2019 & 2032
- Table 79: Canada Active Calcium Silicate Market Revenue (Million) Forecast, by Application 2019 & 2032
- Table 80: Canada Active Calcium Silicate Market Volume (K Tons) Forecast, by Application 2019 & 2032
- Table 81: Mexico Active Calcium Silicate Market Revenue (Million) Forecast, by Application 2019 & 2032
- Table 82: Mexico Active Calcium Silicate Market Volume (K Tons) Forecast, by Application 2019 & 2032
- Table 83: Global Active Calcium Silicate Market Revenue Million Forecast, by Application 2019 & 2032
- Table 84: Global Active Calcium Silicate Market Volume K Tons Forecast, by Application 2019 & 2032
- Table 85: Global Active Calcium Silicate Market Revenue Million Forecast, by Country 2019 & 2032
- Table 86: Global Active Calcium Silicate Market Volume K Tons Forecast, by Country 2019 & 2032
- Table 87: Germany Active Calcium Silicate Market Revenue (Million) Forecast, by Application 2019 & 2032
- Table 88: Germany Active Calcium Silicate Market Volume (K Tons) Forecast, by Application 2019 & 2032
- Table 89: United Kingdom Active Calcium Silicate Market Revenue (Million) Forecast, by Application 2019 & 2032
- Table 90: United Kingdom Active Calcium Silicate Market Volume (K Tons) Forecast, by Application 2019 & 2032
- Table 91: France Active Calcium Silicate Market Revenue (Million) Forecast, by Application 2019 & 2032
- Table 92: France Active Calcium Silicate Market Volume (K Tons) Forecast, by Application 2019 & 2032
- Table 93: Italy Active Calcium Silicate Market Revenue (Million) Forecast, by Application 2019 & 2032
- Table 94: Italy Active Calcium Silicate Market Volume (K Tons) Forecast, by Application 2019 & 2032
- Table 95: Rest of Europe Active Calcium Silicate Market Revenue (Million) Forecast, by Application 2019 & 2032
- Table 96: Rest of Europe Active Calcium Silicate Market Volume (K Tons) Forecast, by Application 2019 & 2032
- Table 97: Global Active Calcium Silicate Market Revenue Million Forecast, by Application 2019 & 2032
- Table 98: Global Active Calcium Silicate Market Volume K Tons Forecast, by Application 2019 & 2032
- Table 99: Global Active Calcium Silicate Market Revenue Million Forecast, by Country 2019 & 2032
- Table 100: Global Active Calcium Silicate Market Volume K Tons Forecast, by Country 2019 & 2032
- Table 101: Brazil Active Calcium Silicate Market Revenue (Million) Forecast, by Application 2019 & 2032
- Table 102: Brazil Active Calcium Silicate Market Volume (K Tons) Forecast, by Application 2019 & 2032
- Table 103: Argentina Active Calcium Silicate Market Revenue (Million) Forecast, by Application 2019 & 2032
- Table 104: Argentina Active Calcium Silicate Market Volume (K Tons) Forecast, by Application 2019 & 2032
- Table 105: Rest of South America Active Calcium Silicate Market Revenue (Million) Forecast, by Application 2019 & 2032
- Table 106: Rest of South America Active Calcium Silicate Market Volume (K Tons) Forecast, by Application 2019 & 2032
- Table 107: Global Active Calcium Silicate Market Revenue Million Forecast, by Application 2019 & 2032
- Table 108: Global Active Calcium Silicate Market Volume K Tons Forecast, by Application 2019 & 2032
- Table 109: Global Active Calcium Silicate Market Revenue Million Forecast, by Country 2019 & 2032
- Table 110: Global Active Calcium Silicate Market Volume K Tons Forecast, by Country 2019 & 2032
- Table 111: Saudi Arabia Active Calcium Silicate Market Revenue (Million) Forecast, by Application 2019 & 2032
- Table 112: Saudi Arabia Active Calcium Silicate Market Volume (K Tons) Forecast, by Application 2019 & 2032
- Table 113: South Africa Active Calcium Silicate Market Revenue (Million) Forecast, by Application 2019 & 2032
- Table 114: South Africa Active Calcium Silicate Market Volume (K Tons) Forecast, by Application 2019 & 2032
- Table 115: Rest of Middle East and Africa Active Calcium Silicate Market Revenue (Million) Forecast, by Application 2019 & 2032
- Table 116: Rest of Middle East and Africa Active Calcium Silicate Market Volume (K Tons) Forecast, by Application 2019 & 2032
Frequently Asked Questions
1. What is the projected Compound Annual Growth Rate (CAGR) of the Active Calcium Silicate Market?
The projected CAGR is approximately 5.45%.
2. Which companies are prominent players in the Active Calcium Silicate Market?
Key companies in the market include Ramco Industries Limited, HIL Limited, American Elements, MLA Group of Industries, Promat International (Etex), Sibelco, Skamol Group, Weifang Hongyuan Chemical Co Ltd, Johns Manville, Xella Group.
3. What are the main segments of the Active Calcium Silicate Market?
The market segments include Application.
4. Can you provide details about the market size?
The market size is estimated to be USD 222.25 Million as of 2022.
5. What are some drivers contributing to market growth?
Growing Demand from the Construction Industry in Asia-Pacific; Increasing Usage in the Ceramic Industry; Other Drivers.
6. What are the notable trends driving market growth?
Growing Demand from Insulation and Fire Protection Segment.
7. Are there any restraints impacting market growth?
Stringent Regulations Pertaining to Permissible Exposure Limit of the Product; Other Restraints.
8. Can you provide examples of recent developments in the market?
N/A
9. What pricing options are available for accessing the report?
Pricing options include single-user, multi-user, and enterprise licenses priced at USD 4750, USD 5250, and USD 8750 respectively.
10. Is the market size provided in terms of value or volume?
The market size is provided in terms of value, measured in Million and volume, measured in K Tons.
11. Are there any specific market keywords associated with the report?
Yes, the market keyword associated with the report is "Active Calcium Silicate Market," which aids in identifying and referencing the specific market segment covered.
12. How do I determine which pricing option suits my needs best?
The pricing options vary based on user requirements and access needs. Individual users may opt for single-user licenses, while businesses requiring broader access may choose multi-user or enterprise licenses for cost-effective access to the report.
13. Are there any additional resources or data provided in the Active Calcium Silicate Market report?
While the report offers comprehensive insights, it's advisable to review the specific contents or supplementary materials provided to ascertain if additional resources or data are available.
14. How can I stay updated on further developments or reports in the Active Calcium Silicate Market?
To stay informed about further developments, trends, and reports in the Active Calcium Silicate Market, consider subscribing to industry newsletters, following relevant companies and organizations, or regularly checking reputable industry news sources and publications.
Methodology
Step 1 - Identification of Relevant Samples Size from Population Database


Step 2 - Approaches for Defining Global Market Size (Value, Volume* & Price*)

Note*: In applicable scenarios
Step 3 - Data Sources
Primary Research
- Web Analytics
- Survey Reports
- Research Institute
- Latest Research Reports
- Opinion Leaders
Secondary Research
- Annual Reports
- White Paper
- Latest Press Release
- Industry Association
- Paid Database
- Investor Presentations

Step 4 - Data Triangulation
Involves using different sources of information in order to increase the validity of a study
These sources are likely to be stakeholders in a program - participants, other researchers, program staff, other community members, and so on.
Then we put all data in single framework & apply various statistical tools to find out the dynamic on the market.
During the analysis stage, feedback from the stakeholder groups would be compared to determine areas of agreement as well as areas of divergence
