

Key Insights
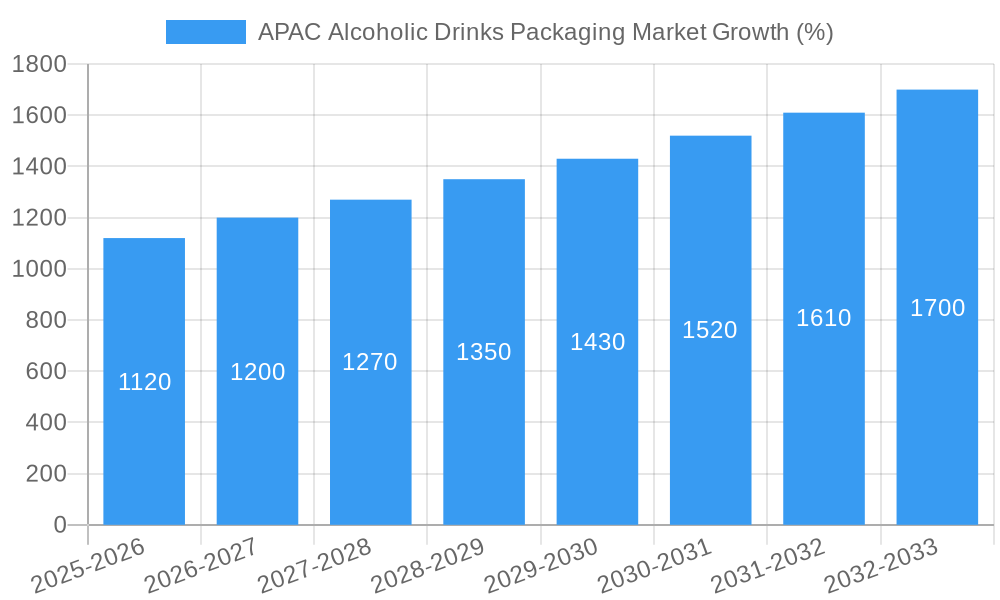
The Asia-Pacific (APAC) alcoholic drinks packaging market, valued at $17.38 billion in 2025, is projected to experience robust growth, driven by increasing alcohol consumption, particularly in emerging economies like India and China. A Compound Annual Growth Rate (CAGR) of 6.30% from 2025 to 2033 indicates a significant expansion of the market. This growth is fueled by several factors including the rising disposable incomes leading to increased spending on premium alcoholic beverages, the burgeoning craft brewing and spirits industry, and the evolving consumer preferences towards convenient and aesthetically pleasing packaging. The market is segmented by material (plastic, paper, metal, glass), product type (bottles, cans, pouches, cartons), and prominent countries within APAC (China, India, Japan, Singapore, Australia, and New Zealand). Plastic remains a dominant material due to its cost-effectiveness and versatility, but growing environmental concerns are driving the adoption of sustainable alternatives like paper and recyclable materials. The increasing demand for premiumization in the alcoholic beverage sector is also influencing packaging choices, with brands opting for innovative designs and materials to enhance their product appeal and brand image. Competition among major players like Hualian Glass Bottle, Ball Corporation, Crown Holdings Inc, Amcor, and Mondi Group is intense, with companies constantly innovating to meet the dynamic demands of the market.
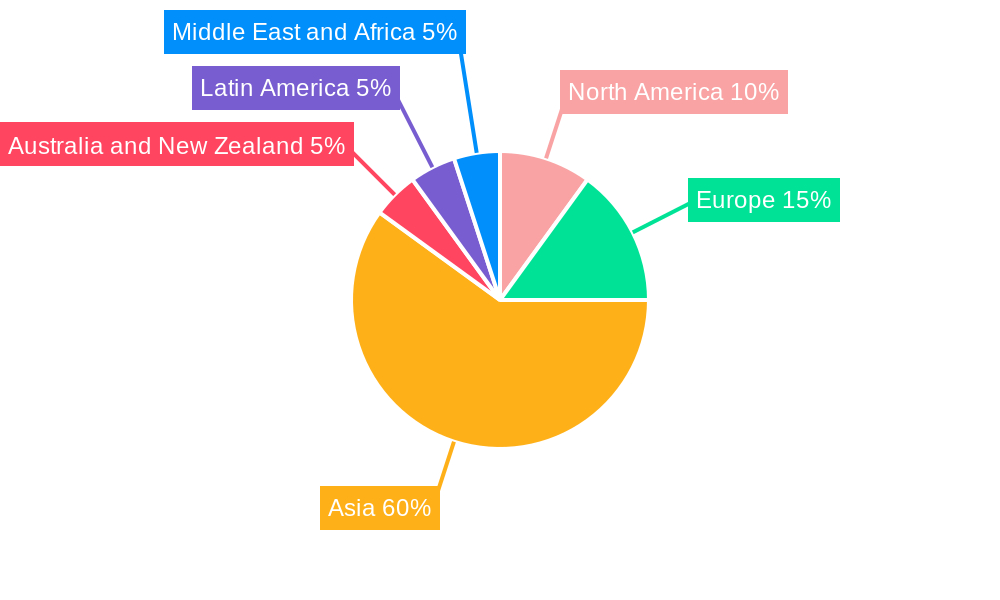
The significant growth within the APAC region is primarily attributed to the burgeoning middle class and a shift towards Westernized drinking habits in countries like China and India. The preference for convenient and portable packaging formats, such as cans and pouches, is boosting market expansion. However, regulatory hurdles related to sustainable packaging and fluctuating raw material prices pose challenges. Market players are addressing these challenges by investing in sustainable packaging solutions and exploring innovative supply chain management strategies. The forecast period (2025-2033) suggests a continued upward trajectory, with specific growth rates varying across segments and countries based on their unique economic and consumer trends. Further regional analysis reveals variations within APAC, with China and India anticipated to dominate the market share due to their large populations and expanding alcoholic beverage consumption.

APAC Alcoholic Drinks Packaging Market: A Comprehensive Report (2019-2033)
This in-depth report provides a comprehensive analysis of the Asia-Pacific (APAC) alcoholic drinks packaging market, covering the period 2019-2033. It offers invaluable insights into market dynamics, growth trends, competitive landscapes, and future opportunities for industry professionals, investors, and strategic decision-makers. The report segments the market by material (plastic, paper, metal, glass), product type (bottles, cans, pouches, cartons), and key countries (China, India, Japan, Singapore, Australia, and New Zealand). The base year for this analysis is 2025, with estimations for 2025 and forecasts extending to 2033. The historical period covered is 2019-2024. The market size is presented in million units.
APAC Alcoholic Drinks Packaging Market Dynamics & Structure
The APAC alcoholic drinks packaging market exhibits a moderately consolidated structure, with key players like Hualian Glass Bottle, Ball Corporation, Crown Holdings Inc, AGI Glaspac, Amcor Group GmbH, Mondi Group, and Gerresheimer AG holding significant market share. Technological innovations, particularly in sustainable packaging materials and advanced printing techniques, are key drivers. Stringent regulatory frameworks regarding material composition and labeling significantly influence market dynamics. The market witnesses considerable competitive pressure from substitute packaging materials and formats, pushing companies towards innovation. End-user demographics, particularly the growing preference for premium and craft alcoholic beverages, directly impacts packaging choices. Mergers and acquisitions (M&A) activity has been moderate (xx deals in the last 5 years), primarily driven by companies seeking to expand their product portfolios and geographic reach.
- Market Concentration: Moderately consolidated, with top 5 players holding approximately xx% market share in 2025.
- Technological Innovation: Focus on lightweighting, sustainability (e.g., recycled content), and enhanced barrier properties.
- Regulatory Framework: Stringent regulations on material safety and labeling, impacting material choice and costs.
- Competitive Substitutes: Growing competition from flexible packaging and alternative materials like biodegradable plastics.
- End-User Demographics: Shift towards premiumization and increasing demand for convenient packaging formats.
- M&A Trends: Moderate activity, driven by expansion and portfolio diversification strategies.
APAC Alcoholic Drinks Packaging Market Growth Trends & Insights
The APAC alcoholic drinks packaging market is expected to witness robust growth during the forecast period (2025-2033), driven by factors such as rising disposable incomes, changing consumption patterns, and increasing urbanization. The market size is projected to reach xx million units by 2033, exhibiting a CAGR of xx% during the forecast period. This growth is fueled by rising demand for alcoholic beverages across various segments, including beer, wine, spirits, and ready-to-drink (RTD) cocktails. Technological advancements such as the introduction of lightweight, sustainable, and tamper-evident packaging are also contributing to market expansion. Consumer preference for innovative packaging designs and convenience is another significant driver. Furthermore, the increasing popularity of e-commerce channels is further boosting demand for protective and efficient packaging solutions.
Dominant Regions, Countries, or Segments in APAC Alcoholic Drinks Packaging Market
China remains the dominant market for alcoholic drinks packaging in APAC, holding approximately xx% of the total market share in 2025. This dominance is attributed to the country's large and growing alcoholic beverage consumption market, coupled with robust economic growth and expanding infrastructure. India is another significant market, characterized by a growing middle class and increasing demand for packaged alcoholic drinks. Within the material segments, Glass continues to hold the largest share (xx%), followed by Plastic (xx%), reflecting the traditional preference for glass bottles in certain alcoholic beverage categories and the cost-effectiveness of plastic for others. The bottle segment leads in terms of product type, holding the highest market share (xx%).
- Key Drivers in China: Rapid urbanization, rising disposable incomes, and expanding distribution networks.
- Key Drivers in India: Growing middle class, increasing consumption of alcoholic beverages, and favorable government policies.
- Market Share by Material (2025): Glass (xx%), Plastic (xx%), Metal (xx%), Paper (xx%).
- Market Share by Product Type (2025): Bottles (xx%), Cans (xx%), Pouches (xx%), Cartons (xx%).
APAC Alcoholic Drinks Packaging Market Product Landscape
The APAC alcoholic drinks packaging market showcases a diverse product landscape characterized by ongoing innovation in materials, design, and functionality. Lightweighting remains a crucial factor, reducing transportation costs and environmental impact. Sustainability is gaining momentum, with a significant shift towards recycled and biodegradable materials. Smart packaging solutions, incorporating features like tamper-evident seals and traceability technologies, are gaining traction, enhancing product security and consumer confidence. There is also an increasing demand for unique and aesthetically appealing packaging designs to differentiate brands and attract consumers.
Key Drivers, Barriers & Challenges in APAP Alcoholic Drinks Packaging Market
Key Drivers:
- Rising disposable incomes and increasing consumption of alcoholic beverages across the APAC region.
- Growing demand for premium and craft alcoholic beverages, driving demand for sophisticated packaging.
- Technological advancements in packaging materials and design, enhancing product shelf life and appeal.
- Favorable government policies and regulations supporting the growth of the alcoholic beverage industry.
Key Challenges:
- Fluctuations in raw material prices, impacting overall packaging costs.
- Stringent environmental regulations, requiring companies to adopt sustainable packaging solutions.
- Intense competition among packaging manufacturers, putting pressure on pricing and margins.
- Supply chain disruptions, impacting the timely delivery of packaging materials.
Emerging Opportunities in APAC Alcoholic Drinks Packaging Market
- Growing demand for sustainable and eco-friendly packaging solutions.
- Increasing popularity of e-commerce, driving demand for protective and efficient packaging.
- Expanding market for premium and craft alcoholic beverages, presenting opportunities for innovative packaging designs.
- Untapped potential in rural and underserved markets.
Growth Accelerators in the APAC Alcoholic Drinks Packaging Market Industry
The APAC alcoholic drinks packaging market is poised for significant long-term growth fueled by several factors. Technological advancements, particularly in sustainable and lightweight materials, offer significant cost savings and environmental benefits. Strategic partnerships between packaging manufacturers and beverage companies are creating innovative solutions and expanding market reach. Market expansion into emerging economies, driven by rising disposable incomes and changing consumption patterns, presents lucrative opportunities. Furthermore, the integration of smart packaging technologies is adding value by enhancing product security and brand differentiation.
Key Players Shaping the APAC Alcoholic Drinks Packaging Market Market
- Hualian Glass Bottle
- Ball Corporation
- Crown Holdings Inc
- AGI Glaspac
- Amcor Group GmbH
- Mondi Group
- Gerresheimer AG
Notable Milestones in APAC Alcoholic Drinks Packaging Market Sector
- 2022 Q3: Amcor launches a new range of sustainable packaging solutions for alcoholic beverages.
- 2023 Q1: Crown Holdings invests in a new production facility in China, expanding its manufacturing capacity.
- 2024 Q2: Ball Corporation partners with a leading beverage company to develop innovative packaging for RTD cocktails.
- (Further milestones to be added based on data)
In-Depth APAC Alcoholic Drinks Packaging Market Outlook
The future of the APAC alcoholic drinks packaging market is bright. Continued growth in alcoholic beverage consumption, coupled with innovative packaging solutions and sustainability initiatives, will drive market expansion. Strategic partnerships and investments in advanced technologies will further accelerate growth. The focus on sustainable packaging will continue to shape market trends, presenting significant opportunities for environmentally conscious manufacturers. Expansion into emerging markets and the integration of smart packaging technologies will unlock new avenues for growth and innovation.
APAC Alcoholic Drinks Packaging Market Segmentation
-
1. Material
- 1.1. Plastic
- 1.2. Paper
- 1.3. Metal
- 1.4. Glass
-
2. Product Type
- 2.1. Bottles
- 2.2. Cans
- 2.3. Pouches
- 2.4. Carton
APAC Alcoholic Drinks Packaging Market Segmentation By Geography
-
1. North America
- 1.1. United States
- 1.2. Canada
- 1.3. Mexico
-
2. South America
- 2.1. Brazil
- 2.2. Argentina
- 2.3. Rest of South America
-
3. Europe
- 3.1. United Kingdom
- 3.2. Germany
- 3.3. France
- 3.4. Italy
- 3.5. Spain
- 3.6. Russia
- 3.7. Benelux
- 3.8. Nordics
- 3.9. Rest of Europe
-
4. Middle East & Africa
- 4.1. Turkey
- 4.2. Israel
- 4.3. GCC
- 4.4. North Africa
- 4.5. South Africa
- 4.6. Rest of Middle East & Africa
-
5. Asia Pacific
- 5.1. China
- 5.2. India
- 5.3. Japan
- 5.4. South Korea
- 5.5. ASEAN
- 5.6. Oceania
- 5.7. Rest of Asia Pacific
APAC Alcoholic Drinks Packaging Market REPORT HIGHLIGHTS
| Aspects | Details |
|---|---|
| Study Period | 2019-2033 |
| Base Year | 2024 |
| Estimated Year | 2025 |
| Forecast Period | 2025-2033 |
| Historical Period | 2019-2024 |
| Growth Rate | CAGR of 6.30% from 2019-2033 |
| Segmentation |
|
Table of Contents
- 1. Introduction
- 1.1. Research Scope
- 1.2. Market Segmentation
- 1.3. Research Methodology
- 1.4. Definitions and Assumptions
- 2. Executive Summary
- 2.1. Introduction
- 3. Market Dynamics
- 3.1. Introduction
- 3.2. Market Drivers
- 3.2.1. Increasing Demand for Sustainable Packaging; Increasing Consumption of Alcoholic Drinks in Asia
- 3.3. Market Restrains
- 3.3.1. Government Regulation for Plastic Usage
- 3.4. Market Trends
- 3.4.1. Significant Growth in Metal Packaging to Boost the Market
- 4. Market Factor Analysis
- 4.1. Porters Five Forces
- 4.2. Supply/Value Chain
- 4.3. PESTEL analysis
- 4.4. Market Entropy
- 4.5. Patent/Trademark Analysis
- 5. Global APAC Alcoholic Drinks Packaging Market Analysis, Insights and Forecast, 2019-2031
- 5.1. Market Analysis, Insights and Forecast - by Material
- 5.1.1. Plastic
- 5.1.2. Paper
- 5.1.3. Metal
- 5.1.4. Glass
- 5.2. Market Analysis, Insights and Forecast - by Product Type
- 5.2.1. Bottles
- 5.2.2. Cans
- 5.2.3. Pouches
- 5.2.4. Carton
- 5.3. Market Analysis, Insights and Forecast - by Region
- 5.3.1. North America
- 5.3.2. South America
- 5.3.3. Europe
- 5.3.4. Middle East & Africa
- 5.3.5. Asia Pacific
- 5.1. Market Analysis, Insights and Forecast - by Material
- 6. North America APAC Alcoholic Drinks Packaging Market Analysis, Insights and Forecast, 2019-2031
- 6.1. Market Analysis, Insights and Forecast - by Material
- 6.1.1. Plastic
- 6.1.2. Paper
- 6.1.3. Metal
- 6.1.4. Glass
- 6.2. Market Analysis, Insights and Forecast - by Product Type
- 6.2.1. Bottles
- 6.2.2. Cans
- 6.2.3. Pouches
- 6.2.4. Carton
- 6.1. Market Analysis, Insights and Forecast - by Material
- 7. South America APAC Alcoholic Drinks Packaging Market Analysis, Insights and Forecast, 2019-2031
- 7.1. Market Analysis, Insights and Forecast - by Material
- 7.1.1. Plastic
- 7.1.2. Paper
- 7.1.3. Metal
- 7.1.4. Glass
- 7.2. Market Analysis, Insights and Forecast - by Product Type
- 7.2.1. Bottles
- 7.2.2. Cans
- 7.2.3. Pouches
- 7.2.4. Carton
- 7.1. Market Analysis, Insights and Forecast - by Material
- 8. Europe APAC Alcoholic Drinks Packaging Market Analysis, Insights and Forecast, 2019-2031
- 8.1. Market Analysis, Insights and Forecast - by Material
- 8.1.1. Plastic
- 8.1.2. Paper
- 8.1.3. Metal
- 8.1.4. Glass
- 8.2. Market Analysis, Insights and Forecast - by Product Type
- 8.2.1. Bottles
- 8.2.2. Cans
- 8.2.3. Pouches
- 8.2.4. Carton
- 8.1. Market Analysis, Insights and Forecast - by Material
- 9. Middle East & Africa APAC Alcoholic Drinks Packaging Market Analysis, Insights and Forecast, 2019-2031
- 9.1. Market Analysis, Insights and Forecast - by Material
- 9.1.1. Plastic
- 9.1.2. Paper
- 9.1.3. Metal
- 9.1.4. Glass
- 9.2. Market Analysis, Insights and Forecast - by Product Type
- 9.2.1. Bottles
- 9.2.2. Cans
- 9.2.3. Pouches
- 9.2.4. Carton
- 9.1. Market Analysis, Insights and Forecast - by Material
- 10. Asia Pacific APAC Alcoholic Drinks Packaging Market Analysis, Insights and Forecast, 2019-2031
- 10.1. Market Analysis, Insights and Forecast - by Material
- 10.1.1. Plastic
- 10.1.2. Paper
- 10.1.3. Metal
- 10.1.4. Glass
- 10.2. Market Analysis, Insights and Forecast - by Product Type
- 10.2.1. Bottles
- 10.2.2. Cans
- 10.2.3. Pouches
- 10.2.4. Carton
- 10.1. Market Analysis, Insights and Forecast - by Material
- 11. North America APAC Alcoholic Drinks Packaging Market Analysis, Insights and Forecast, 2019-2031
- 11.1. Market Analysis, Insights and Forecast - By Country/Sub-region
- 11.1.1.
- 12. Europe APAC Alcoholic Drinks Packaging Market Analysis, Insights and Forecast, 2019-2031
- 12.1. Market Analysis, Insights and Forecast - By Country/Sub-region
- 12.1.1.
- 13. Asia APAC Alcoholic Drinks Packaging Market Analysis, Insights and Forecast, 2019-2031
- 13.1. Market Analysis, Insights and Forecast - By Country/Sub-region
- 13.1.1.
- 14. Australia and New Zealand APAC Alcoholic Drinks Packaging Market Analysis, Insights and Forecast, 2019-2031
- 14.1. Market Analysis, Insights and Forecast - By Country/Sub-region
- 14.1.1.
- 15. Latin America APAC Alcoholic Drinks Packaging Market Analysis, Insights and Forecast, 2019-2031
- 15.1. Market Analysis, Insights and Forecast - By Country/Sub-region
- 15.1.1.
- 16. Middle East and Africa APAC Alcoholic Drinks Packaging Market Analysis, Insights and Forecast, 2019-2031
- 16.1. Market Analysis, Insights and Forecast - By Country/Sub-region
- 16.1.1.
- 17. Competitive Analysis
- 17.1. Global Market Share Analysis 2024
- 17.2. Company Profiles
- 17.2.1 Hualian Glass Bottle
- 17.2.1.1. Overview
- 17.2.1.2. Products
- 17.2.1.3. SWOT Analysis
- 17.2.1.4. Recent Developments
- 17.2.1.5. Financials (Based on Availability)
- 17.2.2 Ball Corporation
- 17.2.2.1. Overview
- 17.2.2.2. Products
- 17.2.2.3. SWOT Analysis
- 17.2.2.4. Recent Developments
- 17.2.2.5. Financials (Based on Availability)
- 17.2.3 Crown Holdings Inc
- 17.2.3.1. Overview
- 17.2.3.2. Products
- 17.2.3.3. SWOT Analysis
- 17.2.3.4. Recent Developments
- 17.2.3.5. Financials (Based on Availability)
- 17.2.4 AGI Glaspac*List Not Exhaustive
- 17.2.4.1. Overview
- 17.2.4.2. Products
- 17.2.4.3. SWOT Analysis
- 17.2.4.4. Recent Developments
- 17.2.4.5. Financials (Based on Availability)
- 17.2.5 Amcor Group GmbH
- 17.2.5.1. Overview
- 17.2.5.2. Products
- 17.2.5.3. SWOT Analysis
- 17.2.5.4. Recent Developments
- 17.2.5.5. Financials (Based on Availability)
- 17.2.6 Mondi Group
- 17.2.6.1. Overview
- 17.2.6.2. Products
- 17.2.6.3. SWOT Analysis
- 17.2.6.4. Recent Developments
- 17.2.6.5. Financials (Based on Availability)
- 17.2.7 Gerresheimer AG
- 17.2.7.1. Overview
- 17.2.7.2. Products
- 17.2.7.3. SWOT Analysis
- 17.2.7.4. Recent Developments
- 17.2.7.5. Financials (Based on Availability)
- 17.2.1 Hualian Glass Bottle
List of Figures
- Figure 1: Global APAC Alcoholic Drinks Packaging Market Revenue Breakdown (Million, %) by Region 2024 & 2032
- Figure 2: North America APAC Alcoholic Drinks Packaging Market Revenue (Million), by Country 2024 & 2032
- Figure 3: North America APAC Alcoholic Drinks Packaging Market Revenue Share (%), by Country 2024 & 2032
- Figure 4: Europe APAC Alcoholic Drinks Packaging Market Revenue (Million), by Country 2024 & 2032
- Figure 5: Europe APAC Alcoholic Drinks Packaging Market Revenue Share (%), by Country 2024 & 2032
- Figure 6: Asia APAC Alcoholic Drinks Packaging Market Revenue (Million), by Country 2024 & 2032
- Figure 7: Asia APAC Alcoholic Drinks Packaging Market Revenue Share (%), by Country 2024 & 2032
- Figure 8: Australia and New Zealand APAC Alcoholic Drinks Packaging Market Revenue (Million), by Country 2024 & 2032
- Figure 9: Australia and New Zealand APAC Alcoholic Drinks Packaging Market Revenue Share (%), by Country 2024 & 2032
- Figure 10: Latin America APAC Alcoholic Drinks Packaging Market Revenue (Million), by Country 2024 & 2032
- Figure 11: Latin America APAC Alcoholic Drinks Packaging Market Revenue Share (%), by Country 2024 & 2032
- Figure 12: Middle East and Africa APAC Alcoholic Drinks Packaging Market Revenue (Million), by Country 2024 & 2032
- Figure 13: Middle East and Africa APAC Alcoholic Drinks Packaging Market Revenue Share (%), by Country 2024 & 2032
- Figure 14: North America APAC Alcoholic Drinks Packaging Market Revenue (Million), by Material 2024 & 2032
- Figure 15: North America APAC Alcoholic Drinks Packaging Market Revenue Share (%), by Material 2024 & 2032
- Figure 16: North America APAC Alcoholic Drinks Packaging Market Revenue (Million), by Product Type 2024 & 2032
- Figure 17: North America APAC Alcoholic Drinks Packaging Market Revenue Share (%), by Product Type 2024 & 2032
- Figure 18: North America APAC Alcoholic Drinks Packaging Market Revenue (Million), by Country 2024 & 2032
- Figure 19: North America APAC Alcoholic Drinks Packaging Market Revenue Share (%), by Country 2024 & 2032
- Figure 20: South America APAC Alcoholic Drinks Packaging Market Revenue (Million), by Material 2024 & 2032
- Figure 21: South America APAC Alcoholic Drinks Packaging Market Revenue Share (%), by Material 2024 & 2032
- Figure 22: South America APAC Alcoholic Drinks Packaging Market Revenue (Million), by Product Type 2024 & 2032
- Figure 23: South America APAC Alcoholic Drinks Packaging Market Revenue Share (%), by Product Type 2024 & 2032
- Figure 24: South America APAC Alcoholic Drinks Packaging Market Revenue (Million), by Country 2024 & 2032
- Figure 25: South America APAC Alcoholic Drinks Packaging Market Revenue Share (%), by Country 2024 & 2032
- Figure 26: Europe APAC Alcoholic Drinks Packaging Market Revenue (Million), by Material 2024 & 2032
- Figure 27: Europe APAC Alcoholic Drinks Packaging Market Revenue Share (%), by Material 2024 & 2032
- Figure 28: Europe APAC Alcoholic Drinks Packaging Market Revenue (Million), by Product Type 2024 & 2032
- Figure 29: Europe APAC Alcoholic Drinks Packaging Market Revenue Share (%), by Product Type 2024 & 2032
- Figure 30: Europe APAC Alcoholic Drinks Packaging Market Revenue (Million), by Country 2024 & 2032
- Figure 31: Europe APAC Alcoholic Drinks Packaging Market Revenue Share (%), by Country 2024 & 2032
- Figure 32: Middle East & Africa APAC Alcoholic Drinks Packaging Market Revenue (Million), by Material 2024 & 2032
- Figure 33: Middle East & Africa APAC Alcoholic Drinks Packaging Market Revenue Share (%), by Material 2024 & 2032
- Figure 34: Middle East & Africa APAC Alcoholic Drinks Packaging Market Revenue (Million), by Product Type 2024 & 2032
- Figure 35: Middle East & Africa APAC Alcoholic Drinks Packaging Market Revenue Share (%), by Product Type 2024 & 2032
- Figure 36: Middle East & Africa APAC Alcoholic Drinks Packaging Market Revenue (Million), by Country 2024 & 2032
- Figure 37: Middle East & Africa APAC Alcoholic Drinks Packaging Market Revenue Share (%), by Country 2024 & 2032
- Figure 38: Asia Pacific APAC Alcoholic Drinks Packaging Market Revenue (Million), by Material 2024 & 2032
- Figure 39: Asia Pacific APAC Alcoholic Drinks Packaging Market Revenue Share (%), by Material 2024 & 2032
- Figure 40: Asia Pacific APAC Alcoholic Drinks Packaging Market Revenue (Million), by Product Type 2024 & 2032
- Figure 41: Asia Pacific APAC Alcoholic Drinks Packaging Market Revenue Share (%), by Product Type 2024 & 2032
- Figure 42: Asia Pacific APAC Alcoholic Drinks Packaging Market Revenue (Million), by Country 2024 & 2032
- Figure 43: Asia Pacific APAC Alcoholic Drinks Packaging Market Revenue Share (%), by Country 2024 & 2032
List of Tables
- Table 1: Global APAC Alcoholic Drinks Packaging Market Revenue Million Forecast, by Region 2019 & 2032
- Table 2: Global APAC Alcoholic Drinks Packaging Market Revenue Million Forecast, by Material 2019 & 2032
- Table 3: Global APAC Alcoholic Drinks Packaging Market Revenue Million Forecast, by Product Type 2019 & 2032
- Table 4: Global APAC Alcoholic Drinks Packaging Market Revenue Million Forecast, by Region 2019 & 2032
- Table 5: Global APAC Alcoholic Drinks Packaging Market Revenue Million Forecast, by Country 2019 & 2032
- Table 6: APAC Alcoholic Drinks Packaging Market Revenue (Million) Forecast, by Application 2019 & 2032
- Table 7: Global APAC Alcoholic Drinks Packaging Market Revenue Million Forecast, by Country 2019 & 2032
- Table 8: APAC Alcoholic Drinks Packaging Market Revenue (Million) Forecast, by Application 2019 & 2032
- Table 9: Global APAC Alcoholic Drinks Packaging Market Revenue Million Forecast, by Country 2019 & 2032
- Table 10: APAC Alcoholic Drinks Packaging Market Revenue (Million) Forecast, by Application 2019 & 2032
- Table 11: Global APAC Alcoholic Drinks Packaging Market Revenue Million Forecast, by Country 2019 & 2032
- Table 12: APAC Alcoholic Drinks Packaging Market Revenue (Million) Forecast, by Application 2019 & 2032
- Table 13: Global APAC Alcoholic Drinks Packaging Market Revenue Million Forecast, by Country 2019 & 2032
- Table 14: APAC Alcoholic Drinks Packaging Market Revenue (Million) Forecast, by Application 2019 & 2032
- Table 15: Global APAC Alcoholic Drinks Packaging Market Revenue Million Forecast, by Country 2019 & 2032
- Table 16: APAC Alcoholic Drinks Packaging Market Revenue (Million) Forecast, by Application 2019 & 2032
- Table 17: Global APAC Alcoholic Drinks Packaging Market Revenue Million Forecast, by Material 2019 & 2032
- Table 18: Global APAC Alcoholic Drinks Packaging Market Revenue Million Forecast, by Product Type 2019 & 2032
- Table 19: Global APAC Alcoholic Drinks Packaging Market Revenue Million Forecast, by Country 2019 & 2032
- Table 20: United States APAC Alcoholic Drinks Packaging Market Revenue (Million) Forecast, by Application 2019 & 2032
- Table 21: Canada APAC Alcoholic Drinks Packaging Market Revenue (Million) Forecast, by Application 2019 & 2032
- Table 22: Mexico APAC Alcoholic Drinks Packaging Market Revenue (Million) Forecast, by Application 2019 & 2032
- Table 23: Global APAC Alcoholic Drinks Packaging Market Revenue Million Forecast, by Material 2019 & 2032
- Table 24: Global APAC Alcoholic Drinks Packaging Market Revenue Million Forecast, by Product Type 2019 & 2032
- Table 25: Global APAC Alcoholic Drinks Packaging Market Revenue Million Forecast, by Country 2019 & 2032
- Table 26: Brazil APAC Alcoholic Drinks Packaging Market Revenue (Million) Forecast, by Application 2019 & 2032
- Table 27: Argentina APAC Alcoholic Drinks Packaging Market Revenue (Million) Forecast, by Application 2019 & 2032
- Table 28: Rest of South America APAC Alcoholic Drinks Packaging Market Revenue (Million) Forecast, by Application 2019 & 2032
- Table 29: Global APAC Alcoholic Drinks Packaging Market Revenue Million Forecast, by Material 2019 & 2032
- Table 30: Global APAC Alcoholic Drinks Packaging Market Revenue Million Forecast, by Product Type 2019 & 2032
- Table 31: Global APAC Alcoholic Drinks Packaging Market Revenue Million Forecast, by Country 2019 & 2032
- Table 32: United Kingdom APAC Alcoholic Drinks Packaging Market Revenue (Million) Forecast, by Application 2019 & 2032
- Table 33: Germany APAC Alcoholic Drinks Packaging Market Revenue (Million) Forecast, by Application 2019 & 2032
- Table 34: France APAC Alcoholic Drinks Packaging Market Revenue (Million) Forecast, by Application 2019 & 2032
- Table 35: Italy APAC Alcoholic Drinks Packaging Market Revenue (Million) Forecast, by Application 2019 & 2032
- Table 36: Spain APAC Alcoholic Drinks Packaging Market Revenue (Million) Forecast, by Application 2019 & 2032
- Table 37: Russia APAC Alcoholic Drinks Packaging Market Revenue (Million) Forecast, by Application 2019 & 2032
- Table 38: Benelux APAC Alcoholic Drinks Packaging Market Revenue (Million) Forecast, by Application 2019 & 2032
- Table 39: Nordics APAC Alcoholic Drinks Packaging Market Revenue (Million) Forecast, by Application 2019 & 2032
- Table 40: Rest of Europe APAC Alcoholic Drinks Packaging Market Revenue (Million) Forecast, by Application 2019 & 2032
- Table 41: Global APAC Alcoholic Drinks Packaging Market Revenue Million Forecast, by Material 2019 & 2032
- Table 42: Global APAC Alcoholic Drinks Packaging Market Revenue Million Forecast, by Product Type 2019 & 2032
- Table 43: Global APAC Alcoholic Drinks Packaging Market Revenue Million Forecast, by Country 2019 & 2032
- Table 44: Turkey APAC Alcoholic Drinks Packaging Market Revenue (Million) Forecast, by Application 2019 & 2032
- Table 45: Israel APAC Alcoholic Drinks Packaging Market Revenue (Million) Forecast, by Application 2019 & 2032
- Table 46: GCC APAC Alcoholic Drinks Packaging Market Revenue (Million) Forecast, by Application 2019 & 2032
- Table 47: North Africa APAC Alcoholic Drinks Packaging Market Revenue (Million) Forecast, by Application 2019 & 2032
- Table 48: South Africa APAC Alcoholic Drinks Packaging Market Revenue (Million) Forecast, by Application 2019 & 2032
- Table 49: Rest of Middle East & Africa APAC Alcoholic Drinks Packaging Market Revenue (Million) Forecast, by Application 2019 & 2032
- Table 50: Global APAC Alcoholic Drinks Packaging Market Revenue Million Forecast, by Material 2019 & 2032
- Table 51: Global APAC Alcoholic Drinks Packaging Market Revenue Million Forecast, by Product Type 2019 & 2032
- Table 52: Global APAC Alcoholic Drinks Packaging Market Revenue Million Forecast, by Country 2019 & 2032
- Table 53: China APAC Alcoholic Drinks Packaging Market Revenue (Million) Forecast, by Application 2019 & 2032
- Table 54: India APAC Alcoholic Drinks Packaging Market Revenue (Million) Forecast, by Application 2019 & 2032
- Table 55: Japan APAC Alcoholic Drinks Packaging Market Revenue (Million) Forecast, by Application 2019 & 2032
- Table 56: South Korea APAC Alcoholic Drinks Packaging Market Revenue (Million) Forecast, by Application 2019 & 2032
- Table 57: ASEAN APAC Alcoholic Drinks Packaging Market Revenue (Million) Forecast, by Application 2019 & 2032
- Table 58: Oceania APAC Alcoholic Drinks Packaging Market Revenue (Million) Forecast, by Application 2019 & 2032
- Table 59: Rest of Asia Pacific APAC Alcoholic Drinks Packaging Market Revenue (Million) Forecast, by Application 2019 & 2032
Frequently Asked Questions
1. What is the projected Compound Annual Growth Rate (CAGR) of the APAC Alcoholic Drinks Packaging Market?
The projected CAGR is approximately 6.30%.
2. Which companies are prominent players in the APAC Alcoholic Drinks Packaging Market?
Key companies in the market include Hualian Glass Bottle, Ball Corporation, Crown Holdings Inc, AGI Glaspac*List Not Exhaustive, Amcor Group GmbH, Mondi Group, Gerresheimer AG.
3. What are the main segments of the APAC Alcoholic Drinks Packaging Market?
The market segments include Material, Product Type.
4. Can you provide details about the market size?
The market size is estimated to be USD 17.38 Million as of 2022.
5. What are some drivers contributing to market growth?
Increasing Demand for Sustainable Packaging; Increasing Consumption of Alcoholic Drinks in Asia.
6. What are the notable trends driving market growth?
Significant Growth in Metal Packaging to Boost the Market.
7. Are there any restraints impacting market growth?
Government Regulation for Plastic Usage.
8. Can you provide examples of recent developments in the market?
N/A
9. What pricing options are available for accessing the report?
Pricing options include single-user, multi-user, and enterprise licenses priced at USD 4750, USD 4950, and USD 6800 respectively.
10. Is the market size provided in terms of value or volume?
The market size is provided in terms of value, measured in Million.
11. Are there any specific market keywords associated with the report?
Yes, the market keyword associated with the report is "APAC Alcoholic Drinks Packaging Market," which aids in identifying and referencing the specific market segment covered.
12. How do I determine which pricing option suits my needs best?
The pricing options vary based on user requirements and access needs. Individual users may opt for single-user licenses, while businesses requiring broader access may choose multi-user or enterprise licenses for cost-effective access to the report.
13. Are there any additional resources or data provided in the APAC Alcoholic Drinks Packaging Market report?
While the report offers comprehensive insights, it's advisable to review the specific contents or supplementary materials provided to ascertain if additional resources or data are available.
14. How can I stay updated on further developments or reports in the APAC Alcoholic Drinks Packaging Market?
To stay informed about further developments, trends, and reports in the APAC Alcoholic Drinks Packaging Market, consider subscribing to industry newsletters, following relevant companies and organizations, or regularly checking reputable industry news sources and publications.
Methodology
Step 1 - Identification of Relevant Samples Size from Population Database


Step 2 - Approaches for Defining Global Market Size (Value, Volume* & Price*)

Note*: In applicable scenarios
Step 3 - Data Sources
Primary Research
- Web Analytics
- Survey Reports
- Research Institute
- Latest Research Reports
- Opinion Leaders
Secondary Research
- Annual Reports
- White Paper
- Latest Press Release
- Industry Association
- Paid Database
- Investor Presentations

Step 4 - Data Triangulation
Involves using different sources of information in order to increase the validity of a study
These sources are likely to be stakeholders in a program - participants, other researchers, program staff, other community members, and so on.
Then we put all data in single framework & apply various statistical tools to find out the dynamic on the market.
During the analysis stage, feedback from the stakeholder groups would be compared to determine areas of agreement as well as areas of divergence
