

Key Insights
The Asia-Pacific (APAC) sealants and adhesives market is experiencing robust growth, driven by the region's expanding construction, automotive, and packaging industries. The market's Compound Annual Growth Rate (CAGR) exceeding 6% signifies a significant upward trajectory projected through 2033. This expansion is fueled by increasing infrastructure development across major APAC economies like China, India, and Japan, alongside the rising demand for advanced materials in diverse sectors. The automotive industry's push for lightweight vehicles and improved fuel efficiency is a key catalyst, stimulating demand for high-performance adhesives and sealants. Furthermore, the packaging sector's continuous innovation and the adoption of sustainable packaging solutions are contributing to the market's growth. Specific segments within APAC showing particularly strong growth include polyurethane and silicone-based sealants and adhesives, which are favored for their versatile properties and performance characteristics. While challenges exist, such as fluctuating raw material prices and potential supply chain disruptions, the overall market outlook remains positive, indicating substantial opportunities for industry players.
The growth of the APAC sealants and adhesives market is further segmented by specific applications. The construction sector's burgeoning demand for durable and efficient building materials is a significant contributor. This includes adhesives for wood joining, flooring installation, and window sealing, along with sealants for waterproofing and insulation. The footwear and leather industry also contributes significantly to market demand, requiring high-quality adhesives for bonding various materials. The burgeoning electronics and consumer goods sectors are pushing for sophisticated adhesives capable of adhering to diverse materials and withstanding various environmental conditions. Within the adhesives resin category, polyurethanes and acrylics are prominent, exhibiting strong performance and broad applications across numerous end-user industries. Competitive forces within the APAC market are substantial with both global and regional players actively vying for market share, resulting in continuous product innovation and price competitiveness.
APAC Sealants & Adhesives Industry Market Report: 2019-2033
This comprehensive report provides an in-depth analysis of the Asia-Pacific (APAC) sealants and adhesives market, offering invaluable insights for industry professionals, investors, and strategic decision-makers. Covering the period from 2019 to 2033, with a base year of 2025, this report meticulously examines market dynamics, growth trends, dominant segments, and key players, equipping you with the knowledge needed to navigate this dynamic landscape. The report analyzes the market across various segments including adhesives technology (Solvent-borne, Reactive, Hot Melt, UV Cured Adhesives, Water-borne), sealants resin (Silicone, Polyurethane, Acrylic, Epoxy, Other Resins), and end-user industries (Aerospace, Automotive, Building & Construction, Footwear & Leather, Healthcare, Packaging, Woodworking & Joinery, and others). The market size is presented in Million units throughout the report.
APAC Sealants & Adhesives Industry Market Dynamics & Structure
This section analyzes the competitive landscape of the APAC sealants and adhesives market, exploring market concentration, technological advancements, regulatory influences, and market dynamics. The analysis encompasses a detailed examination of mergers and acquisitions (M&A) activities within the industry, providing a holistic understanding of the market structure.
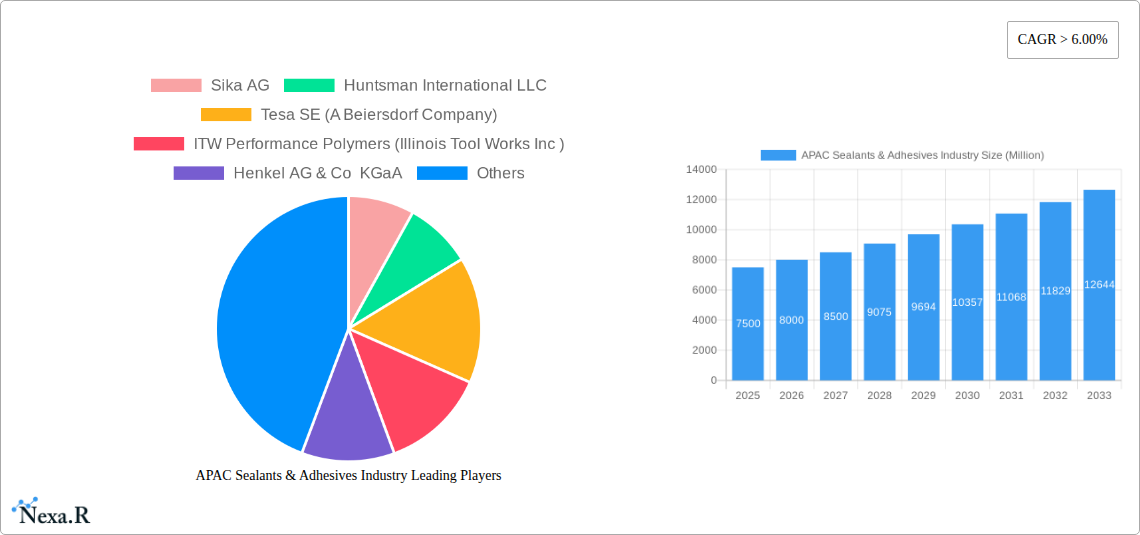
- Market Concentration: The APAC sealants and adhesives market exhibits a moderately concentrated structure, with key players like Sika AG, Huntsman International LLC, and Henkel AG & Co KGaA holding significant market shares. The market share of the top 5 players is estimated at xx%.
- Technological Innovation: Continuous innovation in adhesive technologies, such as the development of eco-friendly water-borne adhesives and high-performance UV-cured adhesives, is a major growth driver. However, high R&D costs and stringent regulatory approvals pose significant barriers to innovation.
- Regulatory Landscape: Stringent environmental regulations and safety standards are influencing product formulations and manufacturing processes. Compliance costs are a significant factor affecting profitability.
- Competitive Substitutes: The market faces competition from alternative materials like welding and mechanical fastening. However, the superior performance and versatility of sealants and adhesives often outweigh the alternatives.
- End-User Demographics: The burgeoning construction sector, particularly in rapidly developing economies like India and China, is driving substantial growth in demand for sealants and adhesives. The automotive and packaging industries also contribute significantly.
- M&A Activity: The past five years have witnessed xx M&A deals in the APAC sealants and adhesives market, primarily driven by the desire for expansion into new markets and technological diversification.
APAC Sealants & Adhesives Industry Growth Trends & Insights
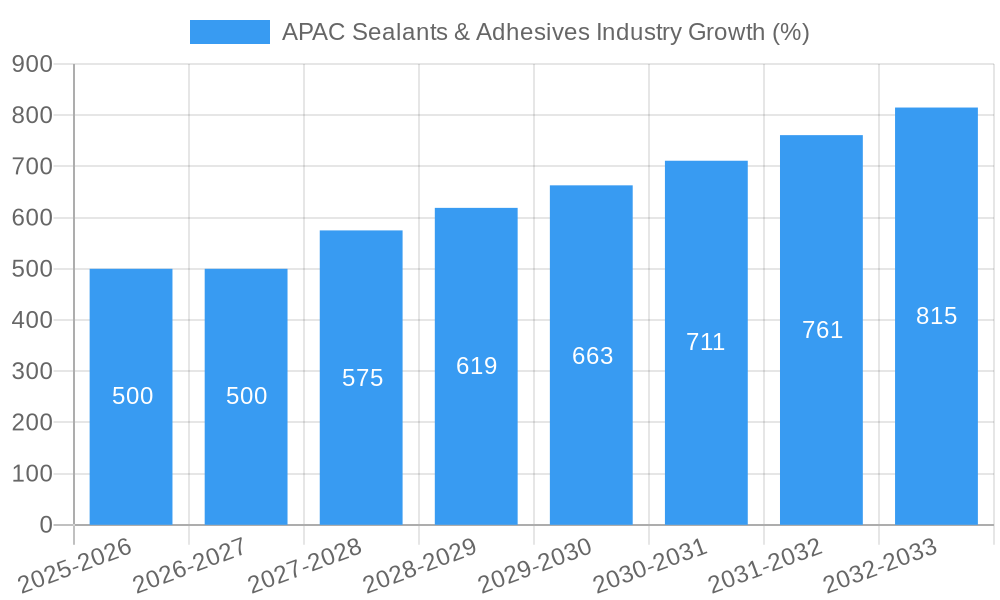
The APAC sealants and adhesives market is experiencing robust growth, driven by expanding end-user industries and technological advancements. The market size is projected to reach xx Million units by 2033, exhibiting a CAGR of xx% during the forecast period (2025-2033). This growth is fueled by factors such as increasing infrastructure development, rapid urbanization, and rising disposable incomes. Market penetration rates are increasing steadily across various end-user segments, indicating significant growth potential. Technological advancements, particularly in the development of high-performance, specialized adhesives, are contributing to higher adoption rates. Furthermore, changing consumer preferences towards durable and sustainable products are shaping demand.
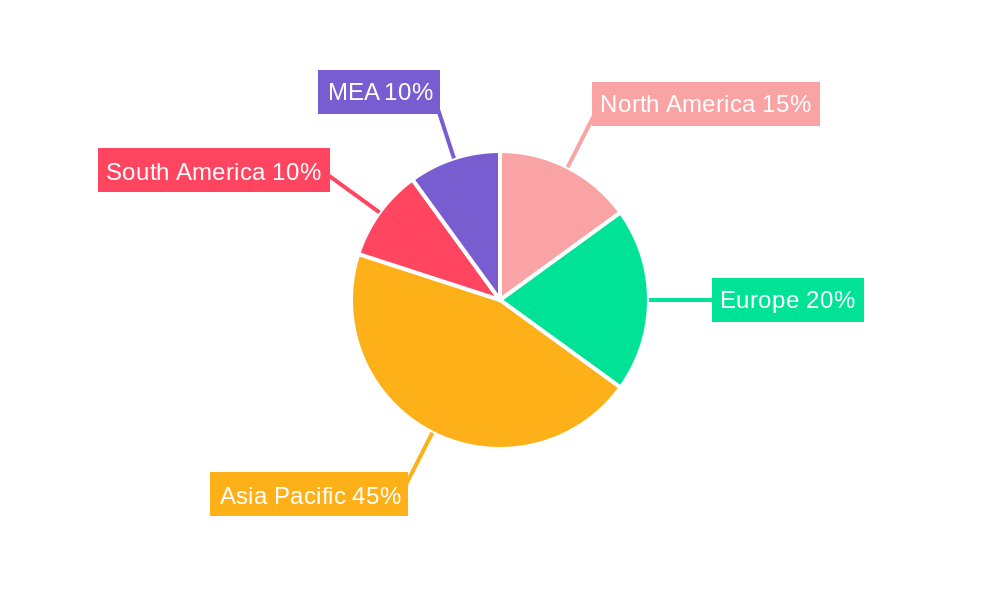
Dominant Regions, Countries, or Segments in APAC Sealants & Adhesives Industry
China and India dominate the APAC sealants and adhesives market, driven by robust construction activities and expanding manufacturing sectors. Within the segments, the building and construction industry accounts for the largest share, followed by the automotive and packaging sectors. High-growth segments include UV-cured adhesives for electronics and water-borne adhesives driven by sustainability concerns.
Key Drivers:
- Rapid urbanization and infrastructure development.
- Expanding automotive and packaging industries.
- Favorable government policies supporting construction.
- Increasing demand for high-performance, specialized adhesives.
Dominance Factors: China's dominance stems from its massive construction projects and manufacturing base. India's growth is fuelled by its rapidly expanding economy and infrastructure investments.
APAC Sealants & Adhesives Industry Product Landscape
The APAC sealants and adhesives market features a diverse range of products, encompassing various technologies and resin types tailored to specific applications. Recent innovations include high-strength, flexible adhesives, eco-friendly water-borne formulations, and advanced UV-cured adhesives for high-precision applications. These advancements enhance performance characteristics such as adhesion strength, durability, and curing speed. Unique selling propositions often include improved ease of application, faster curing times, and enhanced environmental profiles.
Key Drivers, Barriers & Challenges in APAP Sealants & Adhesives Industry
Key Drivers: Rising construction activity, growth in the automotive and packaging industries, and technological advancements in adhesive formulations are major drivers. Government initiatives promoting infrastructure development also play a crucial role.
Key Challenges: Fluctuating raw material prices, stringent environmental regulations, and intense competition from both domestic and international players pose significant challenges. Supply chain disruptions due to geopolitical factors can also impact production and availability. The impact of these challenges is estimated to reduce the overall market growth by approximately xx% by 2033.
Emerging Opportunities in APAC Sealants & Adhesives Industry
Untapped markets in rural areas, increasing demand for sustainable and eco-friendly products, and the rise of specialized applications in sectors like electronics and renewable energy present significant opportunities. Innovation in smart adhesives and advanced material science will further drive growth in niche applications.
Growth Accelerators in the APAC Sealants & Adhesives Industry
Technological breakthroughs in adhesive formulations, strategic partnerships for market expansion, and the adoption of sustainable manufacturing practices are key catalysts. Focus on developing high-performance, specialized adhesives for emerging applications will further accelerate growth.
Key Players Shaping the APAC Sealants & Adhesives Industry Market
- Sika AG
- Huntsman International LLC
- Tesa SE (A Beiersdorf Company)
- ITW Performance Polymers (Illinois Tool Works Inc)
- Henkel AG & Co KGaA
- Pidilite Industries Ltd
- Beardow Adams
- DuPont
- Dow
- Arkema
- H B Fuller Company
- 3M
- Mapei Inc
- Dymax Corporation
- Avery Dennison Corporation
- Wacker Chemie AG
- Jowat AG
- Ashland
- Franklin International
Notable Milestones in APAC Sealants & Adhesives Industry Sector
- 2021: Launch of a new generation of high-performance UV-cured adhesives by Sika AG.
- 2022: Acquisition of a regional adhesives manufacturer by Henkel AG & Co KGaA, expanding its market presence.
- 2023: Introduction of sustainable, water-based adhesives by several key players, meeting growing environmental concerns.
- Further notable milestones: xx
In-Depth APAC Sealants & Adhesives Industry Market Outlook
The APAC sealants and adhesives market is poised for sustained growth, driven by continued infrastructure development and expansion across key end-user industries. Strategic partnerships, technological innovation, and a focus on sustainability will further propel market expansion. The focus on niche applications, emerging technologies, and strategic partnerships will create considerable growth opportunities within the APAC market during the forecast period.
APAC Sealants & Adhesives Industry Segmentation
-
1. Adhesives Resin
- 1.1. Polyurethane
- 1.2. Epoxy
- 1.3. Acrylic
- 1.4. Silicone
- 1.5. Cyanoacrylate
- 1.6. VAE/EVA
- 1.7. Other Resins (Polyester, Rubber, etc.)
-
2. Adhesives Technology
- 2.1. Solvent-borne
- 2.2. Reactive
- 2.3. Hot Melt
- 2.4. UV Cured Adhesives
- 2.5. Water-borne
-
3. Sealants Resin
- 3.1. Silicone
- 3.2. Polyurethane
- 3.3. Acrylic
- 3.4. Epoxy
- 3.5. Other Re
-
4. End-User Industry
- 4.1. Aerospace
- 4.2. Automotive
- 4.3. Building and Construction
- 4.4. Footwear and Leather
- 4.5. Healthcare
- 4.6. Packaging
- 4.7. Woodworking And Joinery
- 4.8. Other En
-
5. Geography
- 5.1. China
- 5.2. India
- 5.3. Japan
- 5.4. South Korea
- 5.5. Indonesia
- 5.6. Malaysia
- 5.7. Thailand
- 5.8. Vietnam
- 5.9. Rest of Asia-Pacific
APAC Sealants & Adhesives Industry Segmentation By Geography
- 1. China
- 2. India
- 3. Japan
- 4. South Korea
- 5. Indonesia
- 6. Malaysia
- 7. Thailand
- 8. Vietnam
- 9. Rest of Asia Pacific
APAC Sealants & Adhesives Industry REPORT HIGHLIGHTS
| Aspects | Details |
|---|---|
| Study Period | 2019-2033 |
| Base Year | 2024 |
| Estimated Year | 2025 |
| Forecast Period | 2025-2033 |
| Historical Period | 2019-2024 |
| Growth Rate | CAGR of > 6.00% from 2019-2033 |
| Segmentation |
|
Table of Contents
- 1. Introduction
- 1.1. Research Scope
- 1.2. Market Segmentation
- 1.3. Research Methodology
- 1.4. Definitions and Assumptions
- 2. Executive Summary
- 2.1. Introduction
- 3. Market Dynamics
- 3.1. Introduction
- 3.2. Market Drivers
- 3.2.1. Growing Packaging Industry in South-East Asia Countries; Growing Demand in Construction Sector; Other Drivers
- 3.3. Market Restrains
- 3.3.1. Stringent Environmental Regulations Regarding VOC Emissions; High Fluctuations in Raw Material Pricing
- 3.4. Market Trends
- 3.4.1. Packaging Segment to Dominate the Market
- 4. Market Factor Analysis
- 4.1. Porters Five Forces
- 4.2. Supply/Value Chain
- 4.3. PESTEL analysis
- 4.4. Market Entropy
- 4.5. Patent/Trademark Analysis
- 5. Global APAC Sealants & Adhesives Industry Analysis, Insights and Forecast, 2019-2031
- 5.1. Market Analysis, Insights and Forecast - by Adhesives Resin
- 5.1.1. Polyurethane
- 5.1.2. Epoxy
- 5.1.3. Acrylic
- 5.1.4. Silicone
- 5.1.5. Cyanoacrylate
- 5.1.6. VAE/EVA
- 5.1.7. Other Resins (Polyester, Rubber, etc.)
- 5.2. Market Analysis, Insights and Forecast - by Adhesives Technology
- 5.2.1. Solvent-borne
- 5.2.2. Reactive
- 5.2.3. Hot Melt
- 5.2.4. UV Cured Adhesives
- 5.2.5. Water-borne
- 5.3. Market Analysis, Insights and Forecast - by Sealants Resin
- 5.3.1. Silicone
- 5.3.2. Polyurethane
- 5.3.3. Acrylic
- 5.3.4. Epoxy
- 5.3.5. Other Re
- 5.4. Market Analysis, Insights and Forecast - by End-User Industry
- 5.4.1. Aerospace
- 5.4.2. Automotive
- 5.4.3. Building and Construction
- 5.4.4. Footwear and Leather
- 5.4.5. Healthcare
- 5.4.6. Packaging
- 5.4.7. Woodworking And Joinery
- 5.4.8. Other En
- 5.5. Market Analysis, Insights and Forecast - by Geography
- 5.5.1. China
- 5.5.2. India
- 5.5.3. Japan
- 5.5.4. South Korea
- 5.5.5. Indonesia
- 5.5.6. Malaysia
- 5.5.7. Thailand
- 5.5.8. Vietnam
- 5.5.9. Rest of Asia-Pacific
- 5.6. Market Analysis, Insights and Forecast - by Region
- 5.6.1. China
- 5.6.2. India
- 5.6.3. Japan
- 5.6.4. South Korea
- 5.6.5. Indonesia
- 5.6.6. Malaysia
- 5.6.7. Thailand
- 5.6.8. Vietnam
- 5.6.9. Rest of Asia Pacific
- 5.1. Market Analysis, Insights and Forecast - by Adhesives Resin
- 6. China APAC Sealants & Adhesives Industry Analysis, Insights and Forecast, 2019-2031
- 6.1. Market Analysis, Insights and Forecast - by Adhesives Resin
- 6.1.1. Polyurethane
- 6.1.2. Epoxy
- 6.1.3. Acrylic
- 6.1.4. Silicone
- 6.1.5. Cyanoacrylate
- 6.1.6. VAE/EVA
- 6.1.7. Other Resins (Polyester, Rubber, etc.)
- 6.2. Market Analysis, Insights and Forecast - by Adhesives Technology
- 6.2.1. Solvent-borne
- 6.2.2. Reactive
- 6.2.3. Hot Melt
- 6.2.4. UV Cured Adhesives
- 6.2.5. Water-borne
- 6.3. Market Analysis, Insights and Forecast - by Sealants Resin
- 6.3.1. Silicone
- 6.3.2. Polyurethane
- 6.3.3. Acrylic
- 6.3.4. Epoxy
- 6.3.5. Other Re
- 6.4. Market Analysis, Insights and Forecast - by End-User Industry
- 6.4.1. Aerospace
- 6.4.2. Automotive
- 6.4.3. Building and Construction
- 6.4.4. Footwear and Leather
- 6.4.5. Healthcare
- 6.4.6. Packaging
- 6.4.7. Woodworking And Joinery
- 6.4.8. Other En
- 6.5. Market Analysis, Insights and Forecast - by Geography
- 6.5.1. China
- 6.5.2. India
- 6.5.3. Japan
- 6.5.4. South Korea
- 6.5.5. Indonesia
- 6.5.6. Malaysia
- 6.5.7. Thailand
- 6.5.8. Vietnam
- 6.5.9. Rest of Asia-Pacific
- 6.1. Market Analysis, Insights and Forecast - by Adhesives Resin
- 7. India APAC Sealants & Adhesives Industry Analysis, Insights and Forecast, 2019-2031
- 7.1. Market Analysis, Insights and Forecast - by Adhesives Resin
- 7.1.1. Polyurethane
- 7.1.2. Epoxy
- 7.1.3. Acrylic
- 7.1.4. Silicone
- 7.1.5. Cyanoacrylate
- 7.1.6. VAE/EVA
- 7.1.7. Other Resins (Polyester, Rubber, etc.)
- 7.2. Market Analysis, Insights and Forecast - by Adhesives Technology
- 7.2.1. Solvent-borne
- 7.2.2. Reactive
- 7.2.3. Hot Melt
- 7.2.4. UV Cured Adhesives
- 7.2.5. Water-borne
- 7.3. Market Analysis, Insights and Forecast - by Sealants Resin
- 7.3.1. Silicone
- 7.3.2. Polyurethane
- 7.3.3. Acrylic
- 7.3.4. Epoxy
- 7.3.5. Other Re
- 7.4. Market Analysis, Insights and Forecast - by End-User Industry
- 7.4.1. Aerospace
- 7.4.2. Automotive
- 7.4.3. Building and Construction
- 7.4.4. Footwear and Leather
- 7.4.5. Healthcare
- 7.4.6. Packaging
- 7.4.7. Woodworking And Joinery
- 7.4.8. Other En
- 7.5. Market Analysis, Insights and Forecast - by Geography
- 7.5.1. China
- 7.5.2. India
- 7.5.3. Japan
- 7.5.4. South Korea
- 7.5.5. Indonesia
- 7.5.6. Malaysia
- 7.5.7. Thailand
- 7.5.8. Vietnam
- 7.5.9. Rest of Asia-Pacific
- 7.1. Market Analysis, Insights and Forecast - by Adhesives Resin
- 8. Japan APAC Sealants & Adhesives Industry Analysis, Insights and Forecast, 2019-2031
- 8.1. Market Analysis, Insights and Forecast - by Adhesives Resin
- 8.1.1. Polyurethane
- 8.1.2. Epoxy
- 8.1.3. Acrylic
- 8.1.4. Silicone
- 8.1.5. Cyanoacrylate
- 8.1.6. VAE/EVA
- 8.1.7. Other Resins (Polyester, Rubber, etc.)
- 8.2. Market Analysis, Insights and Forecast - by Adhesives Technology
- 8.2.1. Solvent-borne
- 8.2.2. Reactive
- 8.2.3. Hot Melt
- 8.2.4. UV Cured Adhesives
- 8.2.5. Water-borne
- 8.3. Market Analysis, Insights and Forecast - by Sealants Resin
- 8.3.1. Silicone
- 8.3.2. Polyurethane
- 8.3.3. Acrylic
- 8.3.4. Epoxy
- 8.3.5. Other Re
- 8.4. Market Analysis, Insights and Forecast - by End-User Industry
- 8.4.1. Aerospace
- 8.4.2. Automotive
- 8.4.3. Building and Construction
- 8.4.4. Footwear and Leather
- 8.4.5. Healthcare
- 8.4.6. Packaging
- 8.4.7. Woodworking And Joinery
- 8.4.8. Other En
- 8.5. Market Analysis, Insights and Forecast - by Geography
- 8.5.1. China
- 8.5.2. India
- 8.5.3. Japan
- 8.5.4. South Korea
- 8.5.5. Indonesia
- 8.5.6. Malaysia
- 8.5.7. Thailand
- 8.5.8. Vietnam
- 8.5.9. Rest of Asia-Pacific
- 8.1. Market Analysis, Insights and Forecast - by Adhesives Resin
- 9. South Korea APAC Sealants & Adhesives Industry Analysis, Insights and Forecast, 2019-2031
- 9.1. Market Analysis, Insights and Forecast - by Adhesives Resin
- 9.1.1. Polyurethane
- 9.1.2. Epoxy
- 9.1.3. Acrylic
- 9.1.4. Silicone
- 9.1.5. Cyanoacrylate
- 9.1.6. VAE/EVA
- 9.1.7. Other Resins (Polyester, Rubber, etc.)
- 9.2. Market Analysis, Insights and Forecast - by Adhesives Technology
- 9.2.1. Solvent-borne
- 9.2.2. Reactive
- 9.2.3. Hot Melt
- 9.2.4. UV Cured Adhesives
- 9.2.5. Water-borne
- 9.3. Market Analysis, Insights and Forecast - by Sealants Resin
- 9.3.1. Silicone
- 9.3.2. Polyurethane
- 9.3.3. Acrylic
- 9.3.4. Epoxy
- 9.3.5. Other Re
- 9.4. Market Analysis, Insights and Forecast - by End-User Industry
- 9.4.1. Aerospace
- 9.4.2. Automotive
- 9.4.3. Building and Construction
- 9.4.4. Footwear and Leather
- 9.4.5. Healthcare
- 9.4.6. Packaging
- 9.4.7. Woodworking And Joinery
- 9.4.8. Other En
- 9.5. Market Analysis, Insights and Forecast - by Geography
- 9.5.1. China
- 9.5.2. India
- 9.5.3. Japan
- 9.5.4. South Korea
- 9.5.5. Indonesia
- 9.5.6. Malaysia
- 9.5.7. Thailand
- 9.5.8. Vietnam
- 9.5.9. Rest of Asia-Pacific
- 9.1. Market Analysis, Insights and Forecast - by Adhesives Resin
- 10. Indonesia APAC Sealants & Adhesives Industry Analysis, Insights and Forecast, 2019-2031
- 10.1. Market Analysis, Insights and Forecast - by Adhesives Resin
- 10.1.1. Polyurethane
- 10.1.2. Epoxy
- 10.1.3. Acrylic
- 10.1.4. Silicone
- 10.1.5. Cyanoacrylate
- 10.1.6. VAE/EVA
- 10.1.7. Other Resins (Polyester, Rubber, etc.)
- 10.2. Market Analysis, Insights and Forecast - by Adhesives Technology
- 10.2.1. Solvent-borne
- 10.2.2. Reactive
- 10.2.3. Hot Melt
- 10.2.4. UV Cured Adhesives
- 10.2.5. Water-borne
- 10.3. Market Analysis, Insights and Forecast - by Sealants Resin
- 10.3.1. Silicone
- 10.3.2. Polyurethane
- 10.3.3. Acrylic
- 10.3.4. Epoxy
- 10.3.5. Other Re
- 10.4. Market Analysis, Insights and Forecast - by End-User Industry
- 10.4.1. Aerospace
- 10.4.2. Automotive
- 10.4.3. Building and Construction
- 10.4.4. Footwear and Leather
- 10.4.5. Healthcare
- 10.4.6. Packaging
- 10.4.7. Woodworking And Joinery
- 10.4.8. Other En
- 10.5. Market Analysis, Insights and Forecast - by Geography
- 10.5.1. China
- 10.5.2. India
- 10.5.3. Japan
- 10.5.4. South Korea
- 10.5.5. Indonesia
- 10.5.6. Malaysia
- 10.5.7. Thailand
- 10.5.8. Vietnam
- 10.5.9. Rest of Asia-Pacific
- 10.1. Market Analysis, Insights and Forecast - by Adhesives Resin
- 11. Malaysia APAC Sealants & Adhesives Industry Analysis, Insights and Forecast, 2019-2031
- 11.1. Market Analysis, Insights and Forecast - by Adhesives Resin
- 11.1.1. Polyurethane
- 11.1.2. Epoxy
- 11.1.3. Acrylic
- 11.1.4. Silicone
- 11.1.5. Cyanoacrylate
- 11.1.6. VAE/EVA
- 11.1.7. Other Resins (Polyester, Rubber, etc.)
- 11.2. Market Analysis, Insights and Forecast - by Adhesives Technology
- 11.2.1. Solvent-borne
- 11.2.2. Reactive
- 11.2.3. Hot Melt
- 11.2.4. UV Cured Adhesives
- 11.2.5. Water-borne
- 11.3. Market Analysis, Insights and Forecast - by Sealants Resin
- 11.3.1. Silicone
- 11.3.2. Polyurethane
- 11.3.3. Acrylic
- 11.3.4. Epoxy
- 11.3.5. Other Re
- 11.4. Market Analysis, Insights and Forecast - by End-User Industry
- 11.4.1. Aerospace
- 11.4.2. Automotive
- 11.4.3. Building and Construction
- 11.4.4. Footwear and Leather
- 11.4.5. Healthcare
- 11.4.6. Packaging
- 11.4.7. Woodworking And Joinery
- 11.4.8. Other En
- 11.5. Market Analysis, Insights and Forecast - by Geography
- 11.5.1. China
- 11.5.2. India
- 11.5.3. Japan
- 11.5.4. South Korea
- 11.5.5. Indonesia
- 11.5.6. Malaysia
- 11.5.7. Thailand
- 11.5.8. Vietnam
- 11.5.9. Rest of Asia-Pacific
- 11.1. Market Analysis, Insights and Forecast - by Adhesives Resin
- 12. Thailand APAC Sealants & Adhesives Industry Analysis, Insights and Forecast, 2019-2031
- 12.1. Market Analysis, Insights and Forecast - by Adhesives Resin
- 12.1.1. Polyurethane
- 12.1.2. Epoxy
- 12.1.3. Acrylic
- 12.1.4. Silicone
- 12.1.5. Cyanoacrylate
- 12.1.6. VAE/EVA
- 12.1.7. Other Resins (Polyester, Rubber, etc.)
- 12.2. Market Analysis, Insights and Forecast - by Adhesives Technology
- 12.2.1. Solvent-borne
- 12.2.2. Reactive
- 12.2.3. Hot Melt
- 12.2.4. UV Cured Adhesives
- 12.2.5. Water-borne
- 12.3. Market Analysis, Insights and Forecast - by Sealants Resin
- 12.3.1. Silicone
- 12.3.2. Polyurethane
- 12.3.3. Acrylic
- 12.3.4. Epoxy
- 12.3.5. Other Re
- 12.4. Market Analysis, Insights and Forecast - by End-User Industry
- 12.4.1. Aerospace
- 12.4.2. Automotive
- 12.4.3. Building and Construction
- 12.4.4. Footwear and Leather
- 12.4.5. Healthcare
- 12.4.6. Packaging
- 12.4.7. Woodworking And Joinery
- 12.4.8. Other En
- 12.5. Market Analysis, Insights and Forecast - by Geography
- 12.5.1. China
- 12.5.2. India
- 12.5.3. Japan
- 12.5.4. South Korea
- 12.5.5. Indonesia
- 12.5.6. Malaysia
- 12.5.7. Thailand
- 12.5.8. Vietnam
- 12.5.9. Rest of Asia-Pacific
- 12.1. Market Analysis, Insights and Forecast - by Adhesives Resin
- 13. Vietnam APAC Sealants & Adhesives Industry Analysis, Insights and Forecast, 2019-2031
- 13.1. Market Analysis, Insights and Forecast - by Adhesives Resin
- 13.1.1. Polyurethane
- 13.1.2. Epoxy
- 13.1.3. Acrylic
- 13.1.4. Silicone
- 13.1.5. Cyanoacrylate
- 13.1.6. VAE/EVA
- 13.1.7. Other Resins (Polyester, Rubber, etc.)
- 13.2. Market Analysis, Insights and Forecast - by Adhesives Technology
- 13.2.1. Solvent-borne
- 13.2.2. Reactive
- 13.2.3. Hot Melt
- 13.2.4. UV Cured Adhesives
- 13.2.5. Water-borne
- 13.3. Market Analysis, Insights and Forecast - by Sealants Resin
- 13.3.1. Silicone
- 13.3.2. Polyurethane
- 13.3.3. Acrylic
- 13.3.4. Epoxy
- 13.3.5. Other Re
- 13.4. Market Analysis, Insights and Forecast - by End-User Industry
- 13.4.1. Aerospace
- 13.4.2. Automotive
- 13.4.3. Building and Construction
- 13.4.4. Footwear and Leather
- 13.4.5. Healthcare
- 13.4.6. Packaging
- 13.4.7. Woodworking And Joinery
- 13.4.8. Other En
- 13.5. Market Analysis, Insights and Forecast - by Geography
- 13.5.1. China
- 13.5.2. India
- 13.5.3. Japan
- 13.5.4. South Korea
- 13.5.5. Indonesia
- 13.5.6. Malaysia
- 13.5.7. Thailand
- 13.5.8. Vietnam
- 13.5.9. Rest of Asia-Pacific
- 13.1. Market Analysis, Insights and Forecast - by Adhesives Resin
- 14. Rest of Asia Pacific APAC Sealants & Adhesives Industry Analysis, Insights and Forecast, 2019-2031
- 14.1. Market Analysis, Insights and Forecast - by Adhesives Resin
- 14.1.1. Polyurethane
- 14.1.2. Epoxy
- 14.1.3. Acrylic
- 14.1.4. Silicone
- 14.1.5. Cyanoacrylate
- 14.1.6. VAE/EVA
- 14.1.7. Other Resins (Polyester, Rubber, etc.)
- 14.2. Market Analysis, Insights and Forecast - by Adhesives Technology
- 14.2.1. Solvent-borne
- 14.2.2. Reactive
- 14.2.3. Hot Melt
- 14.2.4. UV Cured Adhesives
- 14.2.5. Water-borne
- 14.3. Market Analysis, Insights and Forecast - by Sealants Resin
- 14.3.1. Silicone
- 14.3.2. Polyurethane
- 14.3.3. Acrylic
- 14.3.4. Epoxy
- 14.3.5. Other Re
- 14.4. Market Analysis, Insights and Forecast - by End-User Industry
- 14.4.1. Aerospace
- 14.4.2. Automotive
- 14.4.3. Building and Construction
- 14.4.4. Footwear and Leather
- 14.4.5. Healthcare
- 14.4.6. Packaging
- 14.4.7. Woodworking And Joinery
- 14.4.8. Other En
- 14.5. Market Analysis, Insights and Forecast - by Geography
- 14.5.1. China
- 14.5.2. India
- 14.5.3. Japan
- 14.5.4. South Korea
- 14.5.5. Indonesia
- 14.5.6. Malaysia
- 14.5.7. Thailand
- 14.5.8. Vietnam
- 14.5.9. Rest of Asia-Pacific
- 14.1. Market Analysis, Insights and Forecast - by Adhesives Resin
- 15. North America APAC Sealants & Adhesives Industry Analysis, Insights and Forecast, 2019-2031
- 15.1. Market Analysis, Insights and Forecast - By Country/Sub-region
- 15.1.1 United States
- 15.1.2 Canada
- 15.1.3 Mexico
- 16. Europe APAC Sealants & Adhesives Industry Analysis, Insights and Forecast, 2019-2031
- 16.1. Market Analysis, Insights and Forecast - By Country/Sub-region
- 16.1.1 Germany
- 16.1.2 United Kingdom
- 16.1.3 France
- 16.1.4 Spain
- 16.1.5 Italy
- 16.1.6 Spain
- 16.1.7 Belgium
- 16.1.8 Netherland
- 16.1.9 Nordics
- 16.1.10 Rest of Europe
- 17. Asia Pacific APAC Sealants & Adhesives Industry Analysis, Insights and Forecast, 2019-2031
- 17.1. Market Analysis, Insights and Forecast - By Country/Sub-region
- 17.1.1 China
- 17.1.2 Japan
- 17.1.3 India
- 17.1.4 South Korea
- 17.1.5 Southeast Asia
- 17.1.6 Australia
- 17.1.7 Indonesia
- 17.1.8 Phillipes
- 17.1.9 Singapore
- 17.1.10 Thailandc
- 17.1.11 Rest of Asia Pacific
- 18. South America APAC Sealants & Adhesives Industry Analysis, Insights and Forecast, 2019-2031
- 18.1. Market Analysis, Insights and Forecast - By Country/Sub-region
- 18.1.1 Brazil
- 18.1.2 Argentina
- 18.1.3 Peru
- 18.1.4 Chile
- 18.1.5 Colombia
- 18.1.6 Ecuador
- 18.1.7 Venezuela
- 18.1.8 Rest of South America
- 19. North America APAC Sealants & Adhesives Industry Analysis, Insights and Forecast, 2019-2031
- 19.1. Market Analysis, Insights and Forecast - By Country/Sub-region
- 19.1.1 United States
- 19.1.2 Canada
- 19.1.3 Mexico
- 20. MEA APAC Sealants & Adhesives Industry Analysis, Insights and Forecast, 2019-2031
- 20.1. Market Analysis, Insights and Forecast - By Country/Sub-region
- 20.1.1 United Arab Emirates
- 20.1.2 Saudi Arabia
- 20.1.3 South Africa
- 20.1.4 Rest of Middle East and Africa
- 21. Competitive Analysis
- 21.1. Global Market Share Analysis 2024
- 21.2. Company Profiles
- 21.2.1 Sika AG
- 21.2.1.1. Overview
- 21.2.1.2. Products
- 21.2.1.3. SWOT Analysis
- 21.2.1.4. Recent Developments
- 21.2.1.5. Financials (Based on Availability)
- 21.2.2 Huntsman International LLC
- 21.2.2.1. Overview
- 21.2.2.2. Products
- 21.2.2.3. SWOT Analysis
- 21.2.2.4. Recent Developments
- 21.2.2.5. Financials (Based on Availability)
- 21.2.3 Tesa SE (A Beiersdorf Company)
- 21.2.3.1. Overview
- 21.2.3.2. Products
- 21.2.3.3. SWOT Analysis
- 21.2.3.4. Recent Developments
- 21.2.3.5. Financials (Based on Availability)
- 21.2.4 ITW Performance Polymers (Illinois Tool Works Inc )
- 21.2.4.1. Overview
- 21.2.4.2. Products
- 21.2.4.3. SWOT Analysis
- 21.2.4.4. Recent Developments
- 21.2.4.5. Financials (Based on Availability)
- 21.2.5 Henkel AG & Co KGaA
- 21.2.5.1. Overview
- 21.2.5.2. Products
- 21.2.5.3. SWOT Analysis
- 21.2.5.4. Recent Developments
- 21.2.5.5. Financials (Based on Availability)
- 21.2.6 Pidilite Industries Ltd
- 21.2.6.1. Overview
- 21.2.6.2. Products
- 21.2.6.3. SWOT Analysis
- 21.2.6.4. Recent Developments
- 21.2.6.5. Financials (Based on Availability)
- 21.2.7 Beardow Adams
- 21.2.7.1. Overview
- 21.2.7.2. Products
- 21.2.7.3. SWOT Analysis
- 21.2.7.4. Recent Developments
- 21.2.7.5. Financials (Based on Availability)
- 21.2.8 DuPont
- 21.2.8.1. Overview
- 21.2.8.2. Products
- 21.2.8.3. SWOT Analysis
- 21.2.8.4. Recent Developments
- 21.2.8.5. Financials (Based on Availability)
- 21.2.9 Dow
- 21.2.9.1. Overview
- 21.2.9.2. Products
- 21.2.9.3. SWOT Analysis
- 21.2.9.4. Recent Developments
- 21.2.9.5. Financials (Based on Availability)
- 21.2.10 Arkema
- 21.2.10.1. Overview
- 21.2.10.2. Products
- 21.2.10.3. SWOT Analysis
- 21.2.10.4. Recent Developments
- 21.2.10.5. Financials (Based on Availability)
- 21.2.11 H B Fuller Company
- 21.2.11.1. Overview
- 21.2.11.2. Products
- 21.2.11.3. SWOT Analysis
- 21.2.11.4. Recent Developments
- 21.2.11.5. Financials (Based on Availability)
- 21.2.12 3M
- 21.2.12.1. Overview
- 21.2.12.2. Products
- 21.2.12.3. SWOT Analysis
- 21.2.12.4. Recent Developments
- 21.2.12.5. Financials (Based on Availability)
- 21.2.13 Mapei Inc
- 21.2.13.1. Overview
- 21.2.13.2. Products
- 21.2.13.3. SWOT Analysis
- 21.2.13.4. Recent Developments
- 21.2.13.5. Financials (Based on Availability)
- 21.2.14 Dymax Corporation
- 21.2.14.1. Overview
- 21.2.14.2. Products
- 21.2.14.3. SWOT Analysis
- 21.2.14.4. Recent Developments
- 21.2.14.5. Financials (Based on Availability)
- 21.2.15 Avery Dennison Corporation
- 21.2.15.1. Overview
- 21.2.15.2. Products
- 21.2.15.3. SWOT Analysis
- 21.2.15.4. Recent Developments
- 21.2.15.5. Financials (Based on Availability)
- 21.2.16 Wacker Chemie AG*List Not Exhaustive
- 21.2.16.1. Overview
- 21.2.16.2. Products
- 21.2.16.3. SWOT Analysis
- 21.2.16.4. Recent Developments
- 21.2.16.5. Financials (Based on Availability)
- 21.2.17 Jowat AG
- 21.2.17.1. Overview
- 21.2.17.2. Products
- 21.2.17.3. SWOT Analysis
- 21.2.17.4. Recent Developments
- 21.2.17.5. Financials (Based on Availability)
- 21.2.18 Ashland
- 21.2.18.1. Overview
- 21.2.18.2. Products
- 21.2.18.3. SWOT Analysis
- 21.2.18.4. Recent Developments
- 21.2.18.5. Financials (Based on Availability)
- 21.2.19 Franklin International
- 21.2.19.1. Overview
- 21.2.19.2. Products
- 21.2.19.3. SWOT Analysis
- 21.2.19.4. Recent Developments
- 21.2.19.5. Financials (Based on Availability)
- 21.2.1 Sika AG
List of Figures
- Figure 1: Global APAC Sealants & Adhesives Industry Revenue Breakdown (Million, %) by Region 2024 & 2032
- Figure 2: North America APAC Sealants & Adhesives Industry Revenue (Million), by Country 2024 & 2032
- Figure 3: North America APAC Sealants & Adhesives Industry Revenue Share (%), by Country 2024 & 2032
- Figure 4: Europe APAC Sealants & Adhesives Industry Revenue (Million), by Country 2024 & 2032
- Figure 5: Europe APAC Sealants & Adhesives Industry Revenue Share (%), by Country 2024 & 2032
- Figure 6: Asia Pacific APAC Sealants & Adhesives Industry Revenue (Million), by Country 2024 & 2032
- Figure 7: Asia Pacific APAC Sealants & Adhesives Industry Revenue Share (%), by Country 2024 & 2032
- Figure 8: South America APAC Sealants & Adhesives Industry Revenue (Million), by Country 2024 & 2032
- Figure 9: South America APAC Sealants & Adhesives Industry Revenue Share (%), by Country 2024 & 2032
- Figure 10: North America APAC Sealants & Adhesives Industry Revenue (Million), by Country 2024 & 2032
- Figure 11: North America APAC Sealants & Adhesives Industry Revenue Share (%), by Country 2024 & 2032
- Figure 12: MEA APAC Sealants & Adhesives Industry Revenue (Million), by Country 2024 & 2032
- Figure 13: MEA APAC Sealants & Adhesives Industry Revenue Share (%), by Country 2024 & 2032
- Figure 14: China APAC Sealants & Adhesives Industry Revenue (Million), by Adhesives Resin 2024 & 2032
- Figure 15: China APAC Sealants & Adhesives Industry Revenue Share (%), by Adhesives Resin 2024 & 2032
- Figure 16: China APAC Sealants & Adhesives Industry Revenue (Million), by Adhesives Technology 2024 & 2032
- Figure 17: China APAC Sealants & Adhesives Industry Revenue Share (%), by Adhesives Technology 2024 & 2032
- Figure 18: China APAC Sealants & Adhesives Industry Revenue (Million), by Sealants Resin 2024 & 2032
- Figure 19: China APAC Sealants & Adhesives Industry Revenue Share (%), by Sealants Resin 2024 & 2032
- Figure 20: China APAC Sealants & Adhesives Industry Revenue (Million), by End-User Industry 2024 & 2032
- Figure 21: China APAC Sealants & Adhesives Industry Revenue Share (%), by End-User Industry 2024 & 2032
- Figure 22: China APAC Sealants & Adhesives Industry Revenue (Million), by Geography 2024 & 2032
- Figure 23: China APAC Sealants & Adhesives Industry Revenue Share (%), by Geography 2024 & 2032
- Figure 24: China APAC Sealants & Adhesives Industry Revenue (Million), by Country 2024 & 2032
- Figure 25: China APAC Sealants & Adhesives Industry Revenue Share (%), by Country 2024 & 2032
- Figure 26: India APAC Sealants & Adhesives Industry Revenue (Million), by Adhesives Resin 2024 & 2032
- Figure 27: India APAC Sealants & Adhesives Industry Revenue Share (%), by Adhesives Resin 2024 & 2032
- Figure 28: India APAC Sealants & Adhesives Industry Revenue (Million), by Adhesives Technology 2024 & 2032
- Figure 29: India APAC Sealants & Adhesives Industry Revenue Share (%), by Adhesives Technology 2024 & 2032
- Figure 30: India APAC Sealants & Adhesives Industry Revenue (Million), by Sealants Resin 2024 & 2032
- Figure 31: India APAC Sealants & Adhesives Industry Revenue Share (%), by Sealants Resin 2024 & 2032
- Figure 32: India APAC Sealants & Adhesives Industry Revenue (Million), by End-User Industry 2024 & 2032
- Figure 33: India APAC Sealants & Adhesives Industry Revenue Share (%), by End-User Industry 2024 & 2032
- Figure 34: India APAC Sealants & Adhesives Industry Revenue (Million), by Geography 2024 & 2032
- Figure 35: India APAC Sealants & Adhesives Industry Revenue Share (%), by Geography 2024 & 2032
- Figure 36: India APAC Sealants & Adhesives Industry Revenue (Million), by Country 2024 & 2032
- Figure 37: India APAC Sealants & Adhesives Industry Revenue Share (%), by Country 2024 & 2032
- Figure 38: Japan APAC Sealants & Adhesives Industry Revenue (Million), by Adhesives Resin 2024 & 2032
- Figure 39: Japan APAC Sealants & Adhesives Industry Revenue Share (%), by Adhesives Resin 2024 & 2032
- Figure 40: Japan APAC Sealants & Adhesives Industry Revenue (Million), by Adhesives Technology 2024 & 2032
- Figure 41: Japan APAC Sealants & Adhesives Industry Revenue Share (%), by Adhesives Technology 2024 & 2032
- Figure 42: Japan APAC Sealants & Adhesives Industry Revenue (Million), by Sealants Resin 2024 & 2032
- Figure 43: Japan APAC Sealants & Adhesives Industry Revenue Share (%), by Sealants Resin 2024 & 2032
- Figure 44: Japan APAC Sealants & Adhesives Industry Revenue (Million), by End-User Industry 2024 & 2032
- Figure 45: Japan APAC Sealants & Adhesives Industry Revenue Share (%), by End-User Industry 2024 & 2032
- Figure 46: Japan APAC Sealants & Adhesives Industry Revenue (Million), by Geography 2024 & 2032
- Figure 47: Japan APAC Sealants & Adhesives Industry Revenue Share (%), by Geography 2024 & 2032
- Figure 48: Japan APAC Sealants & Adhesives Industry Revenue (Million), by Country 2024 & 2032
- Figure 49: Japan APAC Sealants & Adhesives Industry Revenue Share (%), by Country 2024 & 2032
- Figure 50: South Korea APAC Sealants & Adhesives Industry Revenue (Million), by Adhesives Resin 2024 & 2032
- Figure 51: South Korea APAC Sealants & Adhesives Industry Revenue Share (%), by Adhesives Resin 2024 & 2032
- Figure 52: South Korea APAC Sealants & Adhesives Industry Revenue (Million), by Adhesives Technology 2024 & 2032
- Figure 53: South Korea APAC Sealants & Adhesives Industry Revenue Share (%), by Adhesives Technology 2024 & 2032
- Figure 54: South Korea APAC Sealants & Adhesives Industry Revenue (Million), by Sealants Resin 2024 & 2032
- Figure 55: South Korea APAC Sealants & Adhesives Industry Revenue Share (%), by Sealants Resin 2024 & 2032
- Figure 56: South Korea APAC Sealants & Adhesives Industry Revenue (Million), by End-User Industry 2024 & 2032
- Figure 57: South Korea APAC Sealants & Adhesives Industry Revenue Share (%), by End-User Industry 2024 & 2032
- Figure 58: South Korea APAC Sealants & Adhesives Industry Revenue (Million), by Geography 2024 & 2032
- Figure 59: South Korea APAC Sealants & Adhesives Industry Revenue Share (%), by Geography 2024 & 2032
- Figure 60: South Korea APAC Sealants & Adhesives Industry Revenue (Million), by Country 2024 & 2032
- Figure 61: South Korea APAC Sealants & Adhesives Industry Revenue Share (%), by Country 2024 & 2032
- Figure 62: Indonesia APAC Sealants & Adhesives Industry Revenue (Million), by Adhesives Resin 2024 & 2032
- Figure 63: Indonesia APAC Sealants & Adhesives Industry Revenue Share (%), by Adhesives Resin 2024 & 2032
- Figure 64: Indonesia APAC Sealants & Adhesives Industry Revenue (Million), by Adhesives Technology 2024 & 2032
- Figure 65: Indonesia APAC Sealants & Adhesives Industry Revenue Share (%), by Adhesives Technology 2024 & 2032
- Figure 66: Indonesia APAC Sealants & Adhesives Industry Revenue (Million), by Sealants Resin 2024 & 2032
- Figure 67: Indonesia APAC Sealants & Adhesives Industry Revenue Share (%), by Sealants Resin 2024 & 2032
- Figure 68: Indonesia APAC Sealants & Adhesives Industry Revenue (Million), by End-User Industry 2024 & 2032
- Figure 69: Indonesia APAC Sealants & Adhesives Industry Revenue Share (%), by End-User Industry 2024 & 2032
- Figure 70: Indonesia APAC Sealants & Adhesives Industry Revenue (Million), by Geography 2024 & 2032
- Figure 71: Indonesia APAC Sealants & Adhesives Industry Revenue Share (%), by Geography 2024 & 2032
- Figure 72: Indonesia APAC Sealants & Adhesives Industry Revenue (Million), by Country 2024 & 2032
- Figure 73: Indonesia APAC Sealants & Adhesives Industry Revenue Share (%), by Country 2024 & 2032
- Figure 74: Malaysia APAC Sealants & Adhesives Industry Revenue (Million), by Adhesives Resin 2024 & 2032
- Figure 75: Malaysia APAC Sealants & Adhesives Industry Revenue Share (%), by Adhesives Resin 2024 & 2032
- Figure 76: Malaysia APAC Sealants & Adhesives Industry Revenue (Million), by Adhesives Technology 2024 & 2032
- Figure 77: Malaysia APAC Sealants & Adhesives Industry Revenue Share (%), by Adhesives Technology 2024 & 2032
- Figure 78: Malaysia APAC Sealants & Adhesives Industry Revenue (Million), by Sealants Resin 2024 & 2032
- Figure 79: Malaysia APAC Sealants & Adhesives Industry Revenue Share (%), by Sealants Resin 2024 & 2032
- Figure 80: Malaysia APAC Sealants & Adhesives Industry Revenue (Million), by End-User Industry 2024 & 2032
- Figure 81: Malaysia APAC Sealants & Adhesives Industry Revenue Share (%), by End-User Industry 2024 & 2032
- Figure 82: Malaysia APAC Sealants & Adhesives Industry Revenue (Million), by Geography 2024 & 2032
- Figure 83: Malaysia APAC Sealants & Adhesives Industry Revenue Share (%), by Geography 2024 & 2032
- Figure 84: Malaysia APAC Sealants & Adhesives Industry Revenue (Million), by Country 2024 & 2032
- Figure 85: Malaysia APAC Sealants & Adhesives Industry Revenue Share (%), by Country 2024 & 2032
- Figure 86: Thailand APAC Sealants & Adhesives Industry Revenue (Million), by Adhesives Resin 2024 & 2032
- Figure 87: Thailand APAC Sealants & Adhesives Industry Revenue Share (%), by Adhesives Resin 2024 & 2032
- Figure 88: Thailand APAC Sealants & Adhesives Industry Revenue (Million), by Adhesives Technology 2024 & 2032
- Figure 89: Thailand APAC Sealants & Adhesives Industry Revenue Share (%), by Adhesives Technology 2024 & 2032
- Figure 90: Thailand APAC Sealants & Adhesives Industry Revenue (Million), by Sealants Resin 2024 & 2032
- Figure 91: Thailand APAC Sealants & Adhesives Industry Revenue Share (%), by Sealants Resin 2024 & 2032
- Figure 92: Thailand APAC Sealants & Adhesives Industry Revenue (Million), by End-User Industry 2024 & 2032
- Figure 93: Thailand APAC Sealants & Adhesives Industry Revenue Share (%), by End-User Industry 2024 & 2032
- Figure 94: Thailand APAC Sealants & Adhesives Industry Revenue (Million), by Geography 2024 & 2032
- Figure 95: Thailand APAC Sealants & Adhesives Industry Revenue Share (%), by Geography 2024 & 2032
- Figure 96: Thailand APAC Sealants & Adhesives Industry Revenue (Million), by Country 2024 & 2032
- Figure 97: Thailand APAC Sealants & Adhesives Industry Revenue Share (%), by Country 2024 & 2032
- Figure 98: Vietnam APAC Sealants & Adhesives Industry Revenue (Million), by Adhesives Resin 2024 & 2032
- Figure 99: Vietnam APAC Sealants & Adhesives Industry Revenue Share (%), by Adhesives Resin 2024 & 2032
- Figure 100: Vietnam APAC Sealants & Adhesives Industry Revenue (Million), by Adhesives Technology 2024 & 2032
- Figure 101: Vietnam APAC Sealants & Adhesives Industry Revenue Share (%), by Adhesives Technology 2024 & 2032
- Figure 102: Vietnam APAC Sealants & Adhesives Industry Revenue (Million), by Sealants Resin 2024 & 2032
- Figure 103: Vietnam APAC Sealants & Adhesives Industry Revenue Share (%), by Sealants Resin 2024 & 2032
- Figure 104: Vietnam APAC Sealants & Adhesives Industry Revenue (Million), by End-User Industry 2024 & 2032
- Figure 105: Vietnam APAC Sealants & Adhesives Industry Revenue Share (%), by End-User Industry 2024 & 2032
- Figure 106: Vietnam APAC Sealants & Adhesives Industry Revenue (Million), by Geography 2024 & 2032
- Figure 107: Vietnam APAC Sealants & Adhesives Industry Revenue Share (%), by Geography 2024 & 2032
- Figure 108: Vietnam APAC Sealants & Adhesives Industry Revenue (Million), by Country 2024 & 2032
- Figure 109: Vietnam APAC Sealants & Adhesives Industry Revenue Share (%), by Country 2024 & 2032
- Figure 110: Rest of Asia Pacific APAC Sealants & Adhesives Industry Revenue (Million), by Adhesives Resin 2024 & 2032
- Figure 111: Rest of Asia Pacific APAC Sealants & Adhesives Industry Revenue Share (%), by Adhesives Resin 2024 & 2032
- Figure 112: Rest of Asia Pacific APAC Sealants & Adhesives Industry Revenue (Million), by Adhesives Technology 2024 & 2032
- Figure 113: Rest of Asia Pacific APAC Sealants & Adhesives Industry Revenue Share (%), by Adhesives Technology 2024 & 2032
- Figure 114: Rest of Asia Pacific APAC Sealants & Adhesives Industry Revenue (Million), by Sealants Resin 2024 & 2032
- Figure 115: Rest of Asia Pacific APAC Sealants & Adhesives Industry Revenue Share (%), by Sealants Resin 2024 & 2032
- Figure 116: Rest of Asia Pacific APAC Sealants & Adhesives Industry Revenue (Million), by End-User Industry 2024 & 2032
- Figure 117: Rest of Asia Pacific APAC Sealants & Adhesives Industry Revenue Share (%), by End-User Industry 2024 & 2032
- Figure 118: Rest of Asia Pacific APAC Sealants & Adhesives Industry Revenue (Million), by Geography 2024 & 2032
- Figure 119: Rest of Asia Pacific APAC Sealants & Adhesives Industry Revenue Share (%), by Geography 2024 & 2032
- Figure 120: Rest of Asia Pacific APAC Sealants & Adhesives Industry Revenue (Million), by Country 2024 & 2032
- Figure 121: Rest of Asia Pacific APAC Sealants & Adhesives Industry Revenue Share (%), by Country 2024 & 2032
List of Tables
- Table 1: Global APAC Sealants & Adhesives Industry Revenue Million Forecast, by Region 2019 & 2032
- Table 2: Global APAC Sealants & Adhesives Industry Revenue Million Forecast, by Adhesives Resin 2019 & 2032
- Table 3: Global APAC Sealants & Adhesives Industry Revenue Million Forecast, by Adhesives Technology 2019 & 2032
- Table 4: Global APAC Sealants & Adhesives Industry Revenue Million Forecast, by Sealants Resin 2019 & 2032
- Table 5: Global APAC Sealants & Adhesives Industry Revenue Million Forecast, by End-User Industry 2019 & 2032
- Table 6: Global APAC Sealants & Adhesives Industry Revenue Million Forecast, by Geography 2019 & 2032
- Table 7: Global APAC Sealants & Adhesives Industry Revenue Million Forecast, by Region 2019 & 2032
- Table 8: Global APAC Sealants & Adhesives Industry Revenue Million Forecast, by Country 2019 & 2032
- Table 9: United States APAC Sealants & Adhesives Industry Revenue (Million) Forecast, by Application 2019 & 2032
- Table 10: Canada APAC Sealants & Adhesives Industry Revenue (Million) Forecast, by Application 2019 & 2032
- Table 11: Mexico APAC Sealants & Adhesives Industry Revenue (Million) Forecast, by Application 2019 & 2032
- Table 12: Global APAC Sealants & Adhesives Industry Revenue Million Forecast, by Country 2019 & 2032
- Table 13: Germany APAC Sealants & Adhesives Industry Revenue (Million) Forecast, by Application 2019 & 2032
- Table 14: United Kingdom APAC Sealants & Adhesives Industry Revenue (Million) Forecast, by Application 2019 & 2032
- Table 15: France APAC Sealants & Adhesives Industry Revenue (Million) Forecast, by Application 2019 & 2032
- Table 16: Spain APAC Sealants & Adhesives Industry Revenue (Million) Forecast, by Application 2019 & 2032
- Table 17: Italy APAC Sealants & Adhesives Industry Revenue (Million) Forecast, by Application 2019 & 2032
- Table 18: Spain APAC Sealants & Adhesives Industry Revenue (Million) Forecast, by Application 2019 & 2032
- Table 19: Belgium APAC Sealants & Adhesives Industry Revenue (Million) Forecast, by Application 2019 & 2032
- Table 20: Netherland APAC Sealants & Adhesives Industry Revenue (Million) Forecast, by Application 2019 & 2032
- Table 21: Nordics APAC Sealants & Adhesives Industry Revenue (Million) Forecast, by Application 2019 & 2032
- Table 22: Rest of Europe APAC Sealants & Adhesives Industry Revenue (Million) Forecast, by Application 2019 & 2032
- Table 23: Global APAC Sealants & Adhesives Industry Revenue Million Forecast, by Country 2019 & 2032
- Table 24: China APAC Sealants & Adhesives Industry Revenue (Million) Forecast, by Application 2019 & 2032
- Table 25: Japan APAC Sealants & Adhesives Industry Revenue (Million) Forecast, by Application 2019 & 2032
- Table 26: India APAC Sealants & Adhesives Industry Revenue (Million) Forecast, by Application 2019 & 2032
- Table 27: South Korea APAC Sealants & Adhesives Industry Revenue (Million) Forecast, by Application 2019 & 2032
- Table 28: Southeast Asia APAC Sealants & Adhesives Industry Revenue (Million) Forecast, by Application 2019 & 2032
- Table 29: Australia APAC Sealants & Adhesives Industry Revenue (Million) Forecast, by Application 2019 & 2032
- Table 30: Indonesia APAC Sealants & Adhesives Industry Revenue (Million) Forecast, by Application 2019 & 2032
- Table 31: Phillipes APAC Sealants & Adhesives Industry Revenue (Million) Forecast, by Application 2019 & 2032
- Table 32: Singapore APAC Sealants & Adhesives Industry Revenue (Million) Forecast, by Application 2019 & 2032
- Table 33: Thailandc APAC Sealants & Adhesives Industry Revenue (Million) Forecast, by Application 2019 & 2032
- Table 34: Rest of Asia Pacific APAC Sealants & Adhesives Industry Revenue (Million) Forecast, by Application 2019 & 2032
- Table 35: Global APAC Sealants & Adhesives Industry Revenue Million Forecast, by Country 2019 & 2032
- Table 36: Brazil APAC Sealants & Adhesives Industry Revenue (Million) Forecast, by Application 2019 & 2032
- Table 37: Argentina APAC Sealants & Adhesives Industry Revenue (Million) Forecast, by Application 2019 & 2032
- Table 38: Peru APAC Sealants & Adhesives Industry Revenue (Million) Forecast, by Application 2019 & 2032
- Table 39: Chile APAC Sealants & Adhesives Industry Revenue (Million) Forecast, by Application 2019 & 2032
- Table 40: Colombia APAC Sealants & Adhesives Industry Revenue (Million) Forecast, by Application 2019 & 2032
- Table 41: Ecuador APAC Sealants & Adhesives Industry Revenue (Million) Forecast, by Application 2019 & 2032
- Table 42: Venezuela APAC Sealants & Adhesives Industry Revenue (Million) Forecast, by Application 2019 & 2032
- Table 43: Rest of South America APAC Sealants & Adhesives Industry Revenue (Million) Forecast, by Application 2019 & 2032
- Table 44: Global APAC Sealants & Adhesives Industry Revenue Million Forecast, by Country 2019 & 2032
- Table 45: United States APAC Sealants & Adhesives Industry Revenue (Million) Forecast, by Application 2019 & 2032
- Table 46: Canada APAC Sealants & Adhesives Industry Revenue (Million) Forecast, by Application 2019 & 2032
- Table 47: Mexico APAC Sealants & Adhesives Industry Revenue (Million) Forecast, by Application 2019 & 2032
- Table 48: Global APAC Sealants & Adhesives Industry Revenue Million Forecast, by Country 2019 & 2032
- Table 49: United Arab Emirates APAC Sealants & Adhesives Industry Revenue (Million) Forecast, by Application 2019 & 2032
- Table 50: Saudi Arabia APAC Sealants & Adhesives Industry Revenue (Million) Forecast, by Application 2019 & 2032
- Table 51: South Africa APAC Sealants & Adhesives Industry Revenue (Million) Forecast, by Application 2019 & 2032
- Table 52: Rest of Middle East and Africa APAC Sealants & Adhesives Industry Revenue (Million) Forecast, by Application 2019 & 2032
- Table 53: Global APAC Sealants & Adhesives Industry Revenue Million Forecast, by Adhesives Resin 2019 & 2032
- Table 54: Global APAC Sealants & Adhesives Industry Revenue Million Forecast, by Adhesives Technology 2019 & 2032
- Table 55: Global APAC Sealants & Adhesives Industry Revenue Million Forecast, by Sealants Resin 2019 & 2032
- Table 56: Global APAC Sealants & Adhesives Industry Revenue Million Forecast, by End-User Industry 2019 & 2032
- Table 57: Global APAC Sealants & Adhesives Industry Revenue Million Forecast, by Geography 2019 & 2032
- Table 58: Global APAC Sealants & Adhesives Industry Revenue Million Forecast, by Country 2019 & 2032
- Table 59: Global APAC Sealants & Adhesives Industry Revenue Million Forecast, by Adhesives Resin 2019 & 2032
- Table 60: Global APAC Sealants & Adhesives Industry Revenue Million Forecast, by Adhesives Technology 2019 & 2032
- Table 61: Global APAC Sealants & Adhesives Industry Revenue Million Forecast, by Sealants Resin 2019 & 2032
- Table 62: Global APAC Sealants & Adhesives Industry Revenue Million Forecast, by End-User Industry 2019 & 2032
- Table 63: Global APAC Sealants & Adhesives Industry Revenue Million Forecast, by Geography 2019 & 2032
- Table 64: Global APAC Sealants & Adhesives Industry Revenue Million Forecast, by Country 2019 & 2032
- Table 65: Global APAC Sealants & Adhesives Industry Revenue Million Forecast, by Adhesives Resin 2019 & 2032
- Table 66: Global APAC Sealants & Adhesives Industry Revenue Million Forecast, by Adhesives Technology 2019 & 2032
- Table 67: Global APAC Sealants & Adhesives Industry Revenue Million Forecast, by Sealants Resin 2019 & 2032
- Table 68: Global APAC Sealants & Adhesives Industry Revenue Million Forecast, by End-User Industry 2019 & 2032
- Table 69: Global APAC Sealants & Adhesives Industry Revenue Million Forecast, by Geography 2019 & 2032
- Table 70: Global APAC Sealants & Adhesives Industry Revenue Million Forecast, by Country 2019 & 2032
- Table 71: Global APAC Sealants & Adhesives Industry Revenue Million Forecast, by Adhesives Resin 2019 & 2032
- Table 72: Global APAC Sealants & Adhesives Industry Revenue Million Forecast, by Adhesives Technology 2019 & 2032
- Table 73: Global APAC Sealants & Adhesives Industry Revenue Million Forecast, by Sealants Resin 2019 & 2032
- Table 74: Global APAC Sealants & Adhesives Industry Revenue Million Forecast, by End-User Industry 2019 & 2032
- Table 75: Global APAC Sealants & Adhesives Industry Revenue Million Forecast, by Geography 2019 & 2032
- Table 76: Global APAC Sealants & Adhesives Industry Revenue Million Forecast, by Country 2019 & 2032
- Table 77: Global APAC Sealants & Adhesives Industry Revenue Million Forecast, by Adhesives Resin 2019 & 2032
- Table 78: Global APAC Sealants & Adhesives Industry Revenue Million Forecast, by Adhesives Technology 2019 & 2032
- Table 79: Global APAC Sealants & Adhesives Industry Revenue Million Forecast, by Sealants Resin 2019 & 2032
- Table 80: Global APAC Sealants & Adhesives Industry Revenue Million Forecast, by End-User Industry 2019 & 2032
- Table 81: Global APAC Sealants & Adhesives Industry Revenue Million Forecast, by Geography 2019 & 2032
- Table 82: Global APAC Sealants & Adhesives Industry Revenue Million Forecast, by Country 2019 & 2032
- Table 83: Global APAC Sealants & Adhesives Industry Revenue Million Forecast, by Adhesives Resin 2019 & 2032
- Table 84: Global APAC Sealants & Adhesives Industry Revenue Million Forecast, by Adhesives Technology 2019 & 2032
- Table 85: Global APAC Sealants & Adhesives Industry Revenue Million Forecast, by Sealants Resin 2019 & 2032
- Table 86: Global APAC Sealants & Adhesives Industry Revenue Million Forecast, by End-User Industry 2019 & 2032
- Table 87: Global APAC Sealants & Adhesives Industry Revenue Million Forecast, by Geography 2019 & 2032
- Table 88: Global APAC Sealants & Adhesives Industry Revenue Million Forecast, by Country 2019 & 2032
- Table 89: Global APAC Sealants & Adhesives Industry Revenue Million Forecast, by Adhesives Resin 2019 & 2032
- Table 90: Global APAC Sealants & Adhesives Industry Revenue Million Forecast, by Adhesives Technology 2019 & 2032
- Table 91: Global APAC Sealants & Adhesives Industry Revenue Million Forecast, by Sealants Resin 2019 & 2032
- Table 92: Global APAC Sealants & Adhesives Industry Revenue Million Forecast, by End-User Industry 2019 & 2032
- Table 93: Global APAC Sealants & Adhesives Industry Revenue Million Forecast, by Geography 2019 & 2032
- Table 94: Global APAC Sealants & Adhesives Industry Revenue Million Forecast, by Country 2019 & 2032
- Table 95: Global APAC Sealants & Adhesives Industry Revenue Million Forecast, by Adhesives Resin 2019 & 2032
- Table 96: Global APAC Sealants & Adhesives Industry Revenue Million Forecast, by Adhesives Technology 2019 & 2032
- Table 97: Global APAC Sealants & Adhesives Industry Revenue Million Forecast, by Sealants Resin 2019 & 2032
- Table 98: Global APAC Sealants & Adhesives Industry Revenue Million Forecast, by End-User Industry 2019 & 2032
- Table 99: Global APAC Sealants & Adhesives Industry Revenue Million Forecast, by Geography 2019 & 2032
- Table 100: Global APAC Sealants & Adhesives Industry Revenue Million Forecast, by Country 2019 & 2032
- Table 101: Global APAC Sealants & Adhesives Industry Revenue Million Forecast, by Adhesives Resin 2019 & 2032
- Table 102: Global APAC Sealants & Adhesives Industry Revenue Million Forecast, by Adhesives Technology 2019 & 2032
- Table 103: Global APAC Sealants & Adhesives Industry Revenue Million Forecast, by Sealants Resin 2019 & 2032
- Table 104: Global APAC Sealants & Adhesives Industry Revenue Million Forecast, by End-User Industry 2019 & 2032
- Table 105: Global APAC Sealants & Adhesives Industry Revenue Million Forecast, by Geography 2019 & 2032
- Table 106: Global APAC Sealants & Adhesives Industry Revenue Million Forecast, by Country 2019 & 2032
Frequently Asked Questions
1. What is the projected Compound Annual Growth Rate (CAGR) of the APAC Sealants & Adhesives Industry?
The projected CAGR is approximately > 6.00%.
2. Which companies are prominent players in the APAC Sealants & Adhesives Industry?
Key companies in the market include Sika AG, Huntsman International LLC, Tesa SE (A Beiersdorf Company), ITW Performance Polymers (Illinois Tool Works Inc ), Henkel AG & Co KGaA, Pidilite Industries Ltd, Beardow Adams, DuPont, Dow, Arkema, H B Fuller Company, 3M, Mapei Inc, Dymax Corporation, Avery Dennison Corporation, Wacker Chemie AG*List Not Exhaustive, Jowat AG, Ashland, Franklin International.
3. What are the main segments of the APAC Sealants & Adhesives Industry?
The market segments include Adhesives Resin, Adhesives Technology, Sealants Resin, End-User Industry, Geography.
4. Can you provide details about the market size?
The market size is estimated to be USD 30.26 Million as of 2022.
5. What are some drivers contributing to market growth?
Growing Packaging Industry in South-East Asia Countries; Growing Demand in Construction Sector; Other Drivers.
6. What are the notable trends driving market growth?
Packaging Segment to Dominate the Market.
7. Are there any restraints impacting market growth?
Stringent Environmental Regulations Regarding VOC Emissions; High Fluctuations in Raw Material Pricing.
8. Can you provide examples of recent developments in the market?
N/A
9. What pricing options are available for accessing the report?
Pricing options include single-user, multi-user, and enterprise licenses priced at USD 4750, USD 5250, and USD 8750 respectively.
10. Is the market size provided in terms of value or volume?
The market size is provided in terms of value, measured in Million.
11. Are there any specific market keywords associated with the report?
Yes, the market keyword associated with the report is "APAC Sealants & Adhesives Industry," which aids in identifying and referencing the specific market segment covered.
12. How do I determine which pricing option suits my needs best?
The pricing options vary based on user requirements and access needs. Individual users may opt for single-user licenses, while businesses requiring broader access may choose multi-user or enterprise licenses for cost-effective access to the report.
13. Are there any additional resources or data provided in the APAC Sealants & Adhesives Industry report?
While the report offers comprehensive insights, it's advisable to review the specific contents or supplementary materials provided to ascertain if additional resources or data are available.
14. How can I stay updated on further developments or reports in the APAC Sealants & Adhesives Industry?
To stay informed about further developments, trends, and reports in the APAC Sealants & Adhesives Industry, consider subscribing to industry newsletters, following relevant companies and organizations, or regularly checking reputable industry news sources and publications.
Methodology
Step 1 - Identification of Relevant Samples Size from Population Database


Step 2 - Approaches for Defining Global Market Size (Value, Volume* & Price*)

Note*: In applicable scenarios
Step 3 - Data Sources
Primary Research
- Web Analytics
- Survey Reports
- Research Institute
- Latest Research Reports
- Opinion Leaders
Secondary Research
- Annual Reports
- White Paper
- Latest Press Release
- Industry Association
- Paid Database
- Investor Presentations

Step 4 - Data Triangulation
Involves using different sources of information in order to increase the validity of a study
These sources are likely to be stakeholders in a program - participants, other researchers, program staff, other community members, and so on.
Then we put all data in single framework & apply various statistical tools to find out the dynamic on the market.
During the analysis stage, feedback from the stakeholder groups would be compared to determine areas of agreement as well as areas of divergence
