

Key Insights
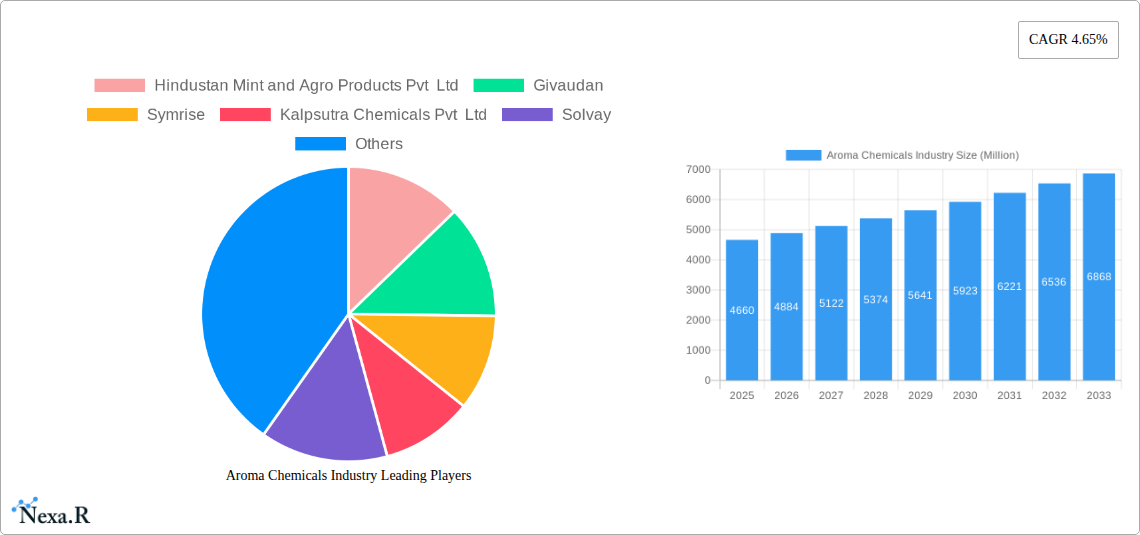
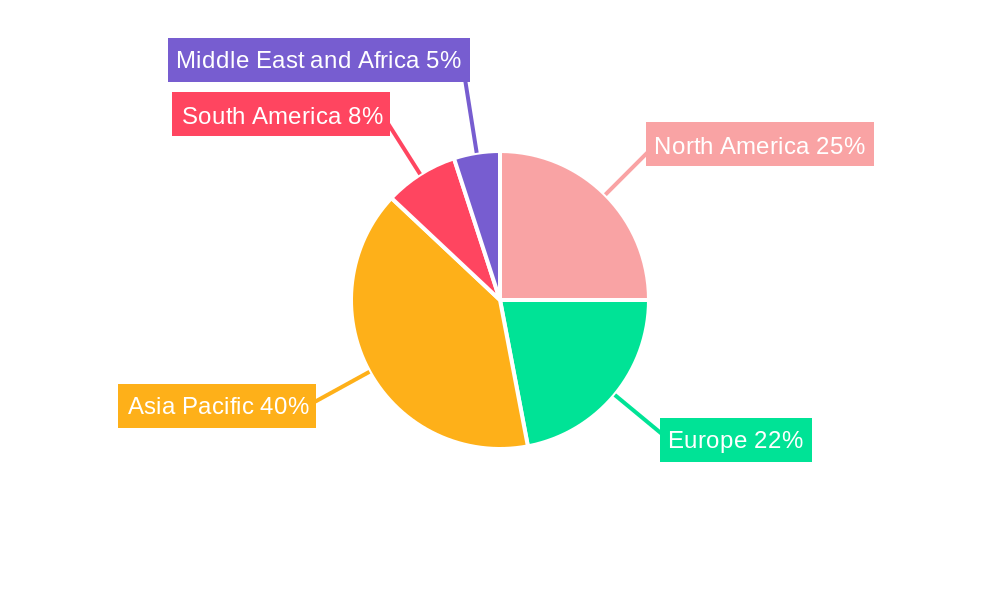
The aroma chemicals market, valued at $4.66 billion in 2025, is projected to experience robust growth, driven by increasing demand across diverse sectors. The Compound Annual Growth Rate (CAGR) of 4.65% from 2025 to 2033 indicates a significant expansion, fueled by several key factors. The burgeoning cosmetics and toiletries industry, coupled with the rising popularity of fine fragrances and the growing demand for flavor enhancements in food and beverages, are major contributors to this growth. Furthermore, advancements in synthetic fragrance technology, leading to more sustainable and cost-effective aroma chemical production, are also contributing factors. The market is segmented by type (terpenes, benzenoids, musk chemicals, and others) and application (soaps & detergents, cosmetics & toiletries, fine fragrances, household products, food & beverages, and others). The Asia-Pacific region, particularly China and India, is expected to witness the highest growth due to increasing disposable incomes and expanding consumer bases. However, fluctuating raw material prices and stringent regulatory frameworks regarding the use of certain chemicals pose potential challenges to market expansion. Leading players such as Givaudan, Symrise, and BASF are investing heavily in research and development to introduce innovative products and expand their market share, further shaping the industry's trajectory.
The competitive landscape is marked by a mix of multinational corporations and regional players. Established companies leverage their extensive distribution networks and strong brand reputations, while smaller players focus on niche applications and specialized product offerings. The market's future hinges on the balance between meeting the growing demand for diverse aroma chemicals and ensuring sustainability and regulatory compliance. Strategic partnerships, mergers, and acquisitions are likely to continue shaping the market structure, as companies seek to gain a competitive edge and capitalize on emerging opportunities in sustainable and natural aroma chemical production. The continuing demand for innovative and high-quality fragrance and flavor solutions will drive further investment and innovation in the years ahead, strengthening the market's overall growth prospects.
Aroma Chemicals Industry Market Report: 2019-2033
This comprehensive report provides a detailed analysis of the Aroma Chemicals industry, encompassing market dynamics, growth trends, regional insights, and key player strategies. The study period covers 2019-2033, with 2025 as the base and estimated year. This report is essential for industry professionals, investors, and strategists seeking to understand and capitalize on opportunities within this dynamic sector. The report analyzes parent markets (Fragrances & Flavors) and child markets (specific aroma chemical types and applications).
Aroma Chemicals Industry Market Dynamics & Structure
The aroma chemicals market is characterized by a moderately concentrated structure, with key players like Givaudan, Symrise, and BASF SE holding significant market share. Technological innovation, particularly in natural and sustainable aroma chemical production, is a major driver. Stringent regulatory frameworks concerning safety and sustainability impact product development and market access. The market witnesses continuous competition from synthetic substitutes and bio-based alternatives, influencing pricing and consumer preferences. M&A activity remains a key strategic element, with xx deals recorded between 2019 and 2024, primarily focused on expanding product portfolios and geographical reach. End-user demographics, particularly the rising demand for natural and sustainable products in cosmetics and food & beverage sectors, influence market growth.
- Market Concentration: Moderately concentrated, with top 5 players holding approximately xx% market share in 2024.
- Technological Innovation: Focus on natural, sustainable, and bio-based aroma chemicals.
- Regulatory Framework: Stringent regulations on safety and environmental impact.
- Competitive Substitutes: Synthetic and bio-based alternatives exert competitive pressure.
- M&A Activity: xx deals between 2019-2024, driving consolidation and expansion.
- End-User Demographics: Growing demand for natural and sustainable products in key application segments.
Aroma Chemicals Industry Growth Trends & Insights
The global aroma chemicals market experienced robust growth during the historical period (2019-2024), with a CAGR of xx%. This growth is projected to continue during the forecast period (2025-2033), driven by increasing demand from various application sectors, particularly cosmetics and toiletries, food and beverage, and fine fragrances. The market size is estimated at $xx million in 2025 and is expected to reach $xx million by 2033. This growth is fueled by evolving consumer preferences for natural and high-quality aroma products, supported by technological advancements in extraction and synthesis processes. Market penetration of natural aroma chemicals is also steadily increasing, reaching xx% in 2024 and projected to reach xx% by 2033. Technological disruptions, such as the development of bio-based alternatives and advanced extraction techniques, are further shaping market dynamics.
Dominant Regions, Countries, or Segments in Aroma Chemicals Industry
The Asia-Pacific region is currently the dominant market for aroma chemicals, owing to strong economic growth, expanding consumer base, and increasing demand from various industries. Within this region, China and India are key growth drivers. In terms of segments, the Cosmetics and Toiletries application sector currently holds the largest market share (xx% in 2024), followed by Food and Beverage (xx%) and Fine Fragrances (xx%). Among aroma chemical types, Terpenes currently dominate (xx% in 2024) due to their widespread applications and cost-effectiveness. However, the Musk Chemicals segment shows significant growth potential, driven by increasing demand for unique and sophisticated fragrances.
- Key Drivers (Asia-Pacific): Strong economic growth, rising disposable incomes, and expanding consumer base.
- Dominant Application: Cosmetics and Toiletries (xx% market share in 2024).
- Dominant Type: Terpenes (xx% market share in 2024).
- High Growth Potential: Musk Chemicals segment driven by demand for unique fragrances.
Aroma Chemicals Industry Product Landscape
The aroma chemicals market offers a diverse range of products, including terpenes, benzenoids, musk chemicals, and other types. Continuous innovation focuses on developing natural, sustainable, and high-performance products. Technological advancements encompass improved extraction methods for natural aroma chemicals and innovative synthesis techniques for synthetic counterparts. Unique selling propositions often center on superior aroma profiles, enhanced stability, and cost-effectiveness, catering to specific application requirements.
Key Drivers, Barriers & Challenges in Aroma Chemicals Industry
Key Drivers:
- Increasing consumer demand for natural and sustainable products.
- Growth of the cosmetics, food and beverage, and personal care industries.
- Technological advancements in aroma chemical synthesis and extraction.
Challenges & Restraints:
- Fluctuations in raw material prices.
- Stringent regulatory requirements for safety and environmental compliance.
- Intense competition from both established and emerging players.
- Supply chain disruptions impacting availability and cost. These disruptions caused a xx% increase in prices for certain aroma chemicals in 2022.
Emerging Opportunities in Aroma Chemicals Industry
Emerging opportunities lie in untapped markets, particularly in developing economies. The increasing demand for personalized fragrances and customized aroma solutions presents a significant growth avenue. Focus on innovative applications in niche sectors, such as aromatherapy and home fragrance, offers substantial potential. Evolving consumer preferences towards natural and sustainable products further fuel opportunities for bio-based and eco-friendly aroma chemicals.
Growth Accelerators in the Aroma Chemicals Industry
Technological breakthroughs in sustainable synthesis methods, precision fermentation technologies, and advanced extraction techniques are key growth catalysts. Strategic partnerships between aroma chemical producers and downstream industry players (e.g., cosmetic and food manufacturers) facilitate market expansion. Focus on expanding into new geographical markets, particularly developing economies, further accelerates industry growth.
Key Players Shaping the Aroma Chemicals Industry Market
- Hindustan Mint and Agro Products Pvt Ltd
- Givaudan
- Symrise
- Kalpsutra Chemicals Pvt Ltd
- Solvay
- Takasago International Corporation
- BASF SE
- S H Kelkar And Company Limited
- Robertet Group
- DSM
- Bell Flavors & Fragrances
- Treatt Plc
- Kao Corporation
- Silverline Chemicals
Notable Milestones in Aroma Chemicals Industry Sector
- Sept 2022: Solvay launched three new natural flavors (Rhovanil Natural Delica, Alta, and Sublima) expanding its Rhovanil Natural CW product line, catering to the growing demand for natural ingredients in the F&B sector.
- Aug 2022: Kao Corporation announced plans to maintain and expand its European market share for methyl dihydro jasmonate (MDJ), a synthetic fragrance used in various consumer products.
In-Depth Aroma Chemicals Industry Market Outlook
The aroma chemicals market is poised for significant growth, driven by continuous innovation in product development, expanding applications, and increasing consumer preference for natural and sustainable products. Strategic partnerships, expansion into emerging markets, and technological advancements will shape future market dynamics. Opportunities for sustainable and cost-effective solutions will be key factors determining long-term growth and success within this competitive landscape.
Aroma Chemicals Industry Segmentation
-
1. Type
- 1.1. Terpenes
- 1.2. Benzenoids
- 1.3. Musk Chemicals
- 1.4. Other Types
-
2. Application
- 2.1. Soap and Detergents
- 2.2. Cosmetics and Toiletries
- 2.3. Fine Fragrances
- 2.4. Household Products
- 2.5. Food and Beverage
- 2.6. Other Applications
Aroma Chemicals Industry Segmentation By Geography
-
1. Asia Pacific
- 1.1. China
- 1.2. India
- 1.3. Japan
- 1.4. South Korea
- 1.5. Rest of Asia Pacific
-
2. North America
- 2.1. United States
- 2.2. Canada
- 2.3. Mexico
-
3. Europe
- 3.1. Germany
- 3.2. United Kingdom
- 3.3. Italy
- 3.4. France
- 3.5. Rest of Europe
-
4. South America
- 4.1. Brazil
- 4.2. Argentina
- 4.3. Rest of South America
-
5. Middle East and Africa
- 5.1. Saudi Arabia
- 5.2. South Africa
- 5.3. Rest of Middle East and Africa
Aroma Chemicals Industry REPORT HIGHLIGHTS
| Aspects | Details |
|---|---|
| Study Period | 2019-2033 |
| Base Year | 2024 |
| Estimated Year | 2025 |
| Forecast Period | 2025-2033 |
| Historical Period | 2019-2024 |
| Growth Rate | CAGR of 4.65% from 2019-2033 |
| Segmentation |
|
Table of Contents
- 1. Introduction
- 1.1. Research Scope
- 1.2. Market Segmentation
- 1.3. Research Methodology
- 1.4. Definitions and Assumptions
- 2. Executive Summary
- 2.1. Introduction
- 3. Market Dynamics
- 3.1. Introduction
- 3.2. Market Drivers
- 3.2.1. Blooming Use in Fragrance Industry; Increasing advancements in the personal care products industries; Other Drivers
- 3.3. Market Restrains
- 3.3.1. High R&D Cost Coupled with Stringent Government Regulation; Other Restraints
- 3.4. Market Trends
- 3.4.1. Growing Demand from Fine Fragrances Application
- 4. Market Factor Analysis
- 4.1. Porters Five Forces
- 4.2. Supply/Value Chain
- 4.3. PESTEL analysis
- 4.4. Market Entropy
- 4.5. Patent/Trademark Analysis
- 5. Global Aroma Chemicals Industry Analysis, Insights and Forecast, 2019-2031
- 5.1. Market Analysis, Insights and Forecast - by Type
- 5.1.1. Terpenes
- 5.1.2. Benzenoids
- 5.1.3. Musk Chemicals
- 5.1.4. Other Types
- 5.2. Market Analysis, Insights and Forecast - by Application
- 5.2.1. Soap and Detergents
- 5.2.2. Cosmetics and Toiletries
- 5.2.3. Fine Fragrances
- 5.2.4. Household Products
- 5.2.5. Food and Beverage
- 5.2.6. Other Applications
- 5.3. Market Analysis, Insights and Forecast - by Region
- 5.3.1. Asia Pacific
- 5.3.2. North America
- 5.3.3. Europe
- 5.3.4. South America
- 5.3.5. Middle East and Africa
- 5.1. Market Analysis, Insights and Forecast - by Type
- 6. Asia Pacific Aroma Chemicals Industry Analysis, Insights and Forecast, 2019-2031
- 6.1. Market Analysis, Insights and Forecast - by Type
- 6.1.1. Terpenes
- 6.1.2. Benzenoids
- 6.1.3. Musk Chemicals
- 6.1.4. Other Types
- 6.2. Market Analysis, Insights and Forecast - by Application
- 6.2.1. Soap and Detergents
- 6.2.2. Cosmetics and Toiletries
- 6.2.3. Fine Fragrances
- 6.2.4. Household Products
- 6.2.5. Food and Beverage
- 6.2.6. Other Applications
- 6.1. Market Analysis, Insights and Forecast - by Type
- 7. North America Aroma Chemicals Industry Analysis, Insights and Forecast, 2019-2031
- 7.1. Market Analysis, Insights and Forecast - by Type
- 7.1.1. Terpenes
- 7.1.2. Benzenoids
- 7.1.3. Musk Chemicals
- 7.1.4. Other Types
- 7.2. Market Analysis, Insights and Forecast - by Application
- 7.2.1. Soap and Detergents
- 7.2.2. Cosmetics and Toiletries
- 7.2.3. Fine Fragrances
- 7.2.4. Household Products
- 7.2.5. Food and Beverage
- 7.2.6. Other Applications
- 7.1. Market Analysis, Insights and Forecast - by Type
- 8. Europe Aroma Chemicals Industry Analysis, Insights and Forecast, 2019-2031
- 8.1. Market Analysis, Insights and Forecast - by Type
- 8.1.1. Terpenes
- 8.1.2. Benzenoids
- 8.1.3. Musk Chemicals
- 8.1.4. Other Types
- 8.2. Market Analysis, Insights and Forecast - by Application
- 8.2.1. Soap and Detergents
- 8.2.2. Cosmetics and Toiletries
- 8.2.3. Fine Fragrances
- 8.2.4. Household Products
- 8.2.5. Food and Beverage
- 8.2.6. Other Applications
- 8.1. Market Analysis, Insights and Forecast - by Type
- 9. South America Aroma Chemicals Industry Analysis, Insights and Forecast, 2019-2031
- 9.1. Market Analysis, Insights and Forecast - by Type
- 9.1.1. Terpenes
- 9.1.2. Benzenoids
- 9.1.3. Musk Chemicals
- 9.1.4. Other Types
- 9.2. Market Analysis, Insights and Forecast - by Application
- 9.2.1. Soap and Detergents
- 9.2.2. Cosmetics and Toiletries
- 9.2.3. Fine Fragrances
- 9.2.4. Household Products
- 9.2.5. Food and Beverage
- 9.2.6. Other Applications
- 9.1. Market Analysis, Insights and Forecast - by Type
- 10. Middle East and Africa Aroma Chemicals Industry Analysis, Insights and Forecast, 2019-2031
- 10.1. Market Analysis, Insights and Forecast - by Type
- 10.1.1. Terpenes
- 10.1.2. Benzenoids
- 10.1.3. Musk Chemicals
- 10.1.4. Other Types
- 10.2. Market Analysis, Insights and Forecast - by Application
- 10.2.1. Soap and Detergents
- 10.2.2. Cosmetics and Toiletries
- 10.2.3. Fine Fragrances
- 10.2.4. Household Products
- 10.2.5. Food and Beverage
- 10.2.6. Other Applications
- 10.1. Market Analysis, Insights and Forecast - by Type
- 11. Asia Pacific Aroma Chemicals Industry Analysis, Insights and Forecast, 2019-2031
- 11.1. Market Analysis, Insights and Forecast - By Country/Sub-region
- 11.1.1 China
- 11.1.2 India
- 11.1.3 Japan
- 11.1.4 South Korea
- 11.1.5 Rest of Asia Pacific
- 12. North America Aroma Chemicals Industry Analysis, Insights and Forecast, 2019-2031
- 12.1. Market Analysis, Insights and Forecast - By Country/Sub-region
- 12.1.1 United States
- 12.1.2 Canada
- 12.1.3 Mexico
- 13. Europe Aroma Chemicals Industry Analysis, Insights and Forecast, 2019-2031
- 13.1. Market Analysis, Insights and Forecast - By Country/Sub-region
- 13.1.1 Germany
- 13.1.2 United Kingdom
- 13.1.3 Italy
- 13.1.4 France
- 13.1.5 Rest of Europe
- 14. South America Aroma Chemicals Industry Analysis, Insights and Forecast, 2019-2031
- 14.1. Market Analysis, Insights and Forecast - By Country/Sub-region
- 14.1.1 Brazil
- 14.1.2 Argentina
- 14.1.3 Rest of South America
- 15. Middle East and Africa Aroma Chemicals Industry Analysis, Insights and Forecast, 2019-2031
- 15.1. Market Analysis, Insights and Forecast - By Country/Sub-region
- 15.1.1 Saudi Arabia
- 15.1.2 South Africa
- 15.1.3 Rest of Middle East and Africa
- 16. Competitive Analysis
- 16.1. Global Market Share Analysis 2024
- 16.2. Company Profiles
- 16.2.1 Hindustan Mint and Agro Products Pvt Ltd
- 16.2.1.1. Overview
- 16.2.1.2. Products
- 16.2.1.3. SWOT Analysis
- 16.2.1.4. Recent Developments
- 16.2.1.5. Financials (Based on Availability)
- 16.2.2 Givaudan
- 16.2.2.1. Overview
- 16.2.2.2. Products
- 16.2.2.3. SWOT Analysis
- 16.2.2.4. Recent Developments
- 16.2.2.5. Financials (Based on Availability)
- 16.2.3 Symrise
- 16.2.3.1. Overview
- 16.2.3.2. Products
- 16.2.3.3. SWOT Analysis
- 16.2.3.4. Recent Developments
- 16.2.3.5. Financials (Based on Availability)
- 16.2.4 Kalpsutra Chemicals Pvt Ltd
- 16.2.4.1. Overview
- 16.2.4.2. Products
- 16.2.4.3. SWOT Analysis
- 16.2.4.4. Recent Developments
- 16.2.4.5. Financials (Based on Availability)
- 16.2.5 Solvay
- 16.2.5.1. Overview
- 16.2.5.2. Products
- 16.2.5.3. SWOT Analysis
- 16.2.5.4. Recent Developments
- 16.2.5.5. Financials (Based on Availability)
- 16.2.6 Takasago International Corporation
- 16.2.6.1. Overview
- 16.2.6.2. Products
- 16.2.6.3. SWOT Analysis
- 16.2.6.4. Recent Developments
- 16.2.6.5. Financials (Based on Availability)
- 16.2.7 BASF SE
- 16.2.7.1. Overview
- 16.2.7.2. Products
- 16.2.7.3. SWOT Analysis
- 16.2.7.4. Recent Developments
- 16.2.7.5. Financials (Based on Availability)
- 16.2.8 S H Kelkar And Company Limited
- 16.2.8.1. Overview
- 16.2.8.2. Products
- 16.2.8.3. SWOT Analysis
- 16.2.8.4. Recent Developments
- 16.2.8.5. Financials (Based on Availability)
- 16.2.9 Robertet Group
- 16.2.9.1. Overview
- 16.2.9.2. Products
- 16.2.9.3. SWOT Analysis
- 16.2.9.4. Recent Developments
- 16.2.9.5. Financials (Based on Availability)
- 16.2.10 DSM
- 16.2.10.1. Overview
- 16.2.10.2. Products
- 16.2.10.3. SWOT Analysis
- 16.2.10.4. Recent Developments
- 16.2.10.5. Financials (Based on Availability)
- 16.2.11 Bell Flavors & Fragrances
- 16.2.11.1. Overview
- 16.2.11.2. Products
- 16.2.11.3. SWOT Analysis
- 16.2.11.4. Recent Developments
- 16.2.11.5. Financials (Based on Availability)
- 16.2.12 Treatt Plc*List Not Exhaustive
- 16.2.12.1. Overview
- 16.2.12.2. Products
- 16.2.12.3. SWOT Analysis
- 16.2.12.4. Recent Developments
- 16.2.12.5. Financials (Based on Availability)
- 16.2.13 Kao Corporation
- 16.2.13.1. Overview
- 16.2.13.2. Products
- 16.2.13.3. SWOT Analysis
- 16.2.13.4. Recent Developments
- 16.2.13.5. Financials (Based on Availability)
- 16.2.14 Silverline Chemicals
- 16.2.14.1. Overview
- 16.2.14.2. Products
- 16.2.14.3. SWOT Analysis
- 16.2.14.4. Recent Developments
- 16.2.14.5. Financials (Based on Availability)
- 16.2.1 Hindustan Mint and Agro Products Pvt Ltd
List of Figures
- Figure 1: Global Aroma Chemicals Industry Revenue Breakdown (Million, %) by Region 2024 & 2032
- Figure 2: Asia Pacific Aroma Chemicals Industry Revenue (Million), by Country 2024 & 2032
- Figure 3: Asia Pacific Aroma Chemicals Industry Revenue Share (%), by Country 2024 & 2032
- Figure 4: North America Aroma Chemicals Industry Revenue (Million), by Country 2024 & 2032
- Figure 5: North America Aroma Chemicals Industry Revenue Share (%), by Country 2024 & 2032
- Figure 6: Europe Aroma Chemicals Industry Revenue (Million), by Country 2024 & 2032
- Figure 7: Europe Aroma Chemicals Industry Revenue Share (%), by Country 2024 & 2032
- Figure 8: South America Aroma Chemicals Industry Revenue (Million), by Country 2024 & 2032
- Figure 9: South America Aroma Chemicals Industry Revenue Share (%), by Country 2024 & 2032
- Figure 10: Middle East and Africa Aroma Chemicals Industry Revenue (Million), by Country 2024 & 2032
- Figure 11: Middle East and Africa Aroma Chemicals Industry Revenue Share (%), by Country 2024 & 2032
- Figure 12: Asia Pacific Aroma Chemicals Industry Revenue (Million), by Type 2024 & 2032
- Figure 13: Asia Pacific Aroma Chemicals Industry Revenue Share (%), by Type 2024 & 2032
- Figure 14: Asia Pacific Aroma Chemicals Industry Revenue (Million), by Application 2024 & 2032
- Figure 15: Asia Pacific Aroma Chemicals Industry Revenue Share (%), by Application 2024 & 2032
- Figure 16: Asia Pacific Aroma Chemicals Industry Revenue (Million), by Country 2024 & 2032
- Figure 17: Asia Pacific Aroma Chemicals Industry Revenue Share (%), by Country 2024 & 2032
- Figure 18: North America Aroma Chemicals Industry Revenue (Million), by Type 2024 & 2032
- Figure 19: North America Aroma Chemicals Industry Revenue Share (%), by Type 2024 & 2032
- Figure 20: North America Aroma Chemicals Industry Revenue (Million), by Application 2024 & 2032
- Figure 21: North America Aroma Chemicals Industry Revenue Share (%), by Application 2024 & 2032
- Figure 22: North America Aroma Chemicals Industry Revenue (Million), by Country 2024 & 2032
- Figure 23: North America Aroma Chemicals Industry Revenue Share (%), by Country 2024 & 2032
- Figure 24: Europe Aroma Chemicals Industry Revenue (Million), by Type 2024 & 2032
- Figure 25: Europe Aroma Chemicals Industry Revenue Share (%), by Type 2024 & 2032
- Figure 26: Europe Aroma Chemicals Industry Revenue (Million), by Application 2024 & 2032
- Figure 27: Europe Aroma Chemicals Industry Revenue Share (%), by Application 2024 & 2032
- Figure 28: Europe Aroma Chemicals Industry Revenue (Million), by Country 2024 & 2032
- Figure 29: Europe Aroma Chemicals Industry Revenue Share (%), by Country 2024 & 2032
- Figure 30: South America Aroma Chemicals Industry Revenue (Million), by Type 2024 & 2032
- Figure 31: South America Aroma Chemicals Industry Revenue Share (%), by Type 2024 & 2032
- Figure 32: South America Aroma Chemicals Industry Revenue (Million), by Application 2024 & 2032
- Figure 33: South America Aroma Chemicals Industry Revenue Share (%), by Application 2024 & 2032
- Figure 34: South America Aroma Chemicals Industry Revenue (Million), by Country 2024 & 2032
- Figure 35: South America Aroma Chemicals Industry Revenue Share (%), by Country 2024 & 2032
- Figure 36: Middle East and Africa Aroma Chemicals Industry Revenue (Million), by Type 2024 & 2032
- Figure 37: Middle East and Africa Aroma Chemicals Industry Revenue Share (%), by Type 2024 & 2032
- Figure 38: Middle East and Africa Aroma Chemicals Industry Revenue (Million), by Application 2024 & 2032
- Figure 39: Middle East and Africa Aroma Chemicals Industry Revenue Share (%), by Application 2024 & 2032
- Figure 40: Middle East and Africa Aroma Chemicals Industry Revenue (Million), by Country 2024 & 2032
- Figure 41: Middle East and Africa Aroma Chemicals Industry Revenue Share (%), by Country 2024 & 2032
List of Tables
- Table 1: Global Aroma Chemicals Industry Revenue Million Forecast, by Region 2019 & 2032
- Table 2: Global Aroma Chemicals Industry Revenue Million Forecast, by Type 2019 & 2032
- Table 3: Global Aroma Chemicals Industry Revenue Million Forecast, by Application 2019 & 2032
- Table 4: Global Aroma Chemicals Industry Revenue Million Forecast, by Region 2019 & 2032
- Table 5: Global Aroma Chemicals Industry Revenue Million Forecast, by Country 2019 & 2032
- Table 6: China Aroma Chemicals Industry Revenue (Million) Forecast, by Application 2019 & 2032
- Table 7: India Aroma Chemicals Industry Revenue (Million) Forecast, by Application 2019 & 2032
- Table 8: Japan Aroma Chemicals Industry Revenue (Million) Forecast, by Application 2019 & 2032
- Table 9: South Korea Aroma Chemicals Industry Revenue (Million) Forecast, by Application 2019 & 2032
- Table 10: Rest of Asia Pacific Aroma Chemicals Industry Revenue (Million) Forecast, by Application 2019 & 2032
- Table 11: Global Aroma Chemicals Industry Revenue Million Forecast, by Country 2019 & 2032
- Table 12: United States Aroma Chemicals Industry Revenue (Million) Forecast, by Application 2019 & 2032
- Table 13: Canada Aroma Chemicals Industry Revenue (Million) Forecast, by Application 2019 & 2032
- Table 14: Mexico Aroma Chemicals Industry Revenue (Million) Forecast, by Application 2019 & 2032
- Table 15: Global Aroma Chemicals Industry Revenue Million Forecast, by Country 2019 & 2032
- Table 16: Germany Aroma Chemicals Industry Revenue (Million) Forecast, by Application 2019 & 2032
- Table 17: United Kingdom Aroma Chemicals Industry Revenue (Million) Forecast, by Application 2019 & 2032
- Table 18: Italy Aroma Chemicals Industry Revenue (Million) Forecast, by Application 2019 & 2032
- Table 19: France Aroma Chemicals Industry Revenue (Million) Forecast, by Application 2019 & 2032
- Table 20: Rest of Europe Aroma Chemicals Industry Revenue (Million) Forecast, by Application 2019 & 2032
- Table 21: Global Aroma Chemicals Industry Revenue Million Forecast, by Country 2019 & 2032
- Table 22: Brazil Aroma Chemicals Industry Revenue (Million) Forecast, by Application 2019 & 2032
- Table 23: Argentina Aroma Chemicals Industry Revenue (Million) Forecast, by Application 2019 & 2032
- Table 24: Rest of South America Aroma Chemicals Industry Revenue (Million) Forecast, by Application 2019 & 2032
- Table 25: Global Aroma Chemicals Industry Revenue Million Forecast, by Country 2019 & 2032
- Table 26: Saudi Arabia Aroma Chemicals Industry Revenue (Million) Forecast, by Application 2019 & 2032
- Table 27: South Africa Aroma Chemicals Industry Revenue (Million) Forecast, by Application 2019 & 2032
- Table 28: Rest of Middle East and Africa Aroma Chemicals Industry Revenue (Million) Forecast, by Application 2019 & 2032
- Table 29: Global Aroma Chemicals Industry Revenue Million Forecast, by Type 2019 & 2032
- Table 30: Global Aroma Chemicals Industry Revenue Million Forecast, by Application 2019 & 2032
- Table 31: Global Aroma Chemicals Industry Revenue Million Forecast, by Country 2019 & 2032
- Table 32: China Aroma Chemicals Industry Revenue (Million) Forecast, by Application 2019 & 2032
- Table 33: India Aroma Chemicals Industry Revenue (Million) Forecast, by Application 2019 & 2032
- Table 34: Japan Aroma Chemicals Industry Revenue (Million) Forecast, by Application 2019 & 2032
- Table 35: South Korea Aroma Chemicals Industry Revenue (Million) Forecast, by Application 2019 & 2032
- Table 36: Rest of Asia Pacific Aroma Chemicals Industry Revenue (Million) Forecast, by Application 2019 & 2032
- Table 37: Global Aroma Chemicals Industry Revenue Million Forecast, by Type 2019 & 2032
- Table 38: Global Aroma Chemicals Industry Revenue Million Forecast, by Application 2019 & 2032
- Table 39: Global Aroma Chemicals Industry Revenue Million Forecast, by Country 2019 & 2032
- Table 40: United States Aroma Chemicals Industry Revenue (Million) Forecast, by Application 2019 & 2032
- Table 41: Canada Aroma Chemicals Industry Revenue (Million) Forecast, by Application 2019 & 2032
- Table 42: Mexico Aroma Chemicals Industry Revenue (Million) Forecast, by Application 2019 & 2032
- Table 43: Global Aroma Chemicals Industry Revenue Million Forecast, by Type 2019 & 2032
- Table 44: Global Aroma Chemicals Industry Revenue Million Forecast, by Application 2019 & 2032
- Table 45: Global Aroma Chemicals Industry Revenue Million Forecast, by Country 2019 & 2032
- Table 46: Germany Aroma Chemicals Industry Revenue (Million) Forecast, by Application 2019 & 2032
- Table 47: United Kingdom Aroma Chemicals Industry Revenue (Million) Forecast, by Application 2019 & 2032
- Table 48: Italy Aroma Chemicals Industry Revenue (Million) Forecast, by Application 2019 & 2032
- Table 49: France Aroma Chemicals Industry Revenue (Million) Forecast, by Application 2019 & 2032
- Table 50: Rest of Europe Aroma Chemicals Industry Revenue (Million) Forecast, by Application 2019 & 2032
- Table 51: Global Aroma Chemicals Industry Revenue Million Forecast, by Type 2019 & 2032
- Table 52: Global Aroma Chemicals Industry Revenue Million Forecast, by Application 2019 & 2032
- Table 53: Global Aroma Chemicals Industry Revenue Million Forecast, by Country 2019 & 2032
- Table 54: Brazil Aroma Chemicals Industry Revenue (Million) Forecast, by Application 2019 & 2032
- Table 55: Argentina Aroma Chemicals Industry Revenue (Million) Forecast, by Application 2019 & 2032
- Table 56: Rest of South America Aroma Chemicals Industry Revenue (Million) Forecast, by Application 2019 & 2032
- Table 57: Global Aroma Chemicals Industry Revenue Million Forecast, by Type 2019 & 2032
- Table 58: Global Aroma Chemicals Industry Revenue Million Forecast, by Application 2019 & 2032
- Table 59: Global Aroma Chemicals Industry Revenue Million Forecast, by Country 2019 & 2032
- Table 60: Saudi Arabia Aroma Chemicals Industry Revenue (Million) Forecast, by Application 2019 & 2032
- Table 61: South Africa Aroma Chemicals Industry Revenue (Million) Forecast, by Application 2019 & 2032
- Table 62: Rest of Middle East and Africa Aroma Chemicals Industry Revenue (Million) Forecast, by Application 2019 & 2032
Frequently Asked Questions
1. What is the projected Compound Annual Growth Rate (CAGR) of the Aroma Chemicals Industry?
The projected CAGR is approximately 4.65%.
2. Which companies are prominent players in the Aroma Chemicals Industry?
Key companies in the market include Hindustan Mint and Agro Products Pvt Ltd, Givaudan, Symrise, Kalpsutra Chemicals Pvt Ltd, Solvay, Takasago International Corporation, BASF SE, S H Kelkar And Company Limited, Robertet Group, DSM, Bell Flavors & Fragrances, Treatt Plc*List Not Exhaustive, Kao Corporation, Silverline Chemicals.
3. What are the main segments of the Aroma Chemicals Industry?
The market segments include Type, Application.
4. Can you provide details about the market size?
The market size is estimated to be USD 4.66 Million as of 2022.
5. What are some drivers contributing to market growth?
Blooming Use in Fragrance Industry; Increasing advancements in the personal care products industries; Other Drivers.
6. What are the notable trends driving market growth?
Growing Demand from Fine Fragrances Application.
7. Are there any restraints impacting market growth?
High R&D Cost Coupled with Stringent Government Regulation; Other Restraints.
8. Can you provide examples of recent developments in the market?
Sept 2022: Solvay expanded the range of one of its flagship products, Rhovanil Natural CW, with three new natural flavors: Rhovanil Natural Delica, Alta, and Sublima. With these new products, the group will enable the F&B industry to make a cost-effective transition to natural products and respond to growing consumer expectations for healthier, safer, tastier, and more natural products.
9. What pricing options are available for accessing the report?
Pricing options include single-user, multi-user, and enterprise licenses priced at USD 4750, USD 5250, and USD 8750 respectively.
10. Is the market size provided in terms of value or volume?
The market size is provided in terms of value, measured in Million.
11. Are there any specific market keywords associated with the report?
Yes, the market keyword associated with the report is "Aroma Chemicals Industry," which aids in identifying and referencing the specific market segment covered.
12. How do I determine which pricing option suits my needs best?
The pricing options vary based on user requirements and access needs. Individual users may opt for single-user licenses, while businesses requiring broader access may choose multi-user or enterprise licenses for cost-effective access to the report.
13. Are there any additional resources or data provided in the Aroma Chemicals Industry report?
While the report offers comprehensive insights, it's advisable to review the specific contents or supplementary materials provided to ascertain if additional resources or data are available.
14. How can I stay updated on further developments or reports in the Aroma Chemicals Industry?
To stay informed about further developments, trends, and reports in the Aroma Chemicals Industry, consider subscribing to industry newsletters, following relevant companies and organizations, or regularly checking reputable industry news sources and publications.
Methodology
Step 1 - Identification of Relevant Samples Size from Population Database


Step 2 - Approaches for Defining Global Market Size (Value, Volume* & Price*)

Note*: In applicable scenarios
Step 3 - Data Sources
Primary Research
- Web Analytics
- Survey Reports
- Research Institute
- Latest Research Reports
- Opinion Leaders
Secondary Research
- Annual Reports
- White Paper
- Latest Press Release
- Industry Association
- Paid Database
- Investor Presentations

Step 4 - Data Triangulation
Involves using different sources of information in order to increase the validity of a study
These sources are likely to be stakeholders in a program - participants, other researchers, program staff, other community members, and so on.
Then we put all data in single framework & apply various statistical tools to find out the dynamic on the market.
During the analysis stage, feedback from the stakeholder groups would be compared to determine areas of agreement as well as areas of divergence
