

Key Insights
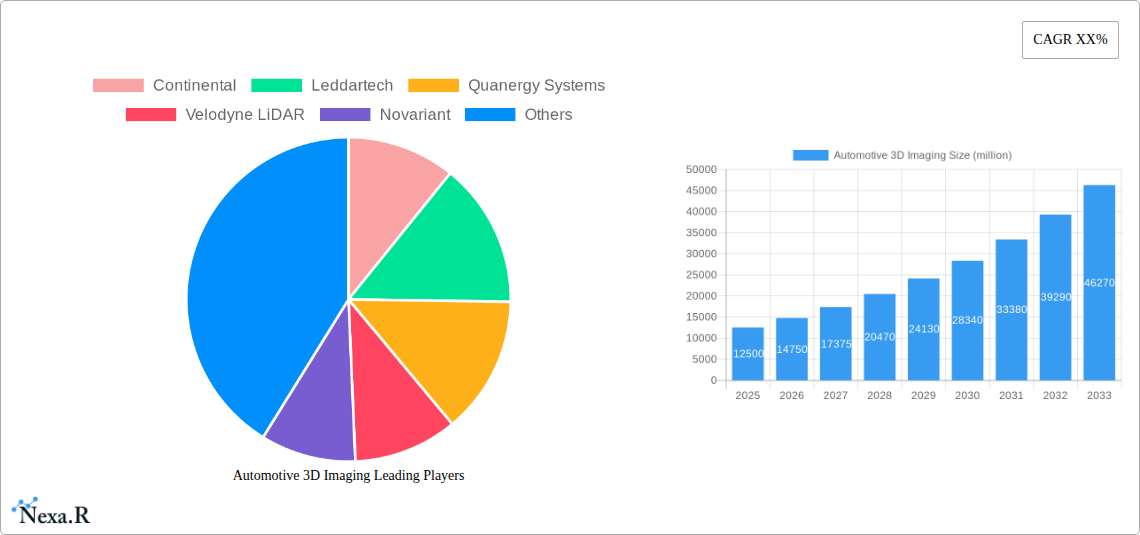
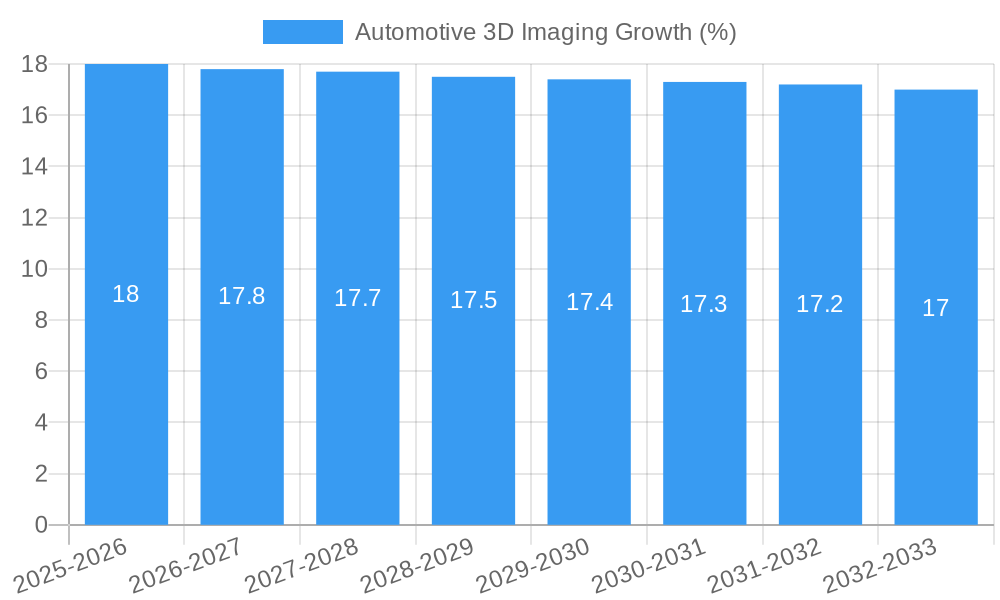
The Automotive 3D Imaging market is poised for substantial growth, projected to reach a market size of approximately $12,500 million by 2025, with an estimated Compound Annual Growth Rate (CAGR) of 18.5% through 2033. This robust expansion is primarily fueled by the accelerating adoption of advanced driver-assistance systems (ADAS) and the burgeoning autonomous vehicle (AV) sector. The increasing demand for enhanced safety features, such as improved object detection, pedestrian recognition, and precise environment mapping, is a significant driver. Furthermore, regulatory mandates and evolving consumer expectations for safer and more convenient mobility solutions are propelling investments in 3D imaging technologies. The market encompasses a diverse range of applications, with Passenger Vehicles leading the adoption, followed closely by Commercial Vehicles, as fleet operators increasingly recognize the benefits of enhanced situational awareness and operational efficiency.
The market's growth is further bolstered by continuous technological advancements across various 3D imaging types, including visible cameras, 3D cameras, night vision cameras, and LiDAR. LiDAR, in particular, is witnessing significant innovation and a steady decline in cost, making it more accessible for a wider range of automotive applications. Key industry players like Continental, Denso, Valeo, and Velodyne LiDAR are at the forefront of this innovation, investing heavily in research and development to deliver more sophisticated and cost-effective solutions. However, challenges such as the high cost of some advanced 3D imaging sensors, the need for robust data processing capabilities, and evolving standardization efforts may present some restraints to the market's unhindered growth. Despite these hurdles, the overarching trend towards smarter, safer, and more automated vehicles ensures a dynamic and promising future for the Automotive 3D Imaging market.
This in-depth report provides a comprehensive analysis of the global Automotive 3D Imaging market, covering a study period from 2019 to 2033, with a base year of 2025. It delves into market dynamics, growth trends, regional dominance, product landscapes, key drivers, challenges, emerging opportunities, growth accelerators, and profiles of leading players. The report offers strategic insights for stakeholders looking to capitalize on the rapidly evolving automotive sensing technology landscape.
Automotive 3D Imaging Market Dynamics & Structure
The Automotive 3D Imaging market exhibits a moderate to high concentration, driven by significant investments in research and development by key industry players. Technological innovation, particularly in sensor resolution, processing power, and artificial intelligence integration, serves as a primary driver. Advancements in LiDAR, 3D cameras, and visible cameras are crucial for enhancing Advanced Driver-Assistance Systems (ADAS) and autonomous driving capabilities. Regulatory frameworks, such as evolving safety standards and mandates for ADAS features in new vehicle models, are shaping market adoption. Competitive product substitutes, primarily advanced 2D vision systems and radar, present a challenge, yet 3D imaging offers superior depth perception and object recognition. End-user demographics are shifting towards tech-savvy consumers demanding enhanced safety and convenience features. Mergers and acquisitions (M&A) are prevalent, with companies consolidating to gain market share, acquire critical technologies, and expand their product portfolios. Recent M&A activity has seen an estimated 15-20 deal volumes annually, focused on sensor fusion and AI software integration.
- Market Concentration: Moderate to High, with strategic alliances and acquisitions shaping the competitive landscape.
- Technological Innovation Drivers: Enhanced ADAS features, autonomous driving development, improved object detection and classification, and robust sensor fusion capabilities.
- Regulatory Frameworks: Increasing government mandates for vehicle safety features and progressive standards for autonomous systems.
- Competitive Product Substitutes: Advanced 2D cameras and radar systems, requiring 3D imaging to demonstrate distinct advantages in perception.
- End-User Demographics: Growing demand for safety, convenience, and futuristic automotive experiences, particularly among younger demographics.
- M&A Trends: Consolidation to achieve economies of scale, access novel technologies, and strengthen competitive positioning.
Automotive 3D Imaging Growth Trends & Insights
The Automotive 3D Imaging market is poised for substantial growth, driven by the relentless pursuit of enhanced vehicle safety and the accelerated development of autonomous driving technologies. The market size, estimated at approximately $7,500 million in 2025, is projected to expand at a Compound Annual Growth Rate (CAGR) of roughly 22% during the forecast period of 2025–2033, reaching an estimated $35,000 million by 2033. Adoption rates of 3D imaging technologies, including LiDAR, 3D cameras, and advanced visible cameras with depth sensing capabilities, are steadily increasing across passenger and commercial vehicle segments. This surge is fueled by the critical role these sensors play in enabling sophisticated ADAS functionalities such as adaptive cruise control, automatic emergency braking, lane-keeping assist, and advanced parking systems.
Technological disruptions are continually redefining the market. Innovations in solid-state LiDAR, time-of-flight (ToF) cameras, and stereo vision systems are driving down costs while improving performance, making 3D imaging solutions more accessible. The integration of AI and machine learning algorithms with 3D sensor data is further enhancing perception capabilities, allowing vehicles to better understand their surroundings, detect objects in complex environments, and make more informed driving decisions. Consumer behavior is also a significant influencer, with a growing awareness and appreciation for advanced safety features and a desire for the convenience and potential of semi-autonomous and fully autonomous driving. This demand directly translates into increased vehicle production equipped with sophisticated 3D imaging systems.
- Market Size Evolution: Projected to grow from $7,500 million in 2025 to $35,000 million by 2033.
- CAGR: Approximately 22% during the forecast period 2025–2033.
- Adoption Rates: Steadily increasing across both passenger and commercial vehicle segments due to ADAS and autonomous driving demands.
- Technological Disruptions: Advancements in solid-state LiDAR, ToF cameras, stereo vision, and AI integration are key catalysts.
- Consumer Behavior Shifts: Growing consumer demand for enhanced vehicle safety, convenience, and the adoption of semi-autonomous driving features.
Dominant Regions, Countries, or Segments in Automotive 3D Imaging
The Passenger Vehicle segment stands as the dominant force driving growth in the Automotive 3D Imaging market. This dominance is primarily attributed to the sheer volume of passenger car production globally and the increasing integration of ADAS and semi-autonomous driving features as standard or optional equipment. The consumer demand for enhanced safety, comfort, and advanced technology in their personal vehicles is a key factor. Furthermore, stringent safety regulations implemented by major automotive markets are pushing manufacturers to equip passenger cars with sophisticated sensing technologies, including 3D cameras and LiDAR, to achieve higher safety ratings.
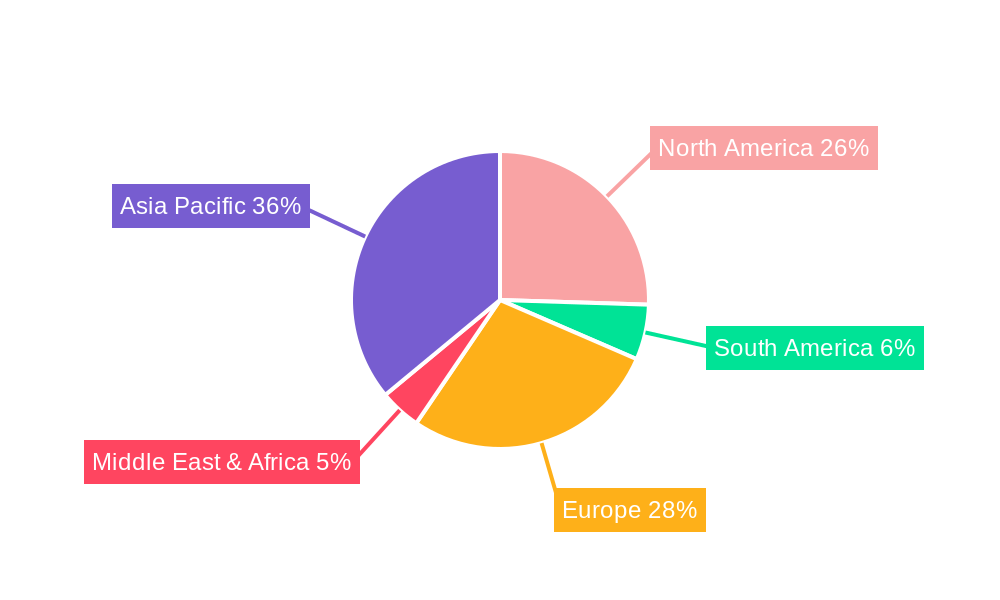
North America and Europe currently lead in terms of market penetration and adoption of advanced 3D imaging technologies in passenger vehicles. This leadership is supported by robust economic policies encouraging innovation, well-established automotive manufacturing bases, and a consumer predisposition towards adopting new automotive technologies. The presence of leading automotive OEMs and Tier-1 suppliers actively investing in R&D and ADAS development further solidifies these regions' dominance. Asia-Pacific, particularly China, is emerging as a significant growth engine, driven by a rapidly expanding automotive market, increasing disposable incomes, and government initiatives to promote intelligent transportation systems and electric vehicle adoption, which often incorporate advanced sensing.
Within the types of 3D imaging, LiDAR is experiencing rapid growth, albeit from a smaller base compared to visible and 3D cameras, due to its unparalleled ability to create precise 3D maps of the environment and detect objects at long ranges with high accuracy, crucial for higher levels of automation. However, 3D Cameras (including stereo cameras and ToF cameras) are expected to see widespread adoption across various ADAS applications due to their cost-effectiveness and ability to provide depth information. The synergy between different sensor types, through sensor fusion, is becoming a critical strategy for achieving robust perception systems.
- Dominant Segment: Passenger Vehicle, driven by high production volumes and widespread ADAS integration.
- Leading Regions: North America and Europe for early adoption and R&D; Asia-Pacific (especially China) for rapid growth.
- Key Drivers in Dominant Regions: Supportive economic policies, strong automotive manufacturing, consumer demand for safety, and government initiatives for intelligent transport.
- Dominant Sensor Type (Growth Potential): LiDAR for advanced automation; 3D Cameras for widespread ADAS applications.
- Market Share: Passenger vehicles are expected to capture over 70% of the market share within the application segments by 2025.
Automotive 3D Imaging Product Landscape
The Automotive 3D Imaging product landscape is characterized by continuous innovation in sensor technology and integration. Companies are developing high-resolution LiDAR sensors with extended range and wider fields of view, capable of detecting objects in adverse weather conditions. 3D cameras, utilizing technologies like stereo vision, time-of-flight (ToF), and structured light, are becoming more compact, energy-efficient, and cost-effective, enabling their integration into a wider array of vehicle platforms. Visible cameras are also evolving with enhanced low-light performance and advanced image processing for improved object recognition and scene understanding. Notable product advancements include compact solid-state LiDAR units suitable for mass production, multi-lens camera systems offering comprehensive 360-degree environmental perception, and specialized night vision cameras that leverage thermal imaging and advanced image enhancement algorithms to provide superior visibility in darkness.
Key Drivers, Barriers & Challenges in Automotive 3D Imaging
Key Drivers:
- Advancement of Autonomous Driving: The pursuit of higher levels of vehicle autonomy is the primary catalyst, necessitating sophisticated 3D perception for safe navigation.
- Enhanced Vehicle Safety Standards: Increasingly stringent global safety regulations mandate the integration of advanced driver-assistance systems (ADAS), which rely heavily on 3D imaging.
- Technological Innovations: Continuous improvements in LiDAR, 3D camera technology, and AI algorithms are making 3D imaging more capable and cost-effective.
- Consumer Demand: Growing consumer preference for safety features, convenience, and the perceived futuristic appeal of advanced automotive technology.
Barriers & Challenges:
- High Cost of Implementation: LiDAR, in particular, can still be a significant cost factor for mass-market vehicles, although prices are declining.
- Environmental Robustness: Ensuring reliable performance of 3D sensors in diverse and challenging environmental conditions (e.g., heavy rain, fog, snow, direct sunlight) remains a technical hurdle.
- Data Processing Power: The immense amount of data generated by 3D imaging systems requires substantial processing power and efficient algorithms, impacting computational costs and energy consumption.
- Standardization and Interoperability: Lack of universal industry standards for 3D sensor data and communication protocols can hinder seamless integration and cross-platform compatibility.
- Supply Chain Volatility: Geopolitical factors and the specialized nature of components can lead to supply chain disruptions, impacting production volumes and costs.
Emerging Opportunities in Automotive 3D Imaging
Emerging opportunities in Automotive 3D Imaging lie in the expanding applications beyond ADAS and full autonomy. The development of sophisticated in-cabin monitoring systems utilizing 3D cameras to track driver attention and occupant behavior presents a significant growth area. Furthermore, the integration of 3D imaging for enhanced vehicle diagnostics, predictive maintenance by analyzing component wear and tear in 3D, and advanced parking assistance with detailed spatial awareness are becoming increasingly viable. The growing electric vehicle (EV) market also offers opportunities, as many EVs are designed with advanced technology integration from the outset, often incorporating LiDAR and advanced camera systems. The development of specialized 3D imaging solutions for commercial vehicles, such as long-haul trucking and delivery fleets, aiming to improve efficiency and safety, is another key emerging market.
Growth Accelerators in the Automotive 3D Imaging Industry
Several catalysts are accelerating growth in the Automotive 3D Imaging industry. Technological breakthroughs in solid-state LiDAR, which promises lower costs and smaller form factors, are making the technology more accessible for mass-market adoption. Strategic partnerships between sensor manufacturers, Tier-1 automotive suppliers, and OEMs are fostering collaborative development and accelerating the integration of 3D imaging solutions into new vehicle platforms. Furthermore, the growing investment in autonomous vehicle research and development by major automotive players and technology companies, coupled with government incentives and supportive policies for smart mobility, are creating a fertile ground for market expansion. The increasing focus on software-defined vehicles and the development of advanced AI algorithms for sensor fusion are also significant growth accelerators.
Key Players Shaping the Automotive 3D Imaging Market
- Continental
- Leddartech
- Quanergy Systems
- Velodyne LiDAR
- Novariant
- Denso
- Phantom Intelligence
- Teledyne Optech
- Valeo
- Omnivision Technologies
Notable Milestones in Automotive 3D Imaging Sector
- 2019: Velodyne LiDAR introduces its first solid-state LiDAR sensor, marking a significant step towards cost reduction and mass adoption.
- 2020: Valeo announces the mass production of its SCALA LiDAR sensor, making it one of the first to achieve this milestone for automotive applications.
- 2021: Continental showcases its advanced 3D camera systems, highlighting improved perception capabilities for ADAS.
- 2022: Leddartech launches its Leddar™ environment sensing platform, offering a flexible and scalable solution for various automotive applications.
- 2023: Quanergy Systems focuses on developing advanced solid-state LiDAR for intelligent transportation systems and autonomous vehicles.
- 2024: Omnivision Technologies introduces new image sensors with enhanced dynamic range and low-light performance, crucial for automotive camera systems.
In-Depth Automotive 3D Imaging Market Outlook
The future outlook for the Automotive 3D Imaging market is exceptionally robust, driven by the accelerating transition towards electric and autonomous vehicles. Growth accelerators such as the continuous innovation in LiDAR and 3D camera technologies, coupled with advancements in AI and sensor fusion, will unlock new levels of vehicle safety and functionality. Strategic collaborations and a burgeoning ecosystem of tech companies and automakers will further expedite market penetration. The increasing regulatory push for advanced safety features and the growing consumer appetite for sophisticated automotive experiences will continue to fuel demand. The market is poised for sustained high growth, offering substantial strategic opportunities for stakeholders to invest in this transformative sector of the automotive industry.
Automotive 3D Imaging Segmentation
-
1. Application
- 1.1. Passenger Vehicle
- 1.2. Commercial Vehicle
-
2. Types
- 2.1. Visible Camera
- 2.2. 3D Camera
- 2.3. Night Vision Camera
- 2.4. LiDAR
Automotive 3D Imaging Segmentation By Geography
-
1. North America
- 1.1. United States
- 1.2. Canada
- 1.3. Mexico
-
2. South America
- 2.1. Brazil
- 2.2. Argentina
- 2.3. Rest of South America
-
3. Europe
- 3.1. United Kingdom
- 3.2. Germany
- 3.3. France
- 3.4. Italy
- 3.5. Spain
- 3.6. Russia
- 3.7. Benelux
- 3.8. Nordics
- 3.9. Rest of Europe
-
4. Middle East & Africa
- 4.1. Turkey
- 4.2. Israel
- 4.3. GCC
- 4.4. North Africa
- 4.5. South Africa
- 4.6. Rest of Middle East & Africa
-
5. Asia Pacific
- 5.1. China
- 5.2. India
- 5.3. Japan
- 5.4. South Korea
- 5.5. ASEAN
- 5.6. Oceania
- 5.7. Rest of Asia Pacific
Automotive 3D Imaging REPORT HIGHLIGHTS
| Aspects | Details |
|---|---|
| Study Period | 2019-2033 |
| Base Year | 2024 |
| Estimated Year | 2025 |
| Forecast Period | 2025-2033 |
| Historical Period | 2019-2024 |
| Growth Rate | CAGR of XX% from 2019-2033 |
| Segmentation |
|
Table of Contents
- 1. Introduction
- 1.1. Research Scope
- 1.2. Market Segmentation
- 1.3. Research Methodology
- 1.4. Definitions and Assumptions
- 2. Executive Summary
- 2.1. Introduction
- 3. Market Dynamics
- 3.1. Introduction
- 3.2. Market Drivers
- 3.3. Market Restrains
- 3.4. Market Trends
- 4. Market Factor Analysis
- 4.1. Porters Five Forces
- 4.2. Supply/Value Chain
- 4.3. PESTEL analysis
- 4.4. Market Entropy
- 4.5. Patent/Trademark Analysis
- 5. Global Automotive 3D Imaging Analysis, Insights and Forecast, 2019-2031
- 5.1. Market Analysis, Insights and Forecast - by Application
- 5.1.1. Passenger Vehicle
- 5.1.2. Commercial Vehicle
- 5.2. Market Analysis, Insights and Forecast - by Types
- 5.2.1. Visible Camera
- 5.2.2. 3D Camera
- 5.2.3. Night Vision Camera
- 5.2.4. LiDAR
- 5.3. Market Analysis, Insights and Forecast - by Region
- 5.3.1. North America
- 5.3.2. South America
- 5.3.3. Europe
- 5.3.4. Middle East & Africa
- 5.3.5. Asia Pacific
- 5.1. Market Analysis, Insights and Forecast - by Application
- 6. North America Automotive 3D Imaging Analysis, Insights and Forecast, 2019-2031
- 6.1. Market Analysis, Insights and Forecast - by Application
- 6.1.1. Passenger Vehicle
- 6.1.2. Commercial Vehicle
- 6.2. Market Analysis, Insights and Forecast - by Types
- 6.2.1. Visible Camera
- 6.2.2. 3D Camera
- 6.2.3. Night Vision Camera
- 6.2.4. LiDAR
- 6.1. Market Analysis, Insights and Forecast - by Application
- 7. South America Automotive 3D Imaging Analysis, Insights and Forecast, 2019-2031
- 7.1. Market Analysis, Insights and Forecast - by Application
- 7.1.1. Passenger Vehicle
- 7.1.2. Commercial Vehicle
- 7.2. Market Analysis, Insights and Forecast - by Types
- 7.2.1. Visible Camera
- 7.2.2. 3D Camera
- 7.2.3. Night Vision Camera
- 7.2.4. LiDAR
- 7.1. Market Analysis, Insights and Forecast - by Application
- 8. Europe Automotive 3D Imaging Analysis, Insights and Forecast, 2019-2031
- 8.1. Market Analysis, Insights and Forecast - by Application
- 8.1.1. Passenger Vehicle
- 8.1.2. Commercial Vehicle
- 8.2. Market Analysis, Insights and Forecast - by Types
- 8.2.1. Visible Camera
- 8.2.2. 3D Camera
- 8.2.3. Night Vision Camera
- 8.2.4. LiDAR
- 8.1. Market Analysis, Insights and Forecast - by Application
- 9. Middle East & Africa Automotive 3D Imaging Analysis, Insights and Forecast, 2019-2031
- 9.1. Market Analysis, Insights and Forecast - by Application
- 9.1.1. Passenger Vehicle
- 9.1.2. Commercial Vehicle
- 9.2. Market Analysis, Insights and Forecast - by Types
- 9.2.1. Visible Camera
- 9.2.2. 3D Camera
- 9.2.3. Night Vision Camera
- 9.2.4. LiDAR
- 9.1. Market Analysis, Insights and Forecast - by Application
- 10. Asia Pacific Automotive 3D Imaging Analysis, Insights and Forecast, 2019-2031
- 10.1. Market Analysis, Insights and Forecast - by Application
- 10.1.1. Passenger Vehicle
- 10.1.2. Commercial Vehicle
- 10.2. Market Analysis, Insights and Forecast - by Types
- 10.2.1. Visible Camera
- 10.2.2. 3D Camera
- 10.2.3. Night Vision Camera
- 10.2.4. LiDAR
- 10.1. Market Analysis, Insights and Forecast - by Application
- 11. Competitive Analysis
- 11.1. Global Market Share Analysis 2024
- 11.2. Company Profiles
- 11.2.1 Continental
- 11.2.1.1. Overview
- 11.2.1.2. Products
- 11.2.1.3. SWOT Analysis
- 11.2.1.4. Recent Developments
- 11.2.1.5. Financials (Based on Availability)
- 11.2.2 Leddartech
- 11.2.2.1. Overview
- 11.2.2.2. Products
- 11.2.2.3. SWOT Analysis
- 11.2.2.4. Recent Developments
- 11.2.2.5. Financials (Based on Availability)
- 11.2.3 Quanergy Systems
- 11.2.3.1. Overview
- 11.2.3.2. Products
- 11.2.3.3. SWOT Analysis
- 11.2.3.4. Recent Developments
- 11.2.3.5. Financials (Based on Availability)
- 11.2.4 Velodyne LiDAR
- 11.2.4.1. Overview
- 11.2.4.2. Products
- 11.2.4.3. SWOT Analysis
- 11.2.4.4. Recent Developments
- 11.2.4.5. Financials (Based on Availability)
- 11.2.5 Novariant
- 11.2.5.1. Overview
- 11.2.5.2. Products
- 11.2.5.3. SWOT Analysis
- 11.2.5.4. Recent Developments
- 11.2.5.5. Financials (Based on Availability)
- 11.2.6 Denso
- 11.2.6.1. Overview
- 11.2.6.2. Products
- 11.2.6.3. SWOT Analysis
- 11.2.6.4. Recent Developments
- 11.2.6.5. Financials (Based on Availability)
- 11.2.7 Phantom Intelligence
- 11.2.7.1. Overview
- 11.2.7.2. Products
- 11.2.7.3. SWOT Analysis
- 11.2.7.4. Recent Developments
- 11.2.7.5. Financials (Based on Availability)
- 11.2.8 Teledyne Optech
- 11.2.8.1. Overview
- 11.2.8.2. Products
- 11.2.8.3. SWOT Analysis
- 11.2.8.4. Recent Developments
- 11.2.8.5. Financials (Based on Availability)
- 11.2.9 Valeo
- 11.2.9.1. Overview
- 11.2.9.2. Products
- 11.2.9.3. SWOT Analysis
- 11.2.9.4. Recent Developments
- 11.2.9.5. Financials (Based on Availability)
- 11.2.10 Omnivision Technologies
- 11.2.10.1. Overview
- 11.2.10.2. Products
- 11.2.10.3. SWOT Analysis
- 11.2.10.4. Recent Developments
- 11.2.10.5. Financials (Based on Availability)
- 11.2.1 Continental
List of Figures
- Figure 1: Global Automotive 3D Imaging Revenue Breakdown (million, %) by Region 2024 & 2032
- Figure 2: North America Automotive 3D Imaging Revenue (million), by Application 2024 & 2032
- Figure 3: North America Automotive 3D Imaging Revenue Share (%), by Application 2024 & 2032
- Figure 4: North America Automotive 3D Imaging Revenue (million), by Types 2024 & 2032
- Figure 5: North America Automotive 3D Imaging Revenue Share (%), by Types 2024 & 2032
- Figure 6: North America Automotive 3D Imaging Revenue (million), by Country 2024 & 2032
- Figure 7: North America Automotive 3D Imaging Revenue Share (%), by Country 2024 & 2032
- Figure 8: South America Automotive 3D Imaging Revenue (million), by Application 2024 & 2032
- Figure 9: South America Automotive 3D Imaging Revenue Share (%), by Application 2024 & 2032
- Figure 10: South America Automotive 3D Imaging Revenue (million), by Types 2024 & 2032
- Figure 11: South America Automotive 3D Imaging Revenue Share (%), by Types 2024 & 2032
- Figure 12: South America Automotive 3D Imaging Revenue (million), by Country 2024 & 2032
- Figure 13: South America Automotive 3D Imaging Revenue Share (%), by Country 2024 & 2032
- Figure 14: Europe Automotive 3D Imaging Revenue (million), by Application 2024 & 2032
- Figure 15: Europe Automotive 3D Imaging Revenue Share (%), by Application 2024 & 2032
- Figure 16: Europe Automotive 3D Imaging Revenue (million), by Types 2024 & 2032
- Figure 17: Europe Automotive 3D Imaging Revenue Share (%), by Types 2024 & 2032
- Figure 18: Europe Automotive 3D Imaging Revenue (million), by Country 2024 & 2032
- Figure 19: Europe Automotive 3D Imaging Revenue Share (%), by Country 2024 & 2032
- Figure 20: Middle East & Africa Automotive 3D Imaging Revenue (million), by Application 2024 & 2032
- Figure 21: Middle East & Africa Automotive 3D Imaging Revenue Share (%), by Application 2024 & 2032
- Figure 22: Middle East & Africa Automotive 3D Imaging Revenue (million), by Types 2024 & 2032
- Figure 23: Middle East & Africa Automotive 3D Imaging Revenue Share (%), by Types 2024 & 2032
- Figure 24: Middle East & Africa Automotive 3D Imaging Revenue (million), by Country 2024 & 2032
- Figure 25: Middle East & Africa Automotive 3D Imaging Revenue Share (%), by Country 2024 & 2032
- Figure 26: Asia Pacific Automotive 3D Imaging Revenue (million), by Application 2024 & 2032
- Figure 27: Asia Pacific Automotive 3D Imaging Revenue Share (%), by Application 2024 & 2032
- Figure 28: Asia Pacific Automotive 3D Imaging Revenue (million), by Types 2024 & 2032
- Figure 29: Asia Pacific Automotive 3D Imaging Revenue Share (%), by Types 2024 & 2032
- Figure 30: Asia Pacific Automotive 3D Imaging Revenue (million), by Country 2024 & 2032
- Figure 31: Asia Pacific Automotive 3D Imaging Revenue Share (%), by Country 2024 & 2032
List of Tables
- Table 1: Global Automotive 3D Imaging Revenue million Forecast, by Region 2019 & 2032
- Table 2: Global Automotive 3D Imaging Revenue million Forecast, by Application 2019 & 2032
- Table 3: Global Automotive 3D Imaging Revenue million Forecast, by Types 2019 & 2032
- Table 4: Global Automotive 3D Imaging Revenue million Forecast, by Region 2019 & 2032
- Table 5: Global Automotive 3D Imaging Revenue million Forecast, by Application 2019 & 2032
- Table 6: Global Automotive 3D Imaging Revenue million Forecast, by Types 2019 & 2032
- Table 7: Global Automotive 3D Imaging Revenue million Forecast, by Country 2019 & 2032
- Table 8: United States Automotive 3D Imaging Revenue (million) Forecast, by Application 2019 & 2032
- Table 9: Canada Automotive 3D Imaging Revenue (million) Forecast, by Application 2019 & 2032
- Table 10: Mexico Automotive 3D Imaging Revenue (million) Forecast, by Application 2019 & 2032
- Table 11: Global Automotive 3D Imaging Revenue million Forecast, by Application 2019 & 2032
- Table 12: Global Automotive 3D Imaging Revenue million Forecast, by Types 2019 & 2032
- Table 13: Global Automotive 3D Imaging Revenue million Forecast, by Country 2019 & 2032
- Table 14: Brazil Automotive 3D Imaging Revenue (million) Forecast, by Application 2019 & 2032
- Table 15: Argentina Automotive 3D Imaging Revenue (million) Forecast, by Application 2019 & 2032
- Table 16: Rest of South America Automotive 3D Imaging Revenue (million) Forecast, by Application 2019 & 2032
- Table 17: Global Automotive 3D Imaging Revenue million Forecast, by Application 2019 & 2032
- Table 18: Global Automotive 3D Imaging Revenue million Forecast, by Types 2019 & 2032
- Table 19: Global Automotive 3D Imaging Revenue million Forecast, by Country 2019 & 2032
- Table 20: United Kingdom Automotive 3D Imaging Revenue (million) Forecast, by Application 2019 & 2032
- Table 21: Germany Automotive 3D Imaging Revenue (million) Forecast, by Application 2019 & 2032
- Table 22: France Automotive 3D Imaging Revenue (million) Forecast, by Application 2019 & 2032
- Table 23: Italy Automotive 3D Imaging Revenue (million) Forecast, by Application 2019 & 2032
- Table 24: Spain Automotive 3D Imaging Revenue (million) Forecast, by Application 2019 & 2032
- Table 25: Russia Automotive 3D Imaging Revenue (million) Forecast, by Application 2019 & 2032
- Table 26: Benelux Automotive 3D Imaging Revenue (million) Forecast, by Application 2019 & 2032
- Table 27: Nordics Automotive 3D Imaging Revenue (million) Forecast, by Application 2019 & 2032
- Table 28: Rest of Europe Automotive 3D Imaging Revenue (million) Forecast, by Application 2019 & 2032
- Table 29: Global Automotive 3D Imaging Revenue million Forecast, by Application 2019 & 2032
- Table 30: Global Automotive 3D Imaging Revenue million Forecast, by Types 2019 & 2032
- Table 31: Global Automotive 3D Imaging Revenue million Forecast, by Country 2019 & 2032
- Table 32: Turkey Automotive 3D Imaging Revenue (million) Forecast, by Application 2019 & 2032
- Table 33: Israel Automotive 3D Imaging Revenue (million) Forecast, by Application 2019 & 2032
- Table 34: GCC Automotive 3D Imaging Revenue (million) Forecast, by Application 2019 & 2032
- Table 35: North Africa Automotive 3D Imaging Revenue (million) Forecast, by Application 2019 & 2032
- Table 36: South Africa Automotive 3D Imaging Revenue (million) Forecast, by Application 2019 & 2032
- Table 37: Rest of Middle East & Africa Automotive 3D Imaging Revenue (million) Forecast, by Application 2019 & 2032
- Table 38: Global Automotive 3D Imaging Revenue million Forecast, by Application 2019 & 2032
- Table 39: Global Automotive 3D Imaging Revenue million Forecast, by Types 2019 & 2032
- Table 40: Global Automotive 3D Imaging Revenue million Forecast, by Country 2019 & 2032
- Table 41: China Automotive 3D Imaging Revenue (million) Forecast, by Application 2019 & 2032
- Table 42: India Automotive 3D Imaging Revenue (million) Forecast, by Application 2019 & 2032
- Table 43: Japan Automotive 3D Imaging Revenue (million) Forecast, by Application 2019 & 2032
- Table 44: South Korea Automotive 3D Imaging Revenue (million) Forecast, by Application 2019 & 2032
- Table 45: ASEAN Automotive 3D Imaging Revenue (million) Forecast, by Application 2019 & 2032
- Table 46: Oceania Automotive 3D Imaging Revenue (million) Forecast, by Application 2019 & 2032
- Table 47: Rest of Asia Pacific Automotive 3D Imaging Revenue (million) Forecast, by Application 2019 & 2032
Frequently Asked Questions
1. What is the projected Compound Annual Growth Rate (CAGR) of the Automotive 3D Imaging?
The projected CAGR is approximately XX%.
2. Which companies are prominent players in the Automotive 3D Imaging?
Key companies in the market include Continental, Leddartech, Quanergy Systems, Velodyne LiDAR, Novariant, Denso, Phantom Intelligence, Teledyne Optech, Valeo, Omnivision Technologies.
3. What are the main segments of the Automotive 3D Imaging?
The market segments include Application, Types.
4. Can you provide details about the market size?
The market size is estimated to be USD XXX million as of 2022.
5. What are some drivers contributing to market growth?
N/A
6. What are the notable trends driving market growth?
N/A
7. Are there any restraints impacting market growth?
N/A
8. Can you provide examples of recent developments in the market?
N/A
9. What pricing options are available for accessing the report?
Pricing options include single-user, multi-user, and enterprise licenses priced at USD 3350.00, USD 5025.00, and USD 6700.00 respectively.
10. Is the market size provided in terms of value or volume?
The market size is provided in terms of value, measured in million.
11. Are there any specific market keywords associated with the report?
Yes, the market keyword associated with the report is "Automotive 3D Imaging," which aids in identifying and referencing the specific market segment covered.
12. How do I determine which pricing option suits my needs best?
The pricing options vary based on user requirements and access needs. Individual users may opt for single-user licenses, while businesses requiring broader access may choose multi-user or enterprise licenses for cost-effective access to the report.
13. Are there any additional resources or data provided in the Automotive 3D Imaging report?
While the report offers comprehensive insights, it's advisable to review the specific contents or supplementary materials provided to ascertain if additional resources or data are available.
14. How can I stay updated on further developments or reports in the Automotive 3D Imaging?
To stay informed about further developments, trends, and reports in the Automotive 3D Imaging, consider subscribing to industry newsletters, following relevant companies and organizations, or regularly checking reputable industry news sources and publications.
Methodology
Step 1 - Identification of Relevant Samples Size from Population Database


Step 2 - Approaches for Defining Global Market Size (Value, Volume* & Price*)

Note*: In applicable scenarios
Step 3 - Data Sources
Primary Research
- Web Analytics
- Survey Reports
- Research Institute
- Latest Research Reports
- Opinion Leaders
Secondary Research
- Annual Reports
- White Paper
- Latest Press Release
- Industry Association
- Paid Database
- Investor Presentations

Step 4 - Data Triangulation
Involves using different sources of information in order to increase the validity of a study
These sources are likely to be stakeholders in a program - participants, other researchers, program staff, other community members, and so on.
Then we put all data in single framework & apply various statistical tools to find out the dynamic on the market.
During the analysis stage, feedback from the stakeholder groups would be compared to determine areas of agreement as well as areas of divergence
