

Key Insights
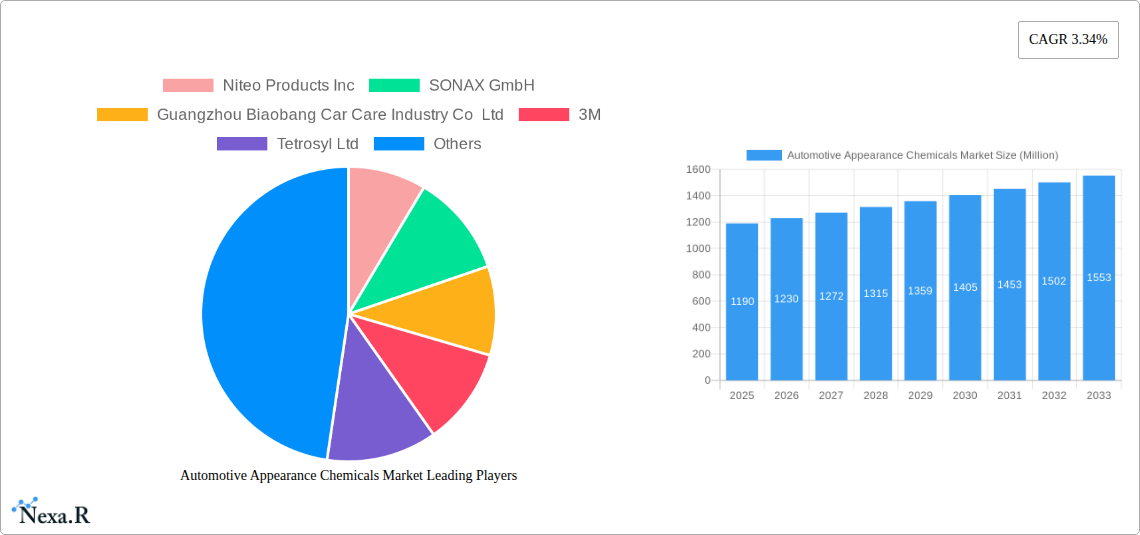
The global automotive appearance chemicals market, valued at $1.19 billion in 2025, is projected to experience steady growth, driven by a rising number of vehicles globally, increasing consumer disposable income, and a growing preference for aesthetically pleasing and well-maintained vehicles. The market's Compound Annual Growth Rate (CAGR) of 3.34% from 2019 to 2024 suggests a continued expansion through 2033. Key product segments include waxes, polishes, protectants, and specialized cleaners for wheels, tires, and windshields. The passenger car segment dominates application-based market share, followed by light commercial vehicles. Growth is further fueled by the increasing popularity of advanced detailing products offering enhanced protection and shine, and the expanding adoption of eco-friendly and sustainable formulations. Geographic expansion is another key driver, with Asia-Pacific, particularly China and India, exhibiting significant growth potential due to expanding automotive sectors and rising consumer demand for car care products. However, fluctuating raw material prices and stringent environmental regulations pose potential challenges to market growth. Competition among established players like 3M, Turtle Wax, and SONAX, along with emerging regional players, is intense, leading to innovation in product formulations and marketing strategies to attract discerning consumers.
The market's segmentation offers diverse opportunities for companies specializing in specific product categories or geographic regions. Companies are focusing on developing innovative products with enhanced performance features such as longer-lasting protection, ease of application, and eco-friendly compositions. The increasing popularity of online retail channels is also impacting market dynamics, providing both challenges and opportunities for manufacturers in terms of distribution and brand building. Future growth hinges on effectively navigating environmental regulations, managing raw material costs, and adapting to evolving consumer preferences for high-performance, environmentally conscious car care solutions. Further market research into emerging technologies and consumer behavior is crucial for companies to maintain a competitive edge and capitalize on future growth opportunities within this dynamic market.
Automotive Appearance Chemicals Market: A Comprehensive Market Research Report (2019-2033)
This in-depth report provides a comprehensive analysis of the Automotive Appearance Chemicals Market, offering invaluable insights for industry professionals, investors, and stakeholders. The study covers the historical period (2019-2024), base year (2025), and forecast period (2025-2033), delivering a clear understanding of market dynamics, growth trends, and future potential. The total market size is projected to reach xx Million units by 2033. This report delves into the parent market of automotive chemicals and the child market of appearance-focused chemicals, providing a granular perspective on market segmentation and competitive landscape.
Automotive Appearance Chemicals Market Dynamics & Structure
This section analyzes the market's competitive landscape, identifying key factors influencing its evolution. The market exhibits a moderately concentrated structure, with several major players and numerous smaller regional competitors vying for market share. Technological innovation, particularly in eco-friendly formulations and advanced performance features, is a key driver. Stringent environmental regulations related to VOC emissions and hazardous substances are shaping product development and manufacturing processes. The availability of substitute products, such as ceramic coatings and PPF (paint protection film), presents ongoing competitive pressure. Consumer preferences for convenience, ease of use, and long-lasting protection are also significant influencers. The Automotive Appearance Chemicals market has witnessed several mergers and acquisitions (M&A) activities in recent years, with an estimated xx M&A deals concluded between 2019 and 2024. This trend is projected to continue, driven by the desire for scale and expansion into new markets.
- Market Concentration: Moderately concentrated, with top 5 players holding approximately xx% market share in 2024.
- Technological Innovation: Focus on eco-friendly formulations, enhanced durability, and specialized applications.
- Regulatory Landscape: Stringent environmental regulations driving the shift towards sustainable products.
- Competitive Substitutes: Growing adoption of ceramic coatings and PPF creating competitive pressure.
- End-User Demographics: Increasing vehicle ownership and consumer demand for aesthetic enhancement.
- M&A Activity: xx M&A deals between 2019-2024, driven by consolidation and market expansion. The average deal size is estimated at xx Million units.
Automotive Appearance Chemicals Market Growth Trends & Insights
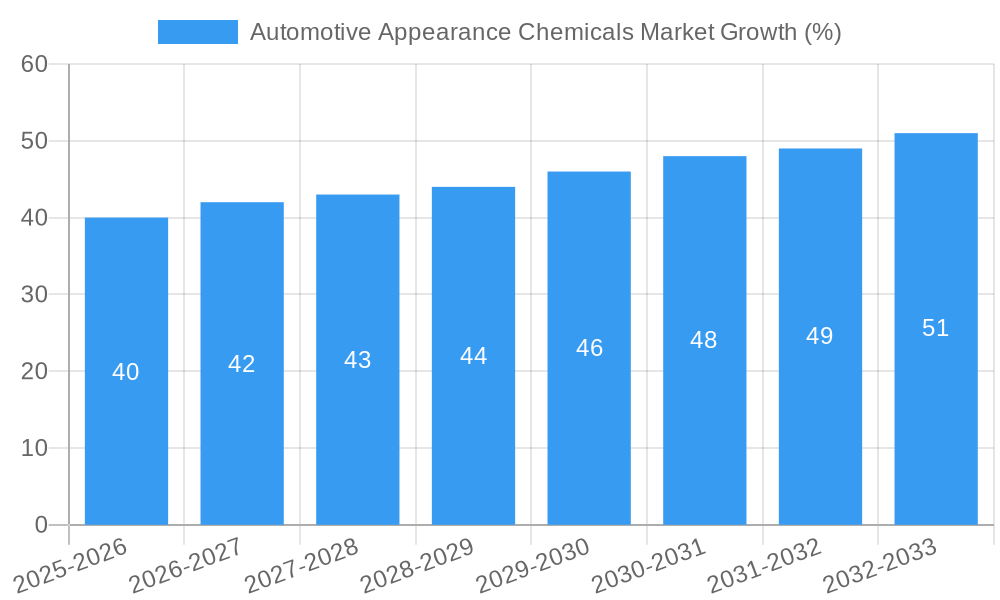
The Automotive Appearance Chemicals market has demonstrated consistent growth over the historical period, driven by factors such as rising vehicle ownership, increasing disposable incomes, and growing consumer awareness of vehicle aesthetics. The market exhibited a CAGR of xx% during 2019-2024. This growth is expected to continue, albeit at a slightly moderated pace, reaching xx Million units by 2033, exhibiting a CAGR of xx% during the forecast period (2025-2033). Technological advancements, such as the introduction of advanced polymer-based products offering superior protection and shine, are further driving market growth. Shifting consumer preferences towards premium and specialized products, such as hydrophobic coatings and detailing kits, are also contributing to market expansion. Market penetration of advanced appearance products remains relatively low, indicating substantial growth potential in untapped segments and regions.
Dominant Regions, Countries, or Segments in Automotive Appearance Chemicals Market
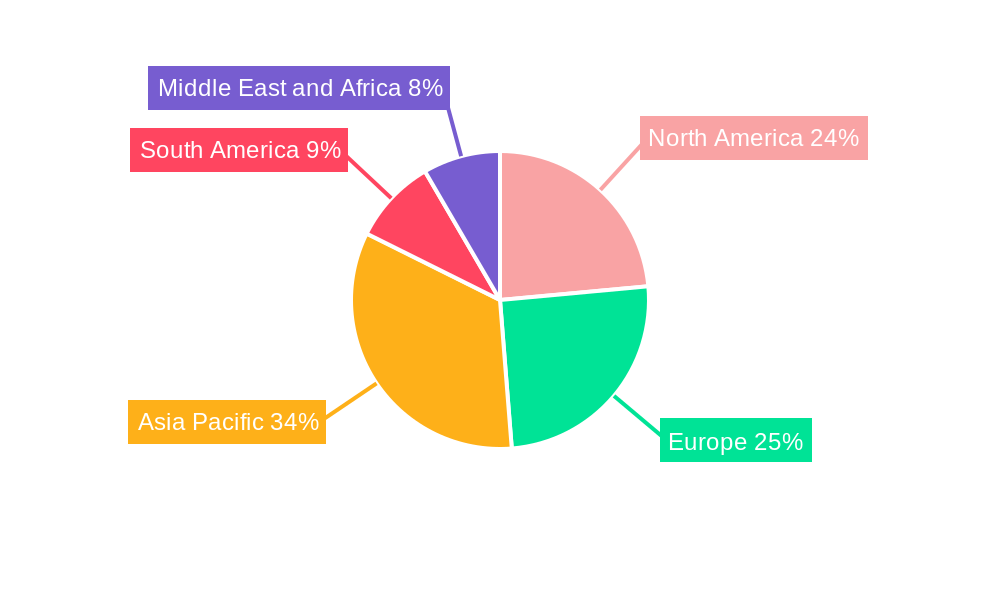
North America and Europe currently hold the largest market shares in the Automotive Appearance Chemicals market, driven by high vehicle ownership rates, strong consumer spending on vehicle aesthetics, and a well-established aftermarket. However, the Asia-Pacific region, particularly China and India, is expected to witness significant growth during the forecast period due to rapidly expanding automotive sectors and rising consumer disposable incomes. Within product segments, Waxes and Polishes represent the largest market share, followed by Protectants. Passenger cars are the dominant application segment, accounting for the majority of market demand.
- Key Drivers for North America & Europe: High vehicle ownership, strong consumer spending, and established aftermarket.
- Key Drivers for Asia-Pacific: Rapid automotive sector growth, rising disposable incomes, and increasing consumer awareness.
- Dominant Product Type: Waxes and Polishes, due to their widespread use and affordability.
- Dominant Application: Passenger cars, due to their high volume compared to commercial vehicles.
- Growth Potential: Asia-Pacific region offers significant growth potential due to expanding automotive markets.
Automotive Appearance Chemicals Market Product Landscape
The Automotive Appearance Chemicals market offers a diverse range of products catering to various needs and preferences. Innovations focus on developing environmentally friendly formulations with improved performance characteristics, such as enhanced durability, superior shine, and hydrophobic properties. Products are categorized by application, ranging from basic waxes and polishes to specialized cleaners and protectants. Unique selling propositions include ease of application, long-lasting protection, and enhanced aesthetic appeal. Technological advancements are focused on incorporating nanotechnology, advanced polymers, and natural ingredients to enhance product efficacy and environmental sustainability.
Key Drivers, Barriers & Challenges in Automotive Appearance Chemicals Market
Key Drivers:
- Growing vehicle ownership globally.
- Increased consumer awareness of vehicle aesthetics.
- Technological advancements leading to superior product performance.
- Rising disposable incomes in emerging markets.
Challenges & Restraints:
- Fluctuations in raw material prices.
- Stringent environmental regulations impacting manufacturing costs.
- Intense competition among established and emerging players.
- Supply chain disruptions impacting product availability and pricing. Supply chain issues contributed to a xx% increase in product costs in 2022.
Emerging Opportunities in Automotive Appearance Chemicals Market
- Expanding into untapped markets in developing economies.
- Developing specialized products for electric vehicles.
- Leveraging digital marketing and e-commerce to reach wider audiences.
- Focus on sustainable and eco-friendly formulations.
- Exploring new applications, such as ceramic coatings and PPF.
Growth Accelerators in the Automotive Appearance Chemicals Market Industry
Technological breakthroughs, such as the development of self-cleaning coatings and advanced polymer technologies, are driving market growth. Strategic partnerships between chemical manufacturers and automotive detailing companies are creating new distribution channels and expanding market reach. Market expansion into emerging economies with increasing vehicle ownership rates presents significant growth opportunities.
Key Players Shaping the Automotive Appearance Chemicals Market Market
- Niteo Products Inc
- SONAX GmbH
- Guangzhou Biaobang Car Care Industry Co Ltd
- 3M
- Tetrosyl Ltd
- Nuvite Chemical Compounds
- Dow
- ITW Global Brands
- Turtle Wax Inc
- LIQUI MOLY GmbH
- Valvoline Chemicals
- General Chemical Corp
Notable Milestones in Automotive Appearance Chemicals Market Sector
- 2021 Q3: Launch of a new biodegradable car wash by Company X.
- 2022 Q1: Acquisition of Company Y by Company Z, expanding market presence.
- 2023 Q2: Introduction of a ceramic coating product by Company A. (Further details in full report)
In-Depth Automotive Appearance Chemicals Market Market Outlook
The Automotive Appearance Chemicals market is poised for continued growth, driven by technological innovation, rising consumer demand, and expansion into new markets. The focus on sustainable and eco-friendly products will be a key trend shaping market dynamics. Strategic partnerships and M&A activity will continue to play an important role in reshaping the competitive landscape. The market presents significant opportunities for companies capable of adapting to evolving consumer preferences and technological advancements.
Automotive Appearance Chemicals Market Segmentation
-
1. Product Type
- 1.1. Waxes
- 1.2. Polishes
- 1.3. Protectants
- 1.4. Wheel and Tire Cleaners
- 1.5. Windshield Washer Fluids
- 1.6. Leather Care Products
- 1.7. Others
-
2. Application
- 2.1. Passenger Cars
- 2.2. Light Commercial Vehicles
- 2.3. Heavy Commercial Vehicles
- 2.4. Others
Automotive Appearance Chemicals Market Segmentation By Geography
-
1. Asia Pacific
- 1.1. China
- 1.2. India
- 1.3. Japan
- 1.4. South Korea
- 1.5. Rest of Asia Pacific
-
2. North America
- 2.1. United States
- 2.2. Canada
- 2.3. Mexico
-
3. Europe
- 3.1. Germany
- 3.2. United Kingdom
- 3.3. France
- 3.4. Italy
- 3.5. Rest of Europe
-
4. South America
- 4.1. Brazil
- 4.2. Argentina
- 4.3. Rest of South America
-
5. Middle East and Africa
- 5.1. Saudi Arabia
- 5.2. South Africa
- 5.3. Rest of Middle East and Africa
Automotive Appearance Chemicals Market REPORT HIGHLIGHTS
| Aspects | Details |
|---|---|
| Study Period | 2019-2033 |
| Base Year | 2024 |
| Estimated Year | 2025 |
| Forecast Period | 2025-2033 |
| Historical Period | 2019-2024 |
| Growth Rate | CAGR of 3.34% from 2019-2033 |
| Segmentation |
|
Table of Contents
- 1. Introduction
- 1.1. Research Scope
- 1.2. Market Segmentation
- 1.3. Research Methodology
- 1.4. Definitions and Assumptions
- 2. Executive Summary
- 2.1. Introduction
- 3. Market Dynamics
- 3.1. Introduction
- 3.2. Market Drivers
- 3.2.1. Increase in the Production of Electric Vehicles (EV); Increase in Consumer Awareness Toward Vehicle Maintenance; Other Drivers
- 3.3. Market Restrains
- 3.3.1. Stringent Government Regulations on Petroleum Products like Waxes and Coatings; Other Restraints
- 3.4. Market Trends
- 3.4.1. Increase in the Production of Electric Vehicles
- 4. Market Factor Analysis
- 4.1. Porters Five Forces
- 4.2. Supply/Value Chain
- 4.3. PESTEL analysis
- 4.4. Market Entropy
- 4.5. Patent/Trademark Analysis
- 5. Global Automotive Appearance Chemicals Market Analysis, Insights and Forecast, 2019-2031
- 5.1. Market Analysis, Insights and Forecast - by Product Type
- 5.1.1. Waxes
- 5.1.2. Polishes
- 5.1.3. Protectants
- 5.1.4. Wheel and Tire Cleaners
- 5.1.5. Windshield Washer Fluids
- 5.1.6. Leather Care Products
- 5.1.7. Others
- 5.2. Market Analysis, Insights and Forecast - by Application
- 5.2.1. Passenger Cars
- 5.2.2. Light Commercial Vehicles
- 5.2.3. Heavy Commercial Vehicles
- 5.2.4. Others
- 5.3. Market Analysis, Insights and Forecast - by Region
- 5.3.1. Asia Pacific
- 5.3.2. North America
- 5.3.3. Europe
- 5.3.4. South America
- 5.3.5. Middle East and Africa
- 5.1. Market Analysis, Insights and Forecast - by Product Type
- 6. Asia Pacific Automotive Appearance Chemicals Market Analysis, Insights and Forecast, 2019-2031
- 6.1. Market Analysis, Insights and Forecast - by Product Type
- 6.1.1. Waxes
- 6.1.2. Polishes
- 6.1.3. Protectants
- 6.1.4. Wheel and Tire Cleaners
- 6.1.5. Windshield Washer Fluids
- 6.1.6. Leather Care Products
- 6.1.7. Others
- 6.2. Market Analysis, Insights and Forecast - by Application
- 6.2.1. Passenger Cars
- 6.2.2. Light Commercial Vehicles
- 6.2.3. Heavy Commercial Vehicles
- 6.2.4. Others
- 6.1. Market Analysis, Insights and Forecast - by Product Type
- 7. North America Automotive Appearance Chemicals Market Analysis, Insights and Forecast, 2019-2031
- 7.1. Market Analysis, Insights and Forecast - by Product Type
- 7.1.1. Waxes
- 7.1.2. Polishes
- 7.1.3. Protectants
- 7.1.4. Wheel and Tire Cleaners
- 7.1.5. Windshield Washer Fluids
- 7.1.6. Leather Care Products
- 7.1.7. Others
- 7.2. Market Analysis, Insights and Forecast - by Application
- 7.2.1. Passenger Cars
- 7.2.2. Light Commercial Vehicles
- 7.2.3. Heavy Commercial Vehicles
- 7.2.4. Others
- 7.1. Market Analysis, Insights and Forecast - by Product Type
- 8. Europe Automotive Appearance Chemicals Market Analysis, Insights and Forecast, 2019-2031
- 8.1. Market Analysis, Insights and Forecast - by Product Type
- 8.1.1. Waxes
- 8.1.2. Polishes
- 8.1.3. Protectants
- 8.1.4. Wheel and Tire Cleaners
- 8.1.5. Windshield Washer Fluids
- 8.1.6. Leather Care Products
- 8.1.7. Others
- 8.2. Market Analysis, Insights and Forecast - by Application
- 8.2.1. Passenger Cars
- 8.2.2. Light Commercial Vehicles
- 8.2.3. Heavy Commercial Vehicles
- 8.2.4. Others
- 8.1. Market Analysis, Insights and Forecast - by Product Type
- 9. South America Automotive Appearance Chemicals Market Analysis, Insights and Forecast, 2019-2031
- 9.1. Market Analysis, Insights and Forecast - by Product Type
- 9.1.1. Waxes
- 9.1.2. Polishes
- 9.1.3. Protectants
- 9.1.4. Wheel and Tire Cleaners
- 9.1.5. Windshield Washer Fluids
- 9.1.6. Leather Care Products
- 9.1.7. Others
- 9.2. Market Analysis, Insights and Forecast - by Application
- 9.2.1. Passenger Cars
- 9.2.2. Light Commercial Vehicles
- 9.2.3. Heavy Commercial Vehicles
- 9.2.4. Others
- 9.1. Market Analysis, Insights and Forecast - by Product Type
- 10. Middle East and Africa Automotive Appearance Chemicals Market Analysis, Insights and Forecast, 2019-2031
- 10.1. Market Analysis, Insights and Forecast - by Product Type
- 10.1.1. Waxes
- 10.1.2. Polishes
- 10.1.3. Protectants
- 10.1.4. Wheel and Tire Cleaners
- 10.1.5. Windshield Washer Fluids
- 10.1.6. Leather Care Products
- 10.1.7. Others
- 10.2. Market Analysis, Insights and Forecast - by Application
- 10.2.1. Passenger Cars
- 10.2.2. Light Commercial Vehicles
- 10.2.3. Heavy Commercial Vehicles
- 10.2.4. Others
- 10.1. Market Analysis, Insights and Forecast - by Product Type
- 11. Asia Pacific Automotive Appearance Chemicals Market Analysis, Insights and Forecast, 2019-2031
- 11.1. Market Analysis, Insights and Forecast - By Country/Sub-region
- 11.1.1 China
- 11.1.2 India
- 11.1.3 Japan
- 11.1.4 South Korea
- 11.1.5 Rest of Asia Pacific
- 12. North America Automotive Appearance Chemicals Market Analysis, Insights and Forecast, 2019-2031
- 12.1. Market Analysis, Insights and Forecast - By Country/Sub-region
- 12.1.1 United States
- 12.1.2 Canada
- 12.1.3 Mexico
- 13. Europe Automotive Appearance Chemicals Market Analysis, Insights and Forecast, 2019-2031
- 13.1. Market Analysis, Insights and Forecast - By Country/Sub-region
- 13.1.1 Germany
- 13.1.2 United Kingdom
- 13.1.3 France
- 13.1.4 Italy
- 13.1.5 Rest of Europe
- 14. South America Automotive Appearance Chemicals Market Analysis, Insights and Forecast, 2019-2031
- 14.1. Market Analysis, Insights and Forecast - By Country/Sub-region
- 14.1.1 Brazil
- 14.1.2 Argentina
- 14.1.3 Rest of South America
- 15. Middle East and Africa Automotive Appearance Chemicals Market Analysis, Insights and Forecast, 2019-2031
- 15.1. Market Analysis, Insights and Forecast - By Country/Sub-region
- 15.1.1 Saudi Arabia
- 15.1.2 South Africa
- 15.1.3 Rest of Middle East and Africa
- 16. Competitive Analysis
- 16.1. Global Market Share Analysis 2024
- 16.2. Company Profiles
- 16.2.1 Niteo Products Inc
- 16.2.1.1. Overview
- 16.2.1.2. Products
- 16.2.1.3. SWOT Analysis
- 16.2.1.4. Recent Developments
- 16.2.1.5. Financials (Based on Availability)
- 16.2.2 SONAX GmbH
- 16.2.2.1. Overview
- 16.2.2.2. Products
- 16.2.2.3. SWOT Analysis
- 16.2.2.4. Recent Developments
- 16.2.2.5. Financials (Based on Availability)
- 16.2.3 Guangzhou Biaobang Car Care Industry Co Ltd
- 16.2.3.1. Overview
- 16.2.3.2. Products
- 16.2.3.3. SWOT Analysis
- 16.2.3.4. Recent Developments
- 16.2.3.5. Financials (Based on Availability)
- 16.2.4 3M
- 16.2.4.1. Overview
- 16.2.4.2. Products
- 16.2.4.3. SWOT Analysis
- 16.2.4.4. Recent Developments
- 16.2.4.5. Financials (Based on Availability)
- 16.2.5 Tetrosyl Ltd
- 16.2.5.1. Overview
- 16.2.5.2. Products
- 16.2.5.3. SWOT Analysis
- 16.2.5.4. Recent Developments
- 16.2.5.5. Financials (Based on Availability)
- 16.2.6 Nuvite Chemical Compounds
- 16.2.6.1. Overview
- 16.2.6.2. Products
- 16.2.6.3. SWOT Analysis
- 16.2.6.4. Recent Developments
- 16.2.6.5. Financials (Based on Availability)
- 16.2.7 Dow
- 16.2.7.1. Overview
- 16.2.7.2. Products
- 16.2.7.3. SWOT Analysis
- 16.2.7.4. Recent Developments
- 16.2.7.5. Financials (Based on Availability)
- 16.2.8 ITW Global Brands
- 16.2.8.1. Overview
- 16.2.8.2. Products
- 16.2.8.3. SWOT Analysis
- 16.2.8.4. Recent Developments
- 16.2.8.5. Financials (Based on Availability)
- 16.2.9 Turtle Wax Inc
- 16.2.9.1. Overview
- 16.2.9.2. Products
- 16.2.9.3. SWOT Analysis
- 16.2.9.4. Recent Developments
- 16.2.9.5. Financials (Based on Availability)
- 16.2.10 LIQUI MOLY GmbH
- 16.2.10.1. Overview
- 16.2.10.2. Products
- 16.2.10.3. SWOT Analysis
- 16.2.10.4. Recent Developments
- 16.2.10.5. Financials (Based on Availability)
- 16.2.11 Valvoline Chemicals*List Not Exhaustive
- 16.2.11.1. Overview
- 16.2.11.2. Products
- 16.2.11.3. SWOT Analysis
- 16.2.11.4. Recent Developments
- 16.2.11.5. Financials (Based on Availability)
- 16.2.12 General Chemical Corp
- 16.2.12.1. Overview
- 16.2.12.2. Products
- 16.2.12.3. SWOT Analysis
- 16.2.12.4. Recent Developments
- 16.2.12.5. Financials (Based on Availability)
- 16.2.1 Niteo Products Inc
List of Figures
- Figure 1: Global Automotive Appearance Chemicals Market Revenue Breakdown (Million, %) by Region 2024 & 2032
- Figure 2: Asia Pacific Automotive Appearance Chemicals Market Revenue (Million), by Country 2024 & 2032
- Figure 3: Asia Pacific Automotive Appearance Chemicals Market Revenue Share (%), by Country 2024 & 2032
- Figure 4: North America Automotive Appearance Chemicals Market Revenue (Million), by Country 2024 & 2032
- Figure 5: North America Automotive Appearance Chemicals Market Revenue Share (%), by Country 2024 & 2032
- Figure 6: Europe Automotive Appearance Chemicals Market Revenue (Million), by Country 2024 & 2032
- Figure 7: Europe Automotive Appearance Chemicals Market Revenue Share (%), by Country 2024 & 2032
- Figure 8: South America Automotive Appearance Chemicals Market Revenue (Million), by Country 2024 & 2032
- Figure 9: South America Automotive Appearance Chemicals Market Revenue Share (%), by Country 2024 & 2032
- Figure 10: Middle East and Africa Automotive Appearance Chemicals Market Revenue (Million), by Country 2024 & 2032
- Figure 11: Middle East and Africa Automotive Appearance Chemicals Market Revenue Share (%), by Country 2024 & 2032
- Figure 12: Asia Pacific Automotive Appearance Chemicals Market Revenue (Million), by Product Type 2024 & 2032
- Figure 13: Asia Pacific Automotive Appearance Chemicals Market Revenue Share (%), by Product Type 2024 & 2032
- Figure 14: Asia Pacific Automotive Appearance Chemicals Market Revenue (Million), by Application 2024 & 2032
- Figure 15: Asia Pacific Automotive Appearance Chemicals Market Revenue Share (%), by Application 2024 & 2032
- Figure 16: Asia Pacific Automotive Appearance Chemicals Market Revenue (Million), by Country 2024 & 2032
- Figure 17: Asia Pacific Automotive Appearance Chemicals Market Revenue Share (%), by Country 2024 & 2032
- Figure 18: North America Automotive Appearance Chemicals Market Revenue (Million), by Product Type 2024 & 2032
- Figure 19: North America Automotive Appearance Chemicals Market Revenue Share (%), by Product Type 2024 & 2032
- Figure 20: North America Automotive Appearance Chemicals Market Revenue (Million), by Application 2024 & 2032
- Figure 21: North America Automotive Appearance Chemicals Market Revenue Share (%), by Application 2024 & 2032
- Figure 22: North America Automotive Appearance Chemicals Market Revenue (Million), by Country 2024 & 2032
- Figure 23: North America Automotive Appearance Chemicals Market Revenue Share (%), by Country 2024 & 2032
- Figure 24: Europe Automotive Appearance Chemicals Market Revenue (Million), by Product Type 2024 & 2032
- Figure 25: Europe Automotive Appearance Chemicals Market Revenue Share (%), by Product Type 2024 & 2032
- Figure 26: Europe Automotive Appearance Chemicals Market Revenue (Million), by Application 2024 & 2032
- Figure 27: Europe Automotive Appearance Chemicals Market Revenue Share (%), by Application 2024 & 2032
- Figure 28: Europe Automotive Appearance Chemicals Market Revenue (Million), by Country 2024 & 2032
- Figure 29: Europe Automotive Appearance Chemicals Market Revenue Share (%), by Country 2024 & 2032
- Figure 30: South America Automotive Appearance Chemicals Market Revenue (Million), by Product Type 2024 & 2032
- Figure 31: South America Automotive Appearance Chemicals Market Revenue Share (%), by Product Type 2024 & 2032
- Figure 32: South America Automotive Appearance Chemicals Market Revenue (Million), by Application 2024 & 2032
- Figure 33: South America Automotive Appearance Chemicals Market Revenue Share (%), by Application 2024 & 2032
- Figure 34: South America Automotive Appearance Chemicals Market Revenue (Million), by Country 2024 & 2032
- Figure 35: South America Automotive Appearance Chemicals Market Revenue Share (%), by Country 2024 & 2032
- Figure 36: Middle East and Africa Automotive Appearance Chemicals Market Revenue (Million), by Product Type 2024 & 2032
- Figure 37: Middle East and Africa Automotive Appearance Chemicals Market Revenue Share (%), by Product Type 2024 & 2032
- Figure 38: Middle East and Africa Automotive Appearance Chemicals Market Revenue (Million), by Application 2024 & 2032
- Figure 39: Middle East and Africa Automotive Appearance Chemicals Market Revenue Share (%), by Application 2024 & 2032
- Figure 40: Middle East and Africa Automotive Appearance Chemicals Market Revenue (Million), by Country 2024 & 2032
- Figure 41: Middle East and Africa Automotive Appearance Chemicals Market Revenue Share (%), by Country 2024 & 2032
List of Tables
- Table 1: Global Automotive Appearance Chemicals Market Revenue Million Forecast, by Region 2019 & 2032
- Table 2: Global Automotive Appearance Chemicals Market Revenue Million Forecast, by Product Type 2019 & 2032
- Table 3: Global Automotive Appearance Chemicals Market Revenue Million Forecast, by Application 2019 & 2032
- Table 4: Global Automotive Appearance Chemicals Market Revenue Million Forecast, by Region 2019 & 2032
- Table 5: Global Automotive Appearance Chemicals Market Revenue Million Forecast, by Country 2019 & 2032
- Table 6: China Automotive Appearance Chemicals Market Revenue (Million) Forecast, by Application 2019 & 2032
- Table 7: India Automotive Appearance Chemicals Market Revenue (Million) Forecast, by Application 2019 & 2032
- Table 8: Japan Automotive Appearance Chemicals Market Revenue (Million) Forecast, by Application 2019 & 2032
- Table 9: South Korea Automotive Appearance Chemicals Market Revenue (Million) Forecast, by Application 2019 & 2032
- Table 10: Rest of Asia Pacific Automotive Appearance Chemicals Market Revenue (Million) Forecast, by Application 2019 & 2032
- Table 11: Global Automotive Appearance Chemicals Market Revenue Million Forecast, by Country 2019 & 2032
- Table 12: United States Automotive Appearance Chemicals Market Revenue (Million) Forecast, by Application 2019 & 2032
- Table 13: Canada Automotive Appearance Chemicals Market Revenue (Million) Forecast, by Application 2019 & 2032
- Table 14: Mexico Automotive Appearance Chemicals Market Revenue (Million) Forecast, by Application 2019 & 2032
- Table 15: Global Automotive Appearance Chemicals Market Revenue Million Forecast, by Country 2019 & 2032
- Table 16: Germany Automotive Appearance Chemicals Market Revenue (Million) Forecast, by Application 2019 & 2032
- Table 17: United Kingdom Automotive Appearance Chemicals Market Revenue (Million) Forecast, by Application 2019 & 2032
- Table 18: France Automotive Appearance Chemicals Market Revenue (Million) Forecast, by Application 2019 & 2032
- Table 19: Italy Automotive Appearance Chemicals Market Revenue (Million) Forecast, by Application 2019 & 2032
- Table 20: Rest of Europe Automotive Appearance Chemicals Market Revenue (Million) Forecast, by Application 2019 & 2032
- Table 21: Global Automotive Appearance Chemicals Market Revenue Million Forecast, by Country 2019 & 2032
- Table 22: Brazil Automotive Appearance Chemicals Market Revenue (Million) Forecast, by Application 2019 & 2032
- Table 23: Argentina Automotive Appearance Chemicals Market Revenue (Million) Forecast, by Application 2019 & 2032
- Table 24: Rest of South America Automotive Appearance Chemicals Market Revenue (Million) Forecast, by Application 2019 & 2032
- Table 25: Global Automotive Appearance Chemicals Market Revenue Million Forecast, by Country 2019 & 2032
- Table 26: Saudi Arabia Automotive Appearance Chemicals Market Revenue (Million) Forecast, by Application 2019 & 2032
- Table 27: South Africa Automotive Appearance Chemicals Market Revenue (Million) Forecast, by Application 2019 & 2032
- Table 28: Rest of Middle East and Africa Automotive Appearance Chemicals Market Revenue (Million) Forecast, by Application 2019 & 2032
- Table 29: Global Automotive Appearance Chemicals Market Revenue Million Forecast, by Product Type 2019 & 2032
- Table 30: Global Automotive Appearance Chemicals Market Revenue Million Forecast, by Application 2019 & 2032
- Table 31: Global Automotive Appearance Chemicals Market Revenue Million Forecast, by Country 2019 & 2032
- Table 32: China Automotive Appearance Chemicals Market Revenue (Million) Forecast, by Application 2019 & 2032
- Table 33: India Automotive Appearance Chemicals Market Revenue (Million) Forecast, by Application 2019 & 2032
- Table 34: Japan Automotive Appearance Chemicals Market Revenue (Million) Forecast, by Application 2019 & 2032
- Table 35: South Korea Automotive Appearance Chemicals Market Revenue (Million) Forecast, by Application 2019 & 2032
- Table 36: Rest of Asia Pacific Automotive Appearance Chemicals Market Revenue (Million) Forecast, by Application 2019 & 2032
- Table 37: Global Automotive Appearance Chemicals Market Revenue Million Forecast, by Product Type 2019 & 2032
- Table 38: Global Automotive Appearance Chemicals Market Revenue Million Forecast, by Application 2019 & 2032
- Table 39: Global Automotive Appearance Chemicals Market Revenue Million Forecast, by Country 2019 & 2032
- Table 40: United States Automotive Appearance Chemicals Market Revenue (Million) Forecast, by Application 2019 & 2032
- Table 41: Canada Automotive Appearance Chemicals Market Revenue (Million) Forecast, by Application 2019 & 2032
- Table 42: Mexico Automotive Appearance Chemicals Market Revenue (Million) Forecast, by Application 2019 & 2032
- Table 43: Global Automotive Appearance Chemicals Market Revenue Million Forecast, by Product Type 2019 & 2032
- Table 44: Global Automotive Appearance Chemicals Market Revenue Million Forecast, by Application 2019 & 2032
- Table 45: Global Automotive Appearance Chemicals Market Revenue Million Forecast, by Country 2019 & 2032
- Table 46: Germany Automotive Appearance Chemicals Market Revenue (Million) Forecast, by Application 2019 & 2032
- Table 47: United Kingdom Automotive Appearance Chemicals Market Revenue (Million) Forecast, by Application 2019 & 2032
- Table 48: France Automotive Appearance Chemicals Market Revenue (Million) Forecast, by Application 2019 & 2032
- Table 49: Italy Automotive Appearance Chemicals Market Revenue (Million) Forecast, by Application 2019 & 2032
- Table 50: Rest of Europe Automotive Appearance Chemicals Market Revenue (Million) Forecast, by Application 2019 & 2032
- Table 51: Global Automotive Appearance Chemicals Market Revenue Million Forecast, by Product Type 2019 & 2032
- Table 52: Global Automotive Appearance Chemicals Market Revenue Million Forecast, by Application 2019 & 2032
- Table 53: Global Automotive Appearance Chemicals Market Revenue Million Forecast, by Country 2019 & 2032
- Table 54: Brazil Automotive Appearance Chemicals Market Revenue (Million) Forecast, by Application 2019 & 2032
- Table 55: Argentina Automotive Appearance Chemicals Market Revenue (Million) Forecast, by Application 2019 & 2032
- Table 56: Rest of South America Automotive Appearance Chemicals Market Revenue (Million) Forecast, by Application 2019 & 2032
- Table 57: Global Automotive Appearance Chemicals Market Revenue Million Forecast, by Product Type 2019 & 2032
- Table 58: Global Automotive Appearance Chemicals Market Revenue Million Forecast, by Application 2019 & 2032
- Table 59: Global Automotive Appearance Chemicals Market Revenue Million Forecast, by Country 2019 & 2032
- Table 60: Saudi Arabia Automotive Appearance Chemicals Market Revenue (Million) Forecast, by Application 2019 & 2032
- Table 61: South Africa Automotive Appearance Chemicals Market Revenue (Million) Forecast, by Application 2019 & 2032
- Table 62: Rest of Middle East and Africa Automotive Appearance Chemicals Market Revenue (Million) Forecast, by Application 2019 & 2032
Frequently Asked Questions
1. What is the projected Compound Annual Growth Rate (CAGR) of the Automotive Appearance Chemicals Market?
The projected CAGR is approximately 3.34%.
2. Which companies are prominent players in the Automotive Appearance Chemicals Market?
Key companies in the market include Niteo Products Inc, SONAX GmbH, Guangzhou Biaobang Car Care Industry Co Ltd, 3M, Tetrosyl Ltd, Nuvite Chemical Compounds, Dow, ITW Global Brands, Turtle Wax Inc, LIQUI MOLY GmbH, Valvoline Chemicals*List Not Exhaustive, General Chemical Corp.
3. What are the main segments of the Automotive Appearance Chemicals Market?
The market segments include Product Type, Application.
4. Can you provide details about the market size?
The market size is estimated to be USD 1.19 Million as of 2022.
5. What are some drivers contributing to market growth?
Increase in the Production of Electric Vehicles (EV); Increase in Consumer Awareness Toward Vehicle Maintenance; Other Drivers.
6. What are the notable trends driving market growth?
Increase in the Production of Electric Vehicles.
7. Are there any restraints impacting market growth?
Stringent Government Regulations on Petroleum Products like Waxes and Coatings; Other Restraints.
8. Can you provide examples of recent developments in the market?
Recent developments in the market studied will be covered in the complete report.
9. What pricing options are available for accessing the report?
Pricing options include single-user, multi-user, and enterprise licenses priced at USD 4750, USD 5250, and USD 8750 respectively.
10. Is the market size provided in terms of value or volume?
The market size is provided in terms of value, measured in Million.
11. Are there any specific market keywords associated with the report?
Yes, the market keyword associated with the report is "Automotive Appearance Chemicals Market," which aids in identifying and referencing the specific market segment covered.
12. How do I determine which pricing option suits my needs best?
The pricing options vary based on user requirements and access needs. Individual users may opt for single-user licenses, while businesses requiring broader access may choose multi-user or enterprise licenses for cost-effective access to the report.
13. Are there any additional resources or data provided in the Automotive Appearance Chemicals Market report?
While the report offers comprehensive insights, it's advisable to review the specific contents or supplementary materials provided to ascertain if additional resources or data are available.
14. How can I stay updated on further developments or reports in the Automotive Appearance Chemicals Market?
To stay informed about further developments, trends, and reports in the Automotive Appearance Chemicals Market, consider subscribing to industry newsletters, following relevant companies and organizations, or regularly checking reputable industry news sources and publications.
Methodology
Step 1 - Identification of Relevant Samples Size from Population Database


Step 2 - Approaches for Defining Global Market Size (Value, Volume* & Price*)

Note*: In applicable scenarios
Step 3 - Data Sources
Primary Research
- Web Analytics
- Survey Reports
- Research Institute
- Latest Research Reports
- Opinion Leaders
Secondary Research
- Annual Reports
- White Paper
- Latest Press Release
- Industry Association
- Paid Database
- Investor Presentations

Step 4 - Data Triangulation
Involves using different sources of information in order to increase the validity of a study
These sources are likely to be stakeholders in a program - participants, other researchers, program staff, other community members, and so on.
Then we put all data in single framework & apply various statistical tools to find out the dynamic on the market.
During the analysis stage, feedback from the stakeholder groups would be compared to determine areas of agreement as well as areas of divergence
