

Key Insights
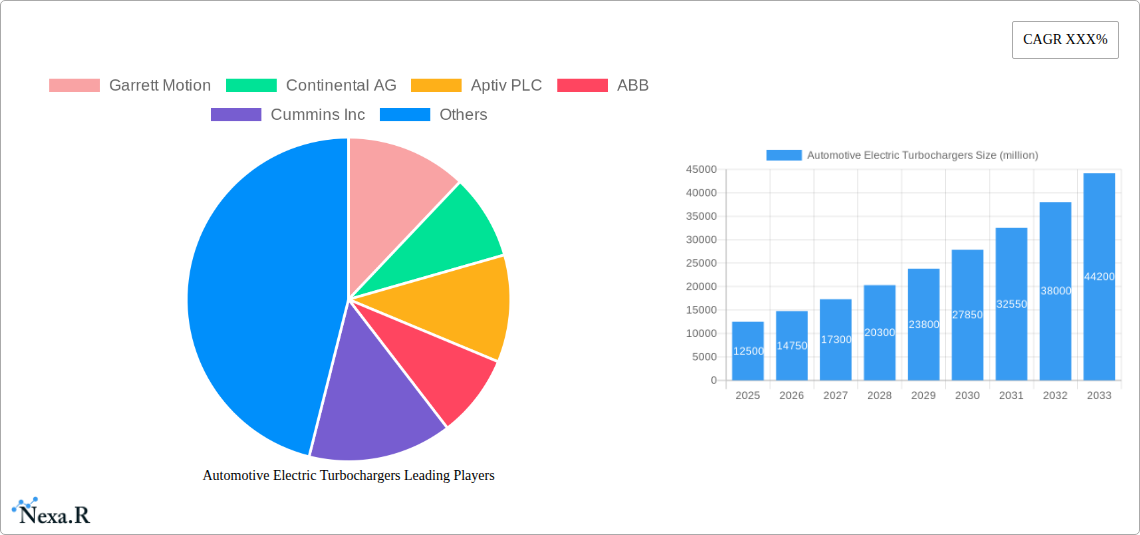
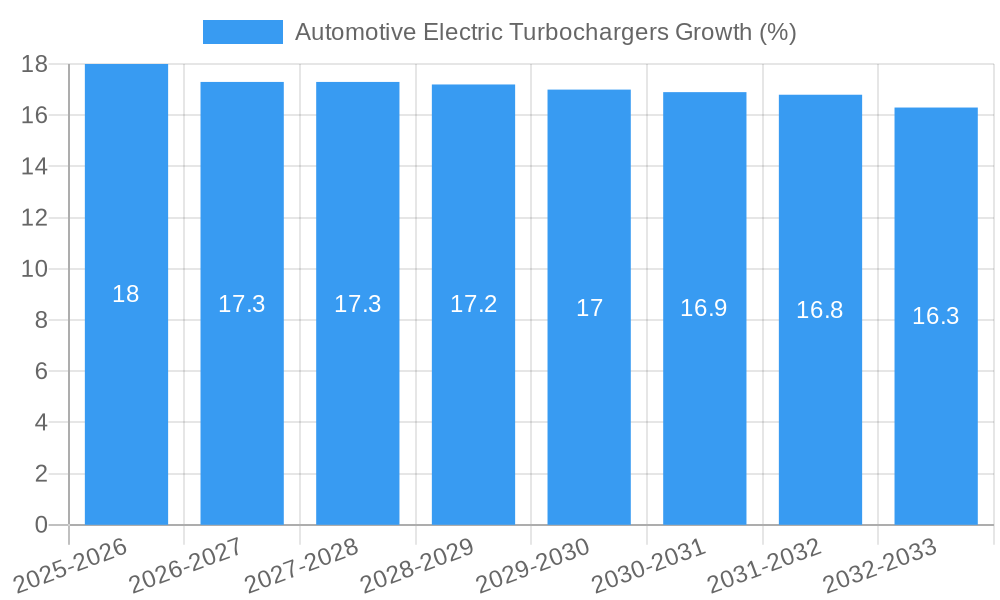
The global automotive electric turbochargers market is poised for substantial expansion, projected to reach an estimated \$12.5 billion by 2025 and grow at a Compound Annual Growth Rate (CAGR) of approximately 18% through 2033. This robust growth is primarily fueled by the increasing demand for enhanced fuel efficiency and reduced emissions across both passenger and commercial vehicle segments. Government regulations worldwide are mandating stricter emission standards, compelling automakers to adopt advanced technologies like electric turbochargers that optimize engine performance and minimize environmental impact. The integration of electric turbochargers allows for faster spool-up times and improved low-end torque, addressing traditional turbo lag and delivering a more responsive driving experience. Furthermore, the rising adoption of hybrid and electric vehicle architectures presents a significant opportunity, as electric turbochargers can complement existing powertrain technologies, improving overall energy management and performance.
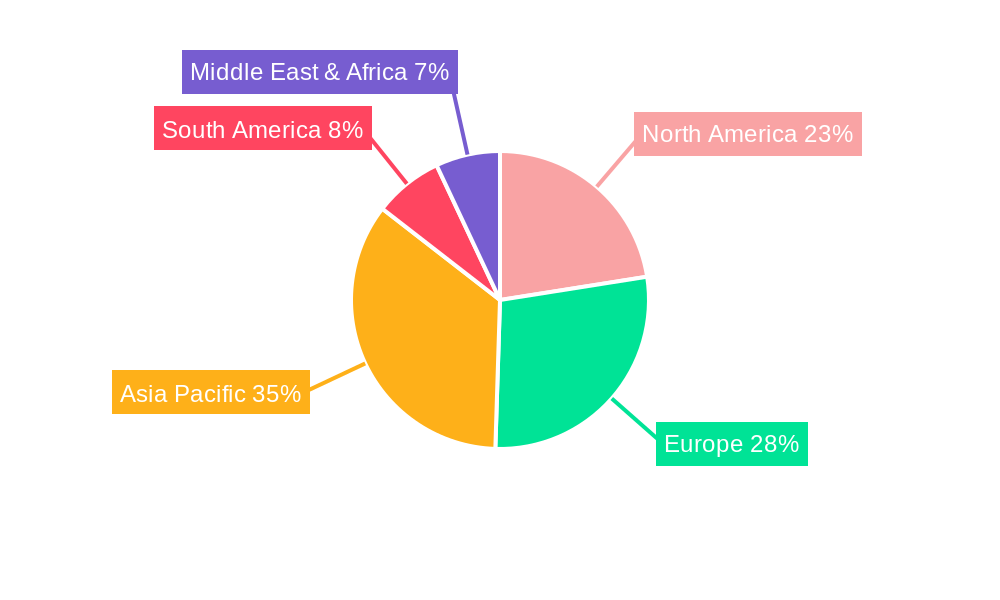
The market is characterized by intense innovation and a competitive landscape featuring major automotive suppliers and specialized turbocharger manufacturers. Key trends include the development of advanced electric motor technologies for turbochargers, improved thermal management systems, and the integration of smart electronics for precise control and diagnostics. While the market exhibits strong growth potential, certain restraints exist, such as the higher initial cost of electric turbochargers compared to conventional ones and the need for robust charging infrastructure to support vehicle electrification, which indirectly influences technology adoption. However, ongoing research and development, coupled with economies of scale, are expected to gradually mitigate these cost barriers. The market segments are clearly defined by application (Passenger Vehicles, Commercial Vehicles) and type (Gasoline, Diesel, Others, which would likely encompass hybrid and potentially future alternative fuel vehicles), with significant penetration anticipated across all major automotive manufacturing regions, led by Asia Pacific and Europe due to their strong automotive production bases and stringent environmental regulations.
Automotive Electric Turbochargers Market Dynamics & Structure
The automotive electric turbocharger market is characterized by a moderate to high concentration, driven by a few major players and a growing number of specialized manufacturers. Technological innovation, particularly in electrification and advanced control systems, is the primary driver of market growth. Stringent emission regulations and the increasing demand for fuel efficiency are also pushing the adoption of electric turbochargers across various vehicle types. Regulatory frameworks set by bodies like the EPA and Euro 6/7 are pivotal in mandating lower emissions, thus favoring advanced boosting technologies. Competitive product substitutes include traditional turbochargers, superchargers, and hybrid powertrains, though electric turbochargers offer distinct advantages in terms of response time and independent control.
- Market Concentration: Dominated by key players like Garrett Motion, Continental AG, and Aptiv PLC, with a growing presence of Asian manufacturers.
- Technological Innovation Drivers: Focus on e-turbos, 48V mild-hybrid integration, advanced thermal management, and miniaturization.
- Regulatory Frameworks: Emission standards (e.g., Euro 7, CAFE standards) are compelling OEMs to adopt cleaner and more efficient engine technologies.
- Competitive Product Substitutes: Traditional turbochargers, twin-charging systems, and advanced naturally aspirated engines.
- End-User Demographics: Growing demand from passenger vehicle owners for improved performance and fuel economy, and from commercial vehicle operators for enhanced power and reduced emissions.
- M&A Trends: Expect strategic acquisitions and partnerships aimed at strengthening technological capabilities and expanding market reach.
Automotive Electric Turbochargers Growth Trends & Insights
The automotive electric turbocharger market is poised for significant expansion, driven by the global automotive industry's relentless pursuit of enhanced performance, improved fuel efficiency, and stricter emissions compliance. This report projects the market size to grow from an estimated $1,500 million units in 2025 to a substantial $5,000 million units by 2033, reflecting a compelling Compound Annual Growth Rate (CAGR) of approximately 16% over the forecast period. The base year of 2025 marks a pivotal point where the technology is moving from niche applications to broader adoption, fueled by advancements in battery technology, power electronics, and control algorithms.
The historical period of 2019-2024 witnessed the foundational development and initial implementation of electric turbocharger technology, primarily in high-performance and luxury vehicles. During this phase, adoption rates were relatively low, constrained by cost and integration complexities. However, the study period of 2019–2033 encompasses a transformative era. The estimated year of 2025 signifies a tipping point, with several key automotive manufacturers integrating electric turbochargers into their mainstream powertrain strategies, particularly within mild-hybrid architectures.
Technological disruptions are a cornerstone of this growth. The development of more efficient electric motors, advanced cooling systems, and sophisticated software for real-time boost control are continuously improving performance metrics, such as turbo lag reduction and optimized power delivery across the entire engine operating range. This has a direct impact on consumer behavior shifts. Drivers are increasingly valuing the enhanced responsiveness and improved torque characteristics that electric turbochargers provide, alongside the tangible benefit of reduced fuel consumption and lower tailpipe emissions.
The market's trajectory is further shaped by the increasing prevalence of 48V mild-hybrid systems. Electric turbochargers, often referred to as e-turbos or electric superchargers, are finding a natural home within these architectures, acting as a powerful enabler for downsizing internal combustion engines without compromising on performance. This synergy allows for further fuel savings and a reduction in CO2 emissions, aligning perfectly with global environmental mandates. The penetration of electric turbochargers into the passenger vehicle segment, driven by stricter emission norms and consumer demand for sporty yet efficient cars, is expected to be a major growth engine. Simultaneously, the commercial vehicle segment is also showing increasing interest, particularly for heavy-duty applications where enhanced low-end torque and rapid response can significantly improve operational efficiency and reduce emissions. The ability of electric turbochargers to provide immediate torque boost, independent of exhaust gas flow, makes them highly attractive for applications requiring frequent acceleration and load changes.
Dominant Regions, Countries, or Segments in Automotive Electric Turbochargers
The passenger vehicles segment, within the broader automotive electric turbochargers market, stands as the dominant force driving growth. This segment is projected to account for a significant majority of the market share, driven by a confluence of factors including stringent emission regulations, increasing consumer demand for performance and fuel efficiency, and the rapid adoption of electrification technologies like mild-hybrid systems. The global automotive industry's transition towards cleaner powertrains directly benefits electric turbochargers as they offer a compelling solution for internal combustion engine (ICE) optimization.
- Application Dominance: Passenger Vehicles are leading the market due to their higher production volumes and the widespread integration of advanced powertrain technologies.
- Key Drivers in Passenger Vehicles:
- Stringent Emission Standards: Regulations like Euro 7 and upcoming standards in North America and Asia are compelling OEMs to reduce CO2 and NOx emissions, making electric turbochargers an attractive solution for engine downsizing and improved combustion efficiency.
- Performance Enhancement: Consumers increasingly expect sporty driving dynamics and immediate throttle response, which electric turbochargers excel at delivering by eliminating turbo lag.
- Fuel Economy Gains: The ability to achieve better combustion and more efficient engine operation directly translates to improved fuel economy, a major purchasing criterion for many consumers.
- Mild-Hybrid Integration: The widespread adoption of 48V mild-hybrid systems provides a ready power source and control architecture for electric turbochargers, facilitating their integration.
- Technological Advancements: Continuous innovation in e-motor efficiency, battery technology, and control software is reducing the cost and improving the performance of electric turbochargers, making them more accessible.
- Market Share & Growth Potential: Passenger vehicles are expected to hold over 70% of the market share by 2033, with a CAGR significantly higher than commercial vehicles. The growth potential in this segment is vast, as manufacturers look to equip a wider range of models, from compact cars to SUVs, with this advanced boosting technology.
- Regional Influence: Europe, with its aggressive emission targets and strong automotive R&D, is a leading region. North America, driven by CAFE standards and consumer appetite for performance, is also a significant market. Asia-Pacific, particularly China, is emerging as a high-growth region due to its massive automotive market and increasing focus on emission control.
- Type Segments: Within passenger vehicles, both Gasoline and Diesel applications are seeing adoption, though the long-term trend favors gasoline engines, especially in conjunction with hybrid powertrains. The "Others" category, including alternative fuel vehicles, may see nascent growth as the market matures.
Automotive Electric Turbochargers Product Landscape
The automotive electric turbocharger landscape is marked by rapid innovation, with manufacturers focusing on enhancing efficiency, reducing response times, and integrating advanced control systems. Products range from compact e-booster units designed to eliminate low-end turbo lag in gasoline and diesel engines to more sophisticated, fully electric turbochargers capable of independent boost control. Key innovations include the use of high-speed electric motors, advanced thermal management to ensure optimal operating temperatures, and smart control algorithms that leverage vehicle data for predictive boost management. These advancements deliver superior torque characteristics, improved fuel economy, and reduced emissions.
Key Drivers, Barriers & Challenges in Automotive Electric Turbochargers
Key Drivers:
- Stringent Emission Regulations: Global mandates for reduced CO2 and NOx emissions are a primary impetus, pushing for more efficient combustion and engine downsizing.
- Demand for Enhanced Performance & Fuel Economy: Consumers seek improved driving dynamics, quicker acceleration, and better fuel efficiency, which electric turbochargers directly address.
- Advancements in Electrification: The proliferation of 48V mild-hybrid systems provides a viable power source and integration platform for electric turbochargers.
- Technological Innovation: Continuous improvements in electric motor efficiency, power electronics, and control software are making e-turbos more cost-effective and higher performing.
Barriers & Challenges:
- High Initial Cost: Electric turbochargers are currently more expensive than traditional turbochargers, posing a hurdle for mass-market adoption, especially in budget-friendly vehicles.
- Integration Complexity: Incorporating e-turbos into existing vehicle architectures requires significant engineering effort and investment from OEMs.
- Power Source Limitations: The reliance on a 48V or higher electrical system can limit widespread deployment in vehicles not already equipped with such infrastructure.
- Thermal Management: Effectively managing the heat generated by the electric motor and compressor is crucial for performance and longevity, posing an engineering challenge.
- Supply Chain Robustness: Ensuring a stable and cost-effective supply chain for critical components, such as high-speed electric motors and power electronics, is vital.
Emerging Opportunities in Automotive Electric Turbochargers
Emerging opportunities in the automotive electric turbocharger sector lie in their expanded application beyond traditional passenger and commercial vehicles. The development of lighter, more compact units for motorcycles and performance-oriented vehicles presents a significant untapped market. Furthermore, the integration of electric turbochargers with hydrogen fuel cell vehicles and other alternative powertrains offers new avenues for growth as the automotive industry diversifies. The increasing focus on sustainable manufacturing practices and the potential for 'recycled' or 'refurbished' electric turbocharger components could also open up cost-effective market segments.
Growth Accelerators in the Automotive Electric Turbochargers Industry
Several key catalysts are accelerating the growth of the automotive electric turbochargers industry. The ongoing development and cost reduction of advanced battery technologies and power electronics are making these systems more economically viable for a broader range of vehicles. Strategic partnerships between turbocharger manufacturers, automotive OEMs, and battery suppliers are crucial for seamless integration and accelerated product development cycles. Furthermore, the increasing global focus on sustainability and the drive towards carbon neutrality are creating a favorable regulatory and market environment that strongly supports the adoption of technologies like electric turbochargers.
Key Players Shaping the Automotive Electric Turbochargers Market
- Garrett Motion
- Continental AG
- Aptiv PLC
- ABB
- Cummins Inc
- Precision Turbo and Engine Inc
- Robert Bosch GmbH
- Mahle
- Rotomaster International
- Mitsubishi Heavy Industries. Ltd
- IHI Corporation
- Kompressorenbau Bannewitz GmbH
- Marelli Corporation
- Turbo Dynamics Ltd
- Valeo
- Fuyuan Turbocharger Co.,Ltd
Notable Milestones in Automotive Electric Turbochargers Sector
- 2019: Introduction of advanced 48V e-turbo concepts by major suppliers, demonstrating potential for lag reduction.
- 2020: First series production vehicle equipped with an electric compressor (e-booster) by a luxury automaker.
- 2021: Increased investment in R&D for high-speed electric motors and advanced control systems by key players.
- 2022: Strategic collaborations between turbocharger manufacturers and battery technology companies to optimize system integration.
- 2023: Growing interest from commercial vehicle manufacturers for electric turbocharger solutions to meet emissions standards.
- 2024: Anticipated broader adoption of electric turbochargers in mainstream passenger vehicle models, especially in mild-hybrid powertrains.
In-Depth Automotive Electric Turbochargers Market Outlook
The automotive electric turbochargers market outlook is exceptionally positive, driven by the synergistic forces of stringent environmental regulations and the insatiable consumer demand for performance coupled with efficiency. Continued advancements in electric motor technology, coupled with the widespread adoption of 48V mild-hybrid architectures, will significantly reduce costs and enhance performance, paving the way for mass-market penetration. Strategic alliances and ongoing innovation in control software will further solidify the position of electric turbochargers as a critical component in the evolution of the internal combustion engine and hybrid powertrains, promising sustained high growth throughout the forecast period.
Automotive Electric Turbochargers Segmentation
-
1. Application
- 1.1. Passenger Vehicles
- 1.2. Commercial Vehicles
-
2. Type
- 2.1. Gasoline
- 2.2. Diesel
- 2.3. Others
Automotive Electric Turbochargers Segmentation By Geography
-
1. North America
- 1.1. United States
- 1.2. Canada
- 1.3. Mexico
-
2. South America
- 2.1. Brazil
- 2.2. Argentina
- 2.3. Rest of South America
-
3. Europe
- 3.1. United Kingdom
- 3.2. Germany
- 3.3. France
- 3.4. Italy
- 3.5. Spain
- 3.6. Russia
- 3.7. Benelux
- 3.8. Nordics
- 3.9. Rest of Europe
-
4. Middle East & Africa
- 4.1. Turkey
- 4.2. Israel
- 4.3. GCC
- 4.4. North Africa
- 4.5. South Africa
- 4.6. Rest of Middle East & Africa
-
5. Asia Pacific
- 5.1. China
- 5.2. India
- 5.3. Japan
- 5.4. South Korea
- 5.5. ASEAN
- 5.6. Oceania
- 5.7. Rest of Asia Pacific
Automotive Electric Turbochargers REPORT HIGHLIGHTS
| Aspects | Details |
|---|---|
| Study Period | 2019-2033 |
| Base Year | 2024 |
| Estimated Year | 2025 |
| Forecast Period | 2025-2033 |
| Historical Period | 2019-2024 |
| Growth Rate | CAGR of XXX% from 2019-2033 |
| Segmentation |
|
Table of Contents
- 1. Introduction
- 1.1. Research Scope
- 1.2. Market Segmentation
- 1.3. Research Methodology
- 1.4. Definitions and Assumptions
- 2. Executive Summary
- 2.1. Introduction
- 3. Market Dynamics
- 3.1. Introduction
- 3.2. Market Drivers
- 3.3. Market Restrains
- 3.4. Market Trends
- 4. Market Factor Analysis
- 4.1. Porters Five Forces
- 4.2. Supply/Value Chain
- 4.3. PESTEL analysis
- 4.4. Market Entropy
- 4.5. Patent/Trademark Analysis
- 5. Global Automotive Electric Turbochargers Analysis, Insights and Forecast, 2019-2031
- 5.1. Market Analysis, Insights and Forecast - by Application
- 5.1.1. Passenger Vehicles
- 5.1.2. Commercial Vehicles
- 5.2. Market Analysis, Insights and Forecast - by Type
- 5.2.1. Gasoline
- 5.2.2. Diesel
- 5.2.3. Others
- 5.3. Market Analysis, Insights and Forecast - by Region
- 5.3.1. North America
- 5.3.2. South America
- 5.3.3. Europe
- 5.3.4. Middle East & Africa
- 5.3.5. Asia Pacific
- 5.1. Market Analysis, Insights and Forecast - by Application
- 6. North America Automotive Electric Turbochargers Analysis, Insights and Forecast, 2019-2031
- 6.1. Market Analysis, Insights and Forecast - by Application
- 6.1.1. Passenger Vehicles
- 6.1.2. Commercial Vehicles
- 6.2. Market Analysis, Insights and Forecast - by Type
- 6.2.1. Gasoline
- 6.2.2. Diesel
- 6.2.3. Others
- 6.1. Market Analysis, Insights and Forecast - by Application
- 7. South America Automotive Electric Turbochargers Analysis, Insights and Forecast, 2019-2031
- 7.1. Market Analysis, Insights and Forecast - by Application
- 7.1.1. Passenger Vehicles
- 7.1.2. Commercial Vehicles
- 7.2. Market Analysis, Insights and Forecast - by Type
- 7.2.1. Gasoline
- 7.2.2. Diesel
- 7.2.3. Others
- 7.1. Market Analysis, Insights and Forecast - by Application
- 8. Europe Automotive Electric Turbochargers Analysis, Insights and Forecast, 2019-2031
- 8.1. Market Analysis, Insights and Forecast - by Application
- 8.1.1. Passenger Vehicles
- 8.1.2. Commercial Vehicles
- 8.2. Market Analysis, Insights and Forecast - by Type
- 8.2.1. Gasoline
- 8.2.2. Diesel
- 8.2.3. Others
- 8.1. Market Analysis, Insights and Forecast - by Application
- 9. Middle East & Africa Automotive Electric Turbochargers Analysis, Insights and Forecast, 2019-2031
- 9.1. Market Analysis, Insights and Forecast - by Application
- 9.1.1. Passenger Vehicles
- 9.1.2. Commercial Vehicles
- 9.2. Market Analysis, Insights and Forecast - by Type
- 9.2.1. Gasoline
- 9.2.2. Diesel
- 9.2.3. Others
- 9.1. Market Analysis, Insights and Forecast - by Application
- 10. Asia Pacific Automotive Electric Turbochargers Analysis, Insights and Forecast, 2019-2031
- 10.1. Market Analysis, Insights and Forecast - by Application
- 10.1.1. Passenger Vehicles
- 10.1.2. Commercial Vehicles
- 10.2. Market Analysis, Insights and Forecast - by Type
- 10.2.1. Gasoline
- 10.2.2. Diesel
- 10.2.3. Others
- 10.1. Market Analysis, Insights and Forecast - by Application
- 11. Competitive Analysis
- 11.1. Global Market Share Analysis 2024
- 11.2. Company Profiles
- 11.2.1 Garrett Motion
- 11.2.1.1. Overview
- 11.2.1.2. Products
- 11.2.1.3. SWOT Analysis
- 11.2.1.4. Recent Developments
- 11.2.1.5. Financials (Based on Availability)
- 11.2.2 Continental AG
- 11.2.2.1. Overview
- 11.2.2.2. Products
- 11.2.2.3. SWOT Analysis
- 11.2.2.4. Recent Developments
- 11.2.2.5. Financials (Based on Availability)
- 11.2.3 Aptiv PLC
- 11.2.3.1. Overview
- 11.2.3.2. Products
- 11.2.3.3. SWOT Analysis
- 11.2.3.4. Recent Developments
- 11.2.3.5. Financials (Based on Availability)
- 11.2.4 ABB
- 11.2.4.1. Overview
- 11.2.4.2. Products
- 11.2.4.3. SWOT Analysis
- 11.2.4.4. Recent Developments
- 11.2.4.5. Financials (Based on Availability)
- 11.2.5 Cummins Inc
- 11.2.5.1. Overview
- 11.2.5.2. Products
- 11.2.5.3. SWOT Analysis
- 11.2.5.4. Recent Developments
- 11.2.5.5. Financials (Based on Availability)
- 11.2.6 Precision Turbo and Engine Inc
- 11.2.6.1. Overview
- 11.2.6.2. Products
- 11.2.6.3. SWOT Analysis
- 11.2.6.4. Recent Developments
- 11.2.6.5. Financials (Based on Availability)
- 11.2.7 Robert Bosch GmbH
- 11.2.7.1. Overview
- 11.2.7.2. Products
- 11.2.7.3. SWOT Analysis
- 11.2.7.4. Recent Developments
- 11.2.7.5. Financials (Based on Availability)
- 11.2.8 Mahle
- 11.2.8.1. Overview
- 11.2.8.2. Products
- 11.2.8.3. SWOT Analysis
- 11.2.8.4. Recent Developments
- 11.2.8.5. Financials (Based on Availability)
- 11.2.9 Rotomaster International
- 11.2.9.1. Overview
- 11.2.9.2. Products
- 11.2.9.3. SWOT Analysis
- 11.2.9.4. Recent Developments
- 11.2.9.5. Financials (Based on Availability)
- 11.2.10 Mitsubishi Heavy Industries. Ltd
- 11.2.10.1. Overview
- 11.2.10.2. Products
- 11.2.10.3. SWOT Analysis
- 11.2.10.4. Recent Developments
- 11.2.10.5. Financials (Based on Availability)
- 11.2.11 IHI Corporation
- 11.2.11.1. Overview
- 11.2.11.2. Products
- 11.2.11.3. SWOT Analysis
- 11.2.11.4. Recent Developments
- 11.2.11.5. Financials (Based on Availability)
- 11.2.12 Kompressorenbau Bannewitz GmbH
- 11.2.12.1. Overview
- 11.2.12.2. Products
- 11.2.12.3. SWOT Analysis
- 11.2.12.4. Recent Developments
- 11.2.12.5. Financials (Based on Availability)
- 11.2.13 Marelli Corporation
- 11.2.13.1. Overview
- 11.2.13.2. Products
- 11.2.13.3. SWOT Analysis
- 11.2.13.4. Recent Developments
- 11.2.13.5. Financials (Based on Availability)
- 11.2.14 Turbo Dynamics Ltd
- 11.2.14.1. Overview
- 11.2.14.2. Products
- 11.2.14.3. SWOT Analysis
- 11.2.14.4. Recent Developments
- 11.2.14.5. Financials (Based on Availability)
- 11.2.15 Valeo
- 11.2.15.1. Overview
- 11.2.15.2. Products
- 11.2.15.3. SWOT Analysis
- 11.2.15.4. Recent Developments
- 11.2.15.5. Financials (Based on Availability)
- 11.2.16 Fuyuan Turbocharger Co.
- 11.2.16.1. Overview
- 11.2.16.2. Products
- 11.2.16.3. SWOT Analysis
- 11.2.16.4. Recent Developments
- 11.2.16.5. Financials (Based on Availability)
- 11.2.17 Ltd
- 11.2.17.1. Overview
- 11.2.17.2. Products
- 11.2.17.3. SWOT Analysis
- 11.2.17.4. Recent Developments
- 11.2.17.5. Financials (Based on Availability)
- 11.2.1 Garrett Motion
List of Figures
- Figure 1: Global Automotive Electric Turbochargers Revenue Breakdown (million, %) by Region 2024 & 2032
- Figure 2: Global Automotive Electric Turbochargers Volume Breakdown (K, %) by Region 2024 & 2032
- Figure 3: North America Automotive Electric Turbochargers Revenue (million), by Application 2024 & 2032
- Figure 4: North America Automotive Electric Turbochargers Volume (K), by Application 2024 & 2032
- Figure 5: North America Automotive Electric Turbochargers Revenue Share (%), by Application 2024 & 2032
- Figure 6: North America Automotive Electric Turbochargers Volume Share (%), by Application 2024 & 2032
- Figure 7: North America Automotive Electric Turbochargers Revenue (million), by Type 2024 & 2032
- Figure 8: North America Automotive Electric Turbochargers Volume (K), by Type 2024 & 2032
- Figure 9: North America Automotive Electric Turbochargers Revenue Share (%), by Type 2024 & 2032
- Figure 10: North America Automotive Electric Turbochargers Volume Share (%), by Type 2024 & 2032
- Figure 11: North America Automotive Electric Turbochargers Revenue (million), by Country 2024 & 2032
- Figure 12: North America Automotive Electric Turbochargers Volume (K), by Country 2024 & 2032
- Figure 13: North America Automotive Electric Turbochargers Revenue Share (%), by Country 2024 & 2032
- Figure 14: North America Automotive Electric Turbochargers Volume Share (%), by Country 2024 & 2032
- Figure 15: South America Automotive Electric Turbochargers Revenue (million), by Application 2024 & 2032
- Figure 16: South America Automotive Electric Turbochargers Volume (K), by Application 2024 & 2032
- Figure 17: South America Automotive Electric Turbochargers Revenue Share (%), by Application 2024 & 2032
- Figure 18: South America Automotive Electric Turbochargers Volume Share (%), by Application 2024 & 2032
- Figure 19: South America Automotive Electric Turbochargers Revenue (million), by Type 2024 & 2032
- Figure 20: South America Automotive Electric Turbochargers Volume (K), by Type 2024 & 2032
- Figure 21: South America Automotive Electric Turbochargers Revenue Share (%), by Type 2024 & 2032
- Figure 22: South America Automotive Electric Turbochargers Volume Share (%), by Type 2024 & 2032
- Figure 23: South America Automotive Electric Turbochargers Revenue (million), by Country 2024 & 2032
- Figure 24: South America Automotive Electric Turbochargers Volume (K), by Country 2024 & 2032
- Figure 25: South America Automotive Electric Turbochargers Revenue Share (%), by Country 2024 & 2032
- Figure 26: South America Automotive Electric Turbochargers Volume Share (%), by Country 2024 & 2032
- Figure 27: Europe Automotive Electric Turbochargers Revenue (million), by Application 2024 & 2032
- Figure 28: Europe Automotive Electric Turbochargers Volume (K), by Application 2024 & 2032
- Figure 29: Europe Automotive Electric Turbochargers Revenue Share (%), by Application 2024 & 2032
- Figure 30: Europe Automotive Electric Turbochargers Volume Share (%), by Application 2024 & 2032
- Figure 31: Europe Automotive Electric Turbochargers Revenue (million), by Type 2024 & 2032
- Figure 32: Europe Automotive Electric Turbochargers Volume (K), by Type 2024 & 2032
- Figure 33: Europe Automotive Electric Turbochargers Revenue Share (%), by Type 2024 & 2032
- Figure 34: Europe Automotive Electric Turbochargers Volume Share (%), by Type 2024 & 2032
- Figure 35: Europe Automotive Electric Turbochargers Revenue (million), by Country 2024 & 2032
- Figure 36: Europe Automotive Electric Turbochargers Volume (K), by Country 2024 & 2032
- Figure 37: Europe Automotive Electric Turbochargers Revenue Share (%), by Country 2024 & 2032
- Figure 38: Europe Automotive Electric Turbochargers Volume Share (%), by Country 2024 & 2032
- Figure 39: Middle East & Africa Automotive Electric Turbochargers Revenue (million), by Application 2024 & 2032
- Figure 40: Middle East & Africa Automotive Electric Turbochargers Volume (K), by Application 2024 & 2032
- Figure 41: Middle East & Africa Automotive Electric Turbochargers Revenue Share (%), by Application 2024 & 2032
- Figure 42: Middle East & Africa Automotive Electric Turbochargers Volume Share (%), by Application 2024 & 2032
- Figure 43: Middle East & Africa Automotive Electric Turbochargers Revenue (million), by Type 2024 & 2032
- Figure 44: Middle East & Africa Automotive Electric Turbochargers Volume (K), by Type 2024 & 2032
- Figure 45: Middle East & Africa Automotive Electric Turbochargers Revenue Share (%), by Type 2024 & 2032
- Figure 46: Middle East & Africa Automotive Electric Turbochargers Volume Share (%), by Type 2024 & 2032
- Figure 47: Middle East & Africa Automotive Electric Turbochargers Revenue (million), by Country 2024 & 2032
- Figure 48: Middle East & Africa Automotive Electric Turbochargers Volume (K), by Country 2024 & 2032
- Figure 49: Middle East & Africa Automotive Electric Turbochargers Revenue Share (%), by Country 2024 & 2032
- Figure 50: Middle East & Africa Automotive Electric Turbochargers Volume Share (%), by Country 2024 & 2032
- Figure 51: Asia Pacific Automotive Electric Turbochargers Revenue (million), by Application 2024 & 2032
- Figure 52: Asia Pacific Automotive Electric Turbochargers Volume (K), by Application 2024 & 2032
- Figure 53: Asia Pacific Automotive Electric Turbochargers Revenue Share (%), by Application 2024 & 2032
- Figure 54: Asia Pacific Automotive Electric Turbochargers Volume Share (%), by Application 2024 & 2032
- Figure 55: Asia Pacific Automotive Electric Turbochargers Revenue (million), by Type 2024 & 2032
- Figure 56: Asia Pacific Automotive Electric Turbochargers Volume (K), by Type 2024 & 2032
- Figure 57: Asia Pacific Automotive Electric Turbochargers Revenue Share (%), by Type 2024 & 2032
- Figure 58: Asia Pacific Automotive Electric Turbochargers Volume Share (%), by Type 2024 & 2032
- Figure 59: Asia Pacific Automotive Electric Turbochargers Revenue (million), by Country 2024 & 2032
- Figure 60: Asia Pacific Automotive Electric Turbochargers Volume (K), by Country 2024 & 2032
- Figure 61: Asia Pacific Automotive Electric Turbochargers Revenue Share (%), by Country 2024 & 2032
- Figure 62: Asia Pacific Automotive Electric Turbochargers Volume Share (%), by Country 2024 & 2032
List of Tables
- Table 1: Global Automotive Electric Turbochargers Revenue million Forecast, by Region 2019 & 2032
- Table 2: Global Automotive Electric Turbochargers Volume K Forecast, by Region 2019 & 2032
- Table 3: Global Automotive Electric Turbochargers Revenue million Forecast, by Application 2019 & 2032
- Table 4: Global Automotive Electric Turbochargers Volume K Forecast, by Application 2019 & 2032
- Table 5: Global Automotive Electric Turbochargers Revenue million Forecast, by Type 2019 & 2032
- Table 6: Global Automotive Electric Turbochargers Volume K Forecast, by Type 2019 & 2032
- Table 7: Global Automotive Electric Turbochargers Revenue million Forecast, by Region 2019 & 2032
- Table 8: Global Automotive Electric Turbochargers Volume K Forecast, by Region 2019 & 2032
- Table 9: Global Automotive Electric Turbochargers Revenue million Forecast, by Application 2019 & 2032
- Table 10: Global Automotive Electric Turbochargers Volume K Forecast, by Application 2019 & 2032
- Table 11: Global Automotive Electric Turbochargers Revenue million Forecast, by Type 2019 & 2032
- Table 12: Global Automotive Electric Turbochargers Volume K Forecast, by Type 2019 & 2032
- Table 13: Global Automotive Electric Turbochargers Revenue million Forecast, by Country 2019 & 2032
- Table 14: Global Automotive Electric Turbochargers Volume K Forecast, by Country 2019 & 2032
- Table 15: United States Automotive Electric Turbochargers Revenue (million) Forecast, by Application 2019 & 2032
- Table 16: United States Automotive Electric Turbochargers Volume (K) Forecast, by Application 2019 & 2032
- Table 17: Canada Automotive Electric Turbochargers Revenue (million) Forecast, by Application 2019 & 2032
- Table 18: Canada Automotive Electric Turbochargers Volume (K) Forecast, by Application 2019 & 2032
- Table 19: Mexico Automotive Electric Turbochargers Revenue (million) Forecast, by Application 2019 & 2032
- Table 20: Mexico Automotive Electric Turbochargers Volume (K) Forecast, by Application 2019 & 2032
- Table 21: Global Automotive Electric Turbochargers Revenue million Forecast, by Application 2019 & 2032
- Table 22: Global Automotive Electric Turbochargers Volume K Forecast, by Application 2019 & 2032
- Table 23: Global Automotive Electric Turbochargers Revenue million Forecast, by Type 2019 & 2032
- Table 24: Global Automotive Electric Turbochargers Volume K Forecast, by Type 2019 & 2032
- Table 25: Global Automotive Electric Turbochargers Revenue million Forecast, by Country 2019 & 2032
- Table 26: Global Automotive Electric Turbochargers Volume K Forecast, by Country 2019 & 2032
- Table 27: Brazil Automotive Electric Turbochargers Revenue (million) Forecast, by Application 2019 & 2032
- Table 28: Brazil Automotive Electric Turbochargers Volume (K) Forecast, by Application 2019 & 2032
- Table 29: Argentina Automotive Electric Turbochargers Revenue (million) Forecast, by Application 2019 & 2032
- Table 30: Argentina Automotive Electric Turbochargers Volume (K) Forecast, by Application 2019 & 2032
- Table 31: Rest of South America Automotive Electric Turbochargers Revenue (million) Forecast, by Application 2019 & 2032
- Table 32: Rest of South America Automotive Electric Turbochargers Volume (K) Forecast, by Application 2019 & 2032
- Table 33: Global Automotive Electric Turbochargers Revenue million Forecast, by Application 2019 & 2032
- Table 34: Global Automotive Electric Turbochargers Volume K Forecast, by Application 2019 & 2032
- Table 35: Global Automotive Electric Turbochargers Revenue million Forecast, by Type 2019 & 2032
- Table 36: Global Automotive Electric Turbochargers Volume K Forecast, by Type 2019 & 2032
- Table 37: Global Automotive Electric Turbochargers Revenue million Forecast, by Country 2019 & 2032
- Table 38: Global Automotive Electric Turbochargers Volume K Forecast, by Country 2019 & 2032
- Table 39: United Kingdom Automotive Electric Turbochargers Revenue (million) Forecast, by Application 2019 & 2032
- Table 40: United Kingdom Automotive Electric Turbochargers Volume (K) Forecast, by Application 2019 & 2032
- Table 41: Germany Automotive Electric Turbochargers Revenue (million) Forecast, by Application 2019 & 2032
- Table 42: Germany Automotive Electric Turbochargers Volume (K) Forecast, by Application 2019 & 2032
- Table 43: France Automotive Electric Turbochargers Revenue (million) Forecast, by Application 2019 & 2032
- Table 44: France Automotive Electric Turbochargers Volume (K) Forecast, by Application 2019 & 2032
- Table 45: Italy Automotive Electric Turbochargers Revenue (million) Forecast, by Application 2019 & 2032
- Table 46: Italy Automotive Electric Turbochargers Volume (K) Forecast, by Application 2019 & 2032
- Table 47: Spain Automotive Electric Turbochargers Revenue (million) Forecast, by Application 2019 & 2032
- Table 48: Spain Automotive Electric Turbochargers Volume (K) Forecast, by Application 2019 & 2032
- Table 49: Russia Automotive Electric Turbochargers Revenue (million) Forecast, by Application 2019 & 2032
- Table 50: Russia Automotive Electric Turbochargers Volume (K) Forecast, by Application 2019 & 2032
- Table 51: Benelux Automotive Electric Turbochargers Revenue (million) Forecast, by Application 2019 & 2032
- Table 52: Benelux Automotive Electric Turbochargers Volume (K) Forecast, by Application 2019 & 2032
- Table 53: Nordics Automotive Electric Turbochargers Revenue (million) Forecast, by Application 2019 & 2032
- Table 54: Nordics Automotive Electric Turbochargers Volume (K) Forecast, by Application 2019 & 2032
- Table 55: Rest of Europe Automotive Electric Turbochargers Revenue (million) Forecast, by Application 2019 & 2032
- Table 56: Rest of Europe Automotive Electric Turbochargers Volume (K) Forecast, by Application 2019 & 2032
- Table 57: Global Automotive Electric Turbochargers Revenue million Forecast, by Application 2019 & 2032
- Table 58: Global Automotive Electric Turbochargers Volume K Forecast, by Application 2019 & 2032
- Table 59: Global Automotive Electric Turbochargers Revenue million Forecast, by Type 2019 & 2032
- Table 60: Global Automotive Electric Turbochargers Volume K Forecast, by Type 2019 & 2032
- Table 61: Global Automotive Electric Turbochargers Revenue million Forecast, by Country 2019 & 2032
- Table 62: Global Automotive Electric Turbochargers Volume K Forecast, by Country 2019 & 2032
- Table 63: Turkey Automotive Electric Turbochargers Revenue (million) Forecast, by Application 2019 & 2032
- Table 64: Turkey Automotive Electric Turbochargers Volume (K) Forecast, by Application 2019 & 2032
- Table 65: Israel Automotive Electric Turbochargers Revenue (million) Forecast, by Application 2019 & 2032
- Table 66: Israel Automotive Electric Turbochargers Volume (K) Forecast, by Application 2019 & 2032
- Table 67: GCC Automotive Electric Turbochargers Revenue (million) Forecast, by Application 2019 & 2032
- Table 68: GCC Automotive Electric Turbochargers Volume (K) Forecast, by Application 2019 & 2032
- Table 69: North Africa Automotive Electric Turbochargers Revenue (million) Forecast, by Application 2019 & 2032
- Table 70: North Africa Automotive Electric Turbochargers Volume (K) Forecast, by Application 2019 & 2032
- Table 71: South Africa Automotive Electric Turbochargers Revenue (million) Forecast, by Application 2019 & 2032
- Table 72: South Africa Automotive Electric Turbochargers Volume (K) Forecast, by Application 2019 & 2032
- Table 73: Rest of Middle East & Africa Automotive Electric Turbochargers Revenue (million) Forecast, by Application 2019 & 2032
- Table 74: Rest of Middle East & Africa Automotive Electric Turbochargers Volume (K) Forecast, by Application 2019 & 2032
- Table 75: Global Automotive Electric Turbochargers Revenue million Forecast, by Application 2019 & 2032
- Table 76: Global Automotive Electric Turbochargers Volume K Forecast, by Application 2019 & 2032
- Table 77: Global Automotive Electric Turbochargers Revenue million Forecast, by Type 2019 & 2032
- Table 78: Global Automotive Electric Turbochargers Volume K Forecast, by Type 2019 & 2032
- Table 79: Global Automotive Electric Turbochargers Revenue million Forecast, by Country 2019 & 2032
- Table 80: Global Automotive Electric Turbochargers Volume K Forecast, by Country 2019 & 2032
- Table 81: China Automotive Electric Turbochargers Revenue (million) Forecast, by Application 2019 & 2032
- Table 82: China Automotive Electric Turbochargers Volume (K) Forecast, by Application 2019 & 2032
- Table 83: India Automotive Electric Turbochargers Revenue (million) Forecast, by Application 2019 & 2032
- Table 84: India Automotive Electric Turbochargers Volume (K) Forecast, by Application 2019 & 2032
- Table 85: Japan Automotive Electric Turbochargers Revenue (million) Forecast, by Application 2019 & 2032
- Table 86: Japan Automotive Electric Turbochargers Volume (K) Forecast, by Application 2019 & 2032
- Table 87: South Korea Automotive Electric Turbochargers Revenue (million) Forecast, by Application 2019 & 2032
- Table 88: South Korea Automotive Electric Turbochargers Volume (K) Forecast, by Application 2019 & 2032
- Table 89: ASEAN Automotive Electric Turbochargers Revenue (million) Forecast, by Application 2019 & 2032
- Table 90: ASEAN Automotive Electric Turbochargers Volume (K) Forecast, by Application 2019 & 2032
- Table 91: Oceania Automotive Electric Turbochargers Revenue (million) Forecast, by Application 2019 & 2032
- Table 92: Oceania Automotive Electric Turbochargers Volume (K) Forecast, by Application 2019 & 2032
- Table 93: Rest of Asia Pacific Automotive Electric Turbochargers Revenue (million) Forecast, by Application 2019 & 2032
- Table 94: Rest of Asia Pacific Automotive Electric Turbochargers Volume (K) Forecast, by Application 2019 & 2032
Frequently Asked Questions
1. What is the projected Compound Annual Growth Rate (CAGR) of the Automotive Electric Turbochargers?
The projected CAGR is approximately XXX%.
2. Which companies are prominent players in the Automotive Electric Turbochargers?
Key companies in the market include Garrett Motion, Continental AG, Aptiv PLC, ABB, Cummins Inc, Precision Turbo and Engine Inc, Robert Bosch GmbH, Mahle, Rotomaster International, Mitsubishi Heavy Industries. Ltd, IHI Corporation, Kompressorenbau Bannewitz GmbH, Marelli Corporation, Turbo Dynamics Ltd, Valeo, Fuyuan Turbocharger Co., Ltd.
3. What are the main segments of the Automotive Electric Turbochargers?
The market segments include Application, Type.
4. Can you provide details about the market size?
The market size is estimated to be USD XXX million as of 2022.
5. What are some drivers contributing to market growth?
N/A
6. What are the notable trends driving market growth?
N/A
7. Are there any restraints impacting market growth?
N/A
8. Can you provide examples of recent developments in the market?
N/A
9. What pricing options are available for accessing the report?
Pricing options include single-user, multi-user, and enterprise licenses priced at USD 3950.00, USD 5925.00, and USD 7900.00 respectively.
10. Is the market size provided in terms of value or volume?
The market size is provided in terms of value, measured in million and volume, measured in K.
11. Are there any specific market keywords associated with the report?
Yes, the market keyword associated with the report is "Automotive Electric Turbochargers," which aids in identifying and referencing the specific market segment covered.
12. How do I determine which pricing option suits my needs best?
The pricing options vary based on user requirements and access needs. Individual users may opt for single-user licenses, while businesses requiring broader access may choose multi-user or enterprise licenses for cost-effective access to the report.
13. Are there any additional resources or data provided in the Automotive Electric Turbochargers report?
While the report offers comprehensive insights, it's advisable to review the specific contents or supplementary materials provided to ascertain if additional resources or data are available.
14. How can I stay updated on further developments or reports in the Automotive Electric Turbochargers?
To stay informed about further developments, trends, and reports in the Automotive Electric Turbochargers, consider subscribing to industry newsletters, following relevant companies and organizations, or regularly checking reputable industry news sources and publications.
Methodology
Step 1 - Identification of Relevant Samples Size from Population Database


Step 2 - Approaches for Defining Global Market Size (Value, Volume* & Price*)

Note*: In applicable scenarios
Step 3 - Data Sources
Primary Research
- Web Analytics
- Survey Reports
- Research Institute
- Latest Research Reports
- Opinion Leaders
Secondary Research
- Annual Reports
- White Paper
- Latest Press Release
- Industry Association
- Paid Database
- Investor Presentations

Step 4 - Data Triangulation
Involves using different sources of information in order to increase the validity of a study
These sources are likely to be stakeholders in a program - participants, other researchers, program staff, other community members, and so on.
Then we put all data in single framework & apply various statistical tools to find out the dynamic on the market.
During the analysis stage, feedback from the stakeholder groups would be compared to determine areas of agreement as well as areas of divergence
