

Key Insights
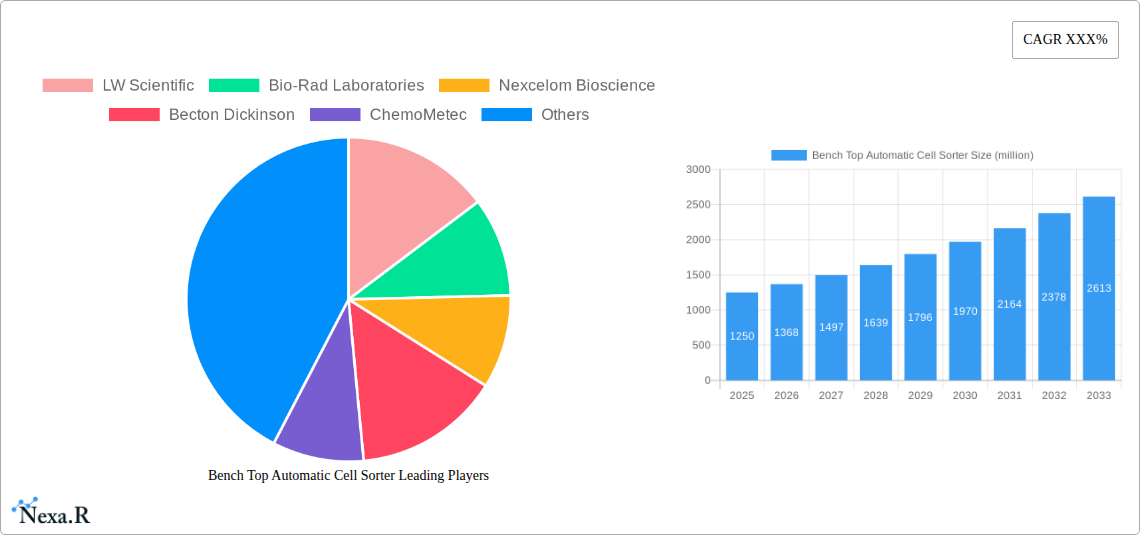
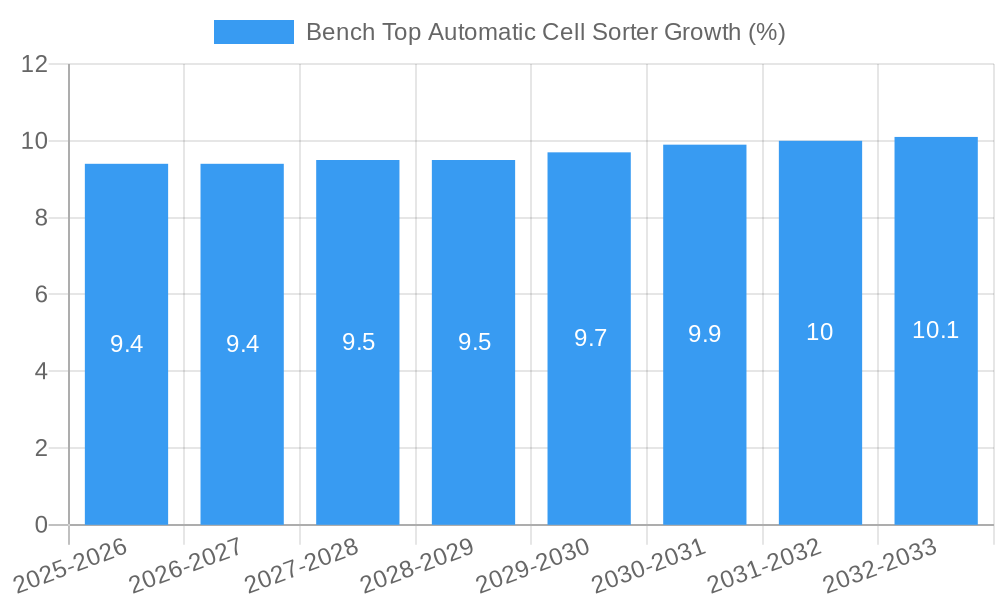
The Bench Top Automatic Cell Sorter market is poised for substantial expansion, projected to reach an estimated $1,250 million by 2025, with a robust Compound Annual Growth Rate (CAGR) of approximately 9.5% over the forecast period of 2025-2033. This growth is fueled by the escalating demand for advanced cell analysis in drug discovery and development, precision medicine, and personalized therapies. Pharmaceutical and biotechnology companies are leading this adoption, leveraging cell sorters for high-throughput screening, target identification, and the development of novel therapeutics. Research institutes are also significant contributors, utilizing these sophisticated instruments for fundamental biological research and understanding disease mechanisms at a cellular level. The increasing prevalence of chronic diseases and the growing focus on cell-based assays for diagnostics are further augmenting market momentum.
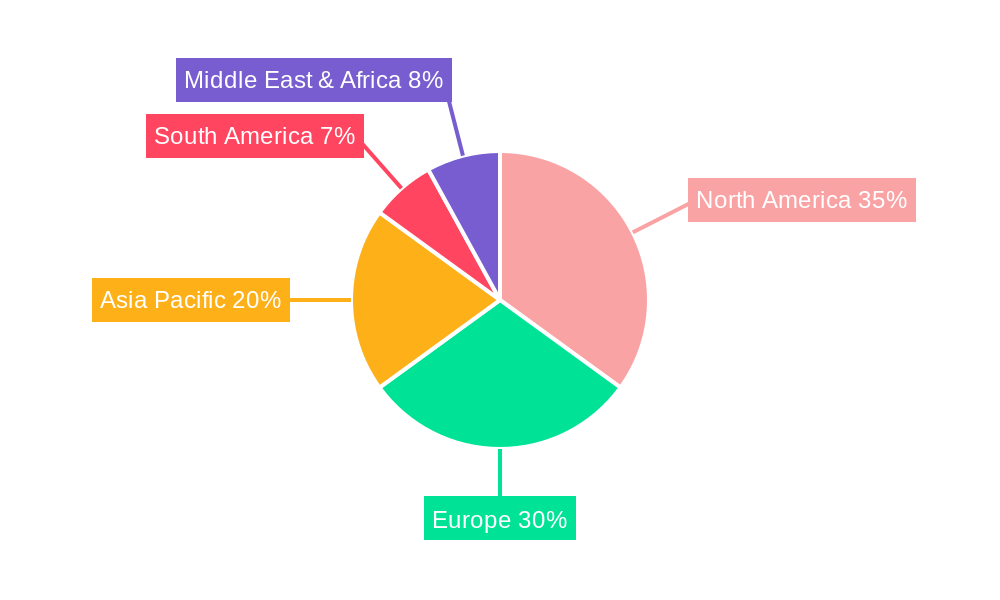
The market is characterized by rapid technological advancements, with a strong trend towards miniaturization, automation, and enhanced sensitivity in benchtop cell sorters. Fluorescent Activated Cell Sorters (FACS) continue to dominate the market due to their versatility and ability to analyze multiple cellular parameters simultaneously. However, innovations in Magnetic Cell Sorting (MACS) and emerging technologies like Buoyancy Activated Cell Sorting are also gaining traction, offering alternative and complementary solutions for specific applications. While the market exhibits strong growth potential, certain restraints such as the high initial cost of advanced cell sorting instruments and the need for skilled personnel to operate and maintain them, may pose challenges. Geographically, North America and Europe currently lead the market, driven by significant R&D investments and a well-established healthcare infrastructure. However, the Asia Pacific region is expected to witness the fastest growth, propelled by increasing healthcare expenditure, a burgeoning biopharmaceutical industry, and government initiatives promoting life sciences research.
Bench Top Automatic Cell Sorter Market: Comprehensive Analysis & Future Outlook (2019-2033)
This report offers a deep dive into the global Bench Top Automatic Cell Sorter market, a critical segment within the broader life sciences instrumentation and biotechnology tools industries. We explore market dynamics, growth trends, regional dominance, product innovations, and key players, providing actionable insights for stakeholders. The study covers the historical period from 2019 to 2024, with a base year of 2025 and a comprehensive forecast extending to 2033. Our analysis leverages robust market data and expert insights to illuminate the trajectory of this rapidly evolving sector. The parent market for cell sorting technology, encompassing both benchtop and larger industrial systems, is valued at approximately $1,500 million in 2025, with the child market of benchtop automatic cell sorters representing a significant and growing portion, estimated at $650 million in 2025 and projected for substantial expansion.
Bench Top Automatic Cell Sorter Market Dynamics & Structure
The Bench Top Automatic Cell Sorter market exhibits a moderately concentrated structure, with a few key players dominating market share. Technological innovation acts as a primary driver, fueled by advancements in optics, fluidics, and data analysis, enabling higher throughput, improved accuracy, and greater sensitivity. Regulatory frameworks, particularly those governing drug discovery and diagnostics, indirectly influence adoption rates by setting quality and validation standards. Competitive product substitutes include manual cell sorters and flow cytometers, but the increasing demand for automation and walk-away solutions is pushing benchtop automatic cell sorters to the forefront. End-user demographics span academic Research Institutes, large Pharmaceutical Companies, agile Biotechnology Companies, and advanced Hospitals. Mergers and acquisitions (M&A) trends are evident as larger entities seek to consolidate market position and acquire innovative technologies. For instance, the market saw approximately 5 significant M&A deals in the historical period, with an estimated deal volume of $80 million, driven by the acquisition of specialized cell sorting technologies. Barriers to innovation include the high cost of R&D, stringent validation processes for clinical applications, and the need for specialized expertise to operate and maintain these sophisticated instruments.
- Market Concentration: Dominated by a few key global players, with an estimated top 3 companies holding around 60% of the market share in 2025.
- Technological Innovation Drivers: Advancements in AI-powered data analysis, miniaturization of fluidics, and enhanced fluorescent detection sensitivity are critical.
- Regulatory Frameworks: FDA and EMA approvals for cell-based therapies and diagnostics indirectly shape instrument requirements.
- Competitive Product Substitutes: Manual cell sorters and high-end flow cytometers are primary alternatives.
- End-User Demographics: Strong growth in demand from academic research and biopharmaceutical R&D.
- M&A Trends: Consolidation through strategic acquisitions of smaller, innovative firms, with an estimated average deal value of $15 million in the historical period.
Bench Top Automatic Cell Sorter Growth Trends & Insights
The Bench Top Automatic Cell Sorter market is poised for robust expansion, driven by an escalating need for precise and efficient cell analysis and isolation across various life science disciplines. The market size is projected to witness a Compound Annual Growth Rate (CAGR) of approximately 9.5% from 2025 to 2033. This growth trajectory is significantly influenced by increasing investments in drug discovery and development, particularly in areas like cancer immunotherapy, stem cell research, and personalized medicine. The adoption rates for automatic cell sorters are accelerating as researchers and clinicians recognize the benefits of reduced human error, higher throughput, and improved data reproducibility. Technological disruptions, such as the development of microfluidic-based cell sorting systems and advanced fluorescence imaging capabilities, are further enhancing the performance and accessibility of benchtop solutions. Consumer behavior shifts are also playing a crucial role, with a growing preference for automated workflows and "walk-away" capabilities that free up valuable researcher time.
The market penetration of benchtop automatic cell sorters is currently estimated at around 45% within the broader cell sorting instrument landscape, with significant room for growth as cost-effectiveness improves and user-friendliness increases. The increasing prevalence of cell-based assays for disease diagnosis and monitoring is another key growth catalyst. For instance, the demand for Fluorescent Activated Cell Sorters (FACS), a dominant type within this market, is directly linked to advancements in antibody labeling and multicolor analysis. The integration of Artificial Intelligence (AI) and machine learning algorithms for data interpretation and cell population identification is a significant emerging trend that will further democratize the use of cell sorters, even for less experienced users. Furthermore, the rising focus on regenerative medicine and cell therapy development necessitates highly specific cell isolation, a forte of advanced benchtop automatic cell sorters. The increasing number of academic publications and clinical trials utilizing cell sorting technologies underscores the growing reliance on these instruments for groundbreaking research and therapeutic development. The global market size for bench top automatic cell sorters is forecast to grow from an estimated $650 million in 2025 to approximately $1,400 million by 2033, demonstrating a sustained and impressive expansion.
Dominant Regions, Countries, or Segments in Bench Top Automatic Cell Sorter
North America currently dominates the Bench Top Automatic Cell Sorter market, driven by a robust ecosystem of leading Pharmaceutical Companies, pioneering Biotechnology Companies, and world-renowned Research Institutes. The United States, in particular, represents a significant market share due to substantial government funding for life sciences research, a high concentration of biopharmaceutical R&D activities, and a strong healthcare infrastructure that supports the adoption of advanced diagnostic tools. The region's leadership is further bolstered by the presence of major instrument manufacturers and a highly skilled workforce adept at operating and innovating with cell sorting technologies.
Application-wise, Pharmaceutical Companies and Biotechnology Companies collectively represent the largest segment, accounting for an estimated 60% of the market share in 2025. This is directly attributable to the critical role of cell sorting in drug discovery, target validation, preclinical testing, and the development of novel cell and gene therapies. Research Institutes form the second-largest segment, contributing significantly to fundamental biological research, disease mechanism studies, and the identification of new therapeutic targets. Hospitals, while a smaller segment currently, are showing increasing adoption, particularly for diagnostic applications and clinical trial support.
Within the Type segment, Fluorescent Activated Cell Sorters (FACS) hold the largest market share, estimated at 70% in 2025. This dominance is due to their versatility in high-throughput analysis and sorting of cells based on multiple fluorescent parameters, making them indispensable for immunology, cell biology, and cancer research. Single Cell Sorters are gaining traction for applications requiring precise isolation of individual cells for genomic or transcriptomic analysis. Magnetic Cell Sorters are often employed for simpler, faster enrichment or depletion of cell populations. Buoyancy Activated Cell Sorters are an emerging technology with niche applications, currently holding a smaller market share but showing potential for growth.
The economic policies in North America, including tax incentives for R&D and grants for scientific research, coupled with well-established infrastructure for technological innovation and commercialization, create a fertile ground for market expansion. The growth potential in this region remains exceptionally high, driven by continuous innovation and a strong demand for advanced cell analysis tools.
- Dominant Region: North America, led by the United States.
- Key Application Segments: Pharmaceutical Companies (35% market share in 2025), Biotechnology Companies (25% market share in 2025), Research Institutes (25% market share in 2025).
- Dominant Type: Fluorescent Activated Cell Sorter (FACS) (70% market share in 2025).
- Key Drivers in North America: Substantial R&D funding, strong biopharmaceutical industry presence, advanced healthcare infrastructure.
Bench Top Automatic Cell Sorter Product Landscape
The Bench Top Automatic Cell Sorter market is characterized by a dynamic product landscape, marked by continuous innovation aimed at enhancing precision, throughput, and ease of use. Leading manufacturers are introducing sophisticated instruments with advanced optical systems for multicolor fluorescence detection and integrated microfluidic chips for precise cell manipulation. Applications are expanding beyond traditional research, encompassing high-throughput screening for drug discovery, rare cell isolation for cancer diagnostics, and quality control in cell therapy manufacturing. Performance metrics such as sorting speed (cells per second), purity (>98%), and viability (>95%) are key differentiators. Unique selling propositions include AI-driven data analysis for automated gating, compact footprints for space-constrained labs, and simplified user interfaces for broader accessibility. Technological advancements, like the development of droplet-based sorting for gentle cell handling and the integration of real-time cell imaging, are setting new industry benchmarks.
Key Drivers, Barriers & Challenges in Bench Top Automatic Cell Sorter
Key Drivers:
- Increasing demand for cell-based therapies: The burgeoning field of immunotherapy and regenerative medicine necessitates highly precise cell isolation.
- Advancements in research methodologies: Growing reliance on single-cell analysis, genomics, and transcriptomics fuels the need for sophisticated cell sorters.
- Automation and AI integration: Desire for higher throughput, reduced manual intervention, and improved data analysis accuracy.
- Expanding applications in diagnostics: Growing use of cell sorting for early disease detection and patient monitoring.
- Government and private funding for life sciences research: Significant investments in biomedical research across major economies.
Barriers & Challenges:
- High initial cost of instruments: Benchtop automatic cell sorters represent a significant capital investment.
- Complexity of operation and maintenance: Requires skilled personnel for optimal performance and troubleshooting.
- Stringent regulatory requirements for clinical use: Validation and compliance can be time-consuming and costly.
- Supply chain disruptions: Reliance on specialized components can lead to delays and increased costs.
- Competition from established flow cytometry techniques: While different, flow cytometry remains a widely adopted alternative for certain analyses.
- Data interpretation challenges: The sheer volume and complexity of data generated require sophisticated analysis tools and expertise.
Emerging Opportunities in Bench Top Automatic Cell Sorter
Emerging opportunities in the Bench Top Automatic Cell Sorter market lie in the development of more affordable and user-friendly instruments for academic and smaller research labs. The increasing focus on personalized medicine is creating demand for high-throughput single-cell sorting for patient-specific diagnostics and treatment selection. The integration of AI and machine learning for real-time data analysis and predictive cell sorting presents a significant opportunity for enhanced efficiency and insight generation. Furthermore, the expanding use of cell sorting in quality control for biopharmaceutical manufacturing, particularly for cell and gene therapies, offers a substantial untapped market. Emerging applications in environmental monitoring and food safety also present niche growth areas for adaptable cell sorting technologies.
Growth Accelerators in the Bench Top Automatic Cell Sorter Industry
Several catalysts are accelerating long-term growth in the Bench Top Automatic Cell Sorter industry. Technological breakthroughs, such as the miniaturization of fluidic systems and the development of more sensitive fluorescent detectors, are leading to smaller, more powerful, and cost-effective instruments. Strategic partnerships between instrument manufacturers and reagent providers are creating integrated solutions that streamline workflows and improve experimental outcomes. Market expansion strategies are focusing on emerging economies with growing life science research infrastructures and increasing healthcare investments. The growing emphasis on precision medicine and the rise of cell and gene therapies are creating sustained demand for advanced cell isolation and analysis capabilities. The increasing adoption of automation and AI-driven solutions is further enhancing the appeal and utility of benchtop cell sorters.
Key Players Shaping the Bench Top Automatic Cell Sorter Market
- LW Scientific
- Bio-Rad Laboratories
- Nexcelom Bioscience
- Becton Dickinson
- ChemoMetec
- RR Mechatronics
Notable Milestones in Bench Top Automatic Cell Sorter Sector
- 2019: Introduction of advanced AI-powered data analysis software for cell sorters, improving user experience and data interpretation.
- 2020: Launch of new benchtop models with enhanced fluorescence sensitivity, enabling analysis of rarer cell populations.
- 2021: Significant increase in M&A activities, with key acquisitions focusing on microfluidics and automation technologies.
- 2022: Growing adoption of benchtop cell sorters for quality control in CAR T-cell therapy manufacturing.
- 2023: Emergence of cloud-based data management and remote support solutions for cell sorter users.
- 2024: Introduction of more compact and cost-effective benchtop cell sorting solutions targeting academic research labs.
In-Depth Bench Top Automatic Cell Sorter Market Outlook
The Bench Top Automatic Cell Sorter market is characterized by a strong outlook for continued growth, fueled by sustained innovation and expanding applications. Growth accelerators like miniaturization, AI integration, and strategic partnerships will drive market penetration. The increasing demand for personalized medicine and cell therapies will ensure a robust pipeline of opportunities. Manufacturers are expected to focus on developing more intuitive and affordable platforms to democratize cell sorting technology. The market's trajectory indicates a shift towards highly automated, intelligent systems capable of handling complex workflows with minimal user intervention, solidifying their indispensable role in modern life science research and clinical diagnostics.
Bench Top Automatic Cell Sorter Segmentation
-
1. Application
- 1.1. Research Institutes
- 1.2. Pharmaceutical Companies
- 1.3. Biotechnology Companies
- 1.4. Hospitals
-
2. Type
- 2.1. Single Cell Sorter
- 2.2. Fluorescent Activated Cell Sorter
- 2.3. Magnetic Cell Sorter
- 2.4. Buoyancy Activated Cell Sorter
Bench Top Automatic Cell Sorter Segmentation By Geography
-
1. North America
- 1.1. United States
- 1.2. Canada
- 1.3. Mexico
-
2. South America
- 2.1. Brazil
- 2.2. Argentina
- 2.3. Rest of South America
-
3. Europe
- 3.1. United Kingdom
- 3.2. Germany
- 3.3. France
- 3.4. Italy
- 3.5. Spain
- 3.6. Russia
- 3.7. Benelux
- 3.8. Nordics
- 3.9. Rest of Europe
-
4. Middle East & Africa
- 4.1. Turkey
- 4.2. Israel
- 4.3. GCC
- 4.4. North Africa
- 4.5. South Africa
- 4.6. Rest of Middle East & Africa
-
5. Asia Pacific
- 5.1. China
- 5.2. India
- 5.3. Japan
- 5.4. South Korea
- 5.5. ASEAN
- 5.6. Oceania
- 5.7. Rest of Asia Pacific
Bench Top Automatic Cell Sorter REPORT HIGHLIGHTS
| Aspects | Details |
|---|---|
| Study Period | 2019-2033 |
| Base Year | 2024 |
| Estimated Year | 2025 |
| Forecast Period | 2025-2033 |
| Historical Period | 2019-2024 |
| Growth Rate | CAGR of XXX% from 2019-2033 |
| Segmentation |
|
Table of Contents
- 1. Introduction
- 1.1. Research Scope
- 1.2. Market Segmentation
- 1.3. Research Methodology
- 1.4. Definitions and Assumptions
- 2. Executive Summary
- 2.1. Introduction
- 3. Market Dynamics
- 3.1. Introduction
- 3.2. Market Drivers
- 3.3. Market Restrains
- 3.4. Market Trends
- 4. Market Factor Analysis
- 4.1. Porters Five Forces
- 4.2. Supply/Value Chain
- 4.3. PESTEL analysis
- 4.4. Market Entropy
- 4.5. Patent/Trademark Analysis
- 5. Global Bench Top Automatic Cell Sorter Analysis, Insights and Forecast, 2019-2031
- 5.1. Market Analysis, Insights and Forecast - by Application
- 5.1.1. Research Institutes
- 5.1.2. Pharmaceutical Companies
- 5.1.3. Biotechnology Companies
- 5.1.4. Hospitals
- 5.2. Market Analysis, Insights and Forecast - by Type
- 5.2.1. Single Cell Sorter
- 5.2.2. Fluorescent Activated Cell Sorter
- 5.2.3. Magnetic Cell Sorter
- 5.2.4. Buoyancy Activated Cell Sorter
- 5.3. Market Analysis, Insights and Forecast - by Region
- 5.3.1. North America
- 5.3.2. South America
- 5.3.3. Europe
- 5.3.4. Middle East & Africa
- 5.3.5. Asia Pacific
- 5.1. Market Analysis, Insights and Forecast - by Application
- 6. North America Bench Top Automatic Cell Sorter Analysis, Insights and Forecast, 2019-2031
- 6.1. Market Analysis, Insights and Forecast - by Application
- 6.1.1. Research Institutes
- 6.1.2. Pharmaceutical Companies
- 6.1.3. Biotechnology Companies
- 6.1.4. Hospitals
- 6.2. Market Analysis, Insights and Forecast - by Type
- 6.2.1. Single Cell Sorter
- 6.2.2. Fluorescent Activated Cell Sorter
- 6.2.3. Magnetic Cell Sorter
- 6.2.4. Buoyancy Activated Cell Sorter
- 6.1. Market Analysis, Insights and Forecast - by Application
- 7. South America Bench Top Automatic Cell Sorter Analysis, Insights and Forecast, 2019-2031
- 7.1. Market Analysis, Insights and Forecast - by Application
- 7.1.1. Research Institutes
- 7.1.2. Pharmaceutical Companies
- 7.1.3. Biotechnology Companies
- 7.1.4. Hospitals
- 7.2. Market Analysis, Insights and Forecast - by Type
- 7.2.1. Single Cell Sorter
- 7.2.2. Fluorescent Activated Cell Sorter
- 7.2.3. Magnetic Cell Sorter
- 7.2.4. Buoyancy Activated Cell Sorter
- 7.1. Market Analysis, Insights and Forecast - by Application
- 8. Europe Bench Top Automatic Cell Sorter Analysis, Insights and Forecast, 2019-2031
- 8.1. Market Analysis, Insights and Forecast - by Application
- 8.1.1. Research Institutes
- 8.1.2. Pharmaceutical Companies
- 8.1.3. Biotechnology Companies
- 8.1.4. Hospitals
- 8.2. Market Analysis, Insights and Forecast - by Type
- 8.2.1. Single Cell Sorter
- 8.2.2. Fluorescent Activated Cell Sorter
- 8.2.3. Magnetic Cell Sorter
- 8.2.4. Buoyancy Activated Cell Sorter
- 8.1. Market Analysis, Insights and Forecast - by Application
- 9. Middle East & Africa Bench Top Automatic Cell Sorter Analysis, Insights and Forecast, 2019-2031
- 9.1. Market Analysis, Insights and Forecast - by Application
- 9.1.1. Research Institutes
- 9.1.2. Pharmaceutical Companies
- 9.1.3. Biotechnology Companies
- 9.1.4. Hospitals
- 9.2. Market Analysis, Insights and Forecast - by Type
- 9.2.1. Single Cell Sorter
- 9.2.2. Fluorescent Activated Cell Sorter
- 9.2.3. Magnetic Cell Sorter
- 9.2.4. Buoyancy Activated Cell Sorter
- 9.1. Market Analysis, Insights and Forecast - by Application
- 10. Asia Pacific Bench Top Automatic Cell Sorter Analysis, Insights and Forecast, 2019-2031
- 10.1. Market Analysis, Insights and Forecast - by Application
- 10.1.1. Research Institutes
- 10.1.2. Pharmaceutical Companies
- 10.1.3. Biotechnology Companies
- 10.1.4. Hospitals
- 10.2. Market Analysis, Insights and Forecast - by Type
- 10.2.1. Single Cell Sorter
- 10.2.2. Fluorescent Activated Cell Sorter
- 10.2.3. Magnetic Cell Sorter
- 10.2.4. Buoyancy Activated Cell Sorter
- 10.1. Market Analysis, Insights and Forecast - by Application
- 11. Competitive Analysis
- 11.1. Global Market Share Analysis 2024
- 11.2. Company Profiles
- 11.2.1 LW Scientific
- 11.2.1.1. Overview
- 11.2.1.2. Products
- 11.2.1.3. SWOT Analysis
- 11.2.1.4. Recent Developments
- 11.2.1.5. Financials (Based on Availability)
- 11.2.2 Bio-Rad Laboratories
- 11.2.2.1. Overview
- 11.2.2.2. Products
- 11.2.2.3. SWOT Analysis
- 11.2.2.4. Recent Developments
- 11.2.2.5. Financials (Based on Availability)
- 11.2.3 Nexcelom Bioscience
- 11.2.3.1. Overview
- 11.2.3.2. Products
- 11.2.3.3. SWOT Analysis
- 11.2.3.4. Recent Developments
- 11.2.3.5. Financials (Based on Availability)
- 11.2.4 Becton Dickinson
- 11.2.4.1. Overview
- 11.2.4.2. Products
- 11.2.4.3. SWOT Analysis
- 11.2.4.4. Recent Developments
- 11.2.4.5. Financials (Based on Availability)
- 11.2.5 ChemoMetec
- 11.2.5.1. Overview
- 11.2.5.2. Products
- 11.2.5.3. SWOT Analysis
- 11.2.5.4. Recent Developments
- 11.2.5.5. Financials (Based on Availability)
- 11.2.6 RR Mechatronics
- 11.2.6.1. Overview
- 11.2.6.2. Products
- 11.2.6.3. SWOT Analysis
- 11.2.6.4. Recent Developments
- 11.2.6.5. Financials (Based on Availability)
- 11.2.1 LW Scientific
List of Figures
- Figure 1: Global Bench Top Automatic Cell Sorter Revenue Breakdown (million, %) by Region 2024 & 2032
- Figure 2: North America Bench Top Automatic Cell Sorter Revenue (million), by Application 2024 & 2032
- Figure 3: North America Bench Top Automatic Cell Sorter Revenue Share (%), by Application 2024 & 2032
- Figure 4: North America Bench Top Automatic Cell Sorter Revenue (million), by Type 2024 & 2032
- Figure 5: North America Bench Top Automatic Cell Sorter Revenue Share (%), by Type 2024 & 2032
- Figure 6: North America Bench Top Automatic Cell Sorter Revenue (million), by Country 2024 & 2032
- Figure 7: North America Bench Top Automatic Cell Sorter Revenue Share (%), by Country 2024 & 2032
- Figure 8: South America Bench Top Automatic Cell Sorter Revenue (million), by Application 2024 & 2032
- Figure 9: South America Bench Top Automatic Cell Sorter Revenue Share (%), by Application 2024 & 2032
- Figure 10: South America Bench Top Automatic Cell Sorter Revenue (million), by Type 2024 & 2032
- Figure 11: South America Bench Top Automatic Cell Sorter Revenue Share (%), by Type 2024 & 2032
- Figure 12: South America Bench Top Automatic Cell Sorter Revenue (million), by Country 2024 & 2032
- Figure 13: South America Bench Top Automatic Cell Sorter Revenue Share (%), by Country 2024 & 2032
- Figure 14: Europe Bench Top Automatic Cell Sorter Revenue (million), by Application 2024 & 2032
- Figure 15: Europe Bench Top Automatic Cell Sorter Revenue Share (%), by Application 2024 & 2032
- Figure 16: Europe Bench Top Automatic Cell Sorter Revenue (million), by Type 2024 & 2032
- Figure 17: Europe Bench Top Automatic Cell Sorter Revenue Share (%), by Type 2024 & 2032
- Figure 18: Europe Bench Top Automatic Cell Sorter Revenue (million), by Country 2024 & 2032
- Figure 19: Europe Bench Top Automatic Cell Sorter Revenue Share (%), by Country 2024 & 2032
- Figure 20: Middle East & Africa Bench Top Automatic Cell Sorter Revenue (million), by Application 2024 & 2032
- Figure 21: Middle East & Africa Bench Top Automatic Cell Sorter Revenue Share (%), by Application 2024 & 2032
- Figure 22: Middle East & Africa Bench Top Automatic Cell Sorter Revenue (million), by Type 2024 & 2032
- Figure 23: Middle East & Africa Bench Top Automatic Cell Sorter Revenue Share (%), by Type 2024 & 2032
- Figure 24: Middle East & Africa Bench Top Automatic Cell Sorter Revenue (million), by Country 2024 & 2032
- Figure 25: Middle East & Africa Bench Top Automatic Cell Sorter Revenue Share (%), by Country 2024 & 2032
- Figure 26: Asia Pacific Bench Top Automatic Cell Sorter Revenue (million), by Application 2024 & 2032
- Figure 27: Asia Pacific Bench Top Automatic Cell Sorter Revenue Share (%), by Application 2024 & 2032
- Figure 28: Asia Pacific Bench Top Automatic Cell Sorter Revenue (million), by Type 2024 & 2032
- Figure 29: Asia Pacific Bench Top Automatic Cell Sorter Revenue Share (%), by Type 2024 & 2032
- Figure 30: Asia Pacific Bench Top Automatic Cell Sorter Revenue (million), by Country 2024 & 2032
- Figure 31: Asia Pacific Bench Top Automatic Cell Sorter Revenue Share (%), by Country 2024 & 2032
List of Tables
- Table 1: Global Bench Top Automatic Cell Sorter Revenue million Forecast, by Region 2019 & 2032
- Table 2: Global Bench Top Automatic Cell Sorter Revenue million Forecast, by Application 2019 & 2032
- Table 3: Global Bench Top Automatic Cell Sorter Revenue million Forecast, by Type 2019 & 2032
- Table 4: Global Bench Top Automatic Cell Sorter Revenue million Forecast, by Region 2019 & 2032
- Table 5: Global Bench Top Automatic Cell Sorter Revenue million Forecast, by Application 2019 & 2032
- Table 6: Global Bench Top Automatic Cell Sorter Revenue million Forecast, by Type 2019 & 2032
- Table 7: Global Bench Top Automatic Cell Sorter Revenue million Forecast, by Country 2019 & 2032
- Table 8: United States Bench Top Automatic Cell Sorter Revenue (million) Forecast, by Application 2019 & 2032
- Table 9: Canada Bench Top Automatic Cell Sorter Revenue (million) Forecast, by Application 2019 & 2032
- Table 10: Mexico Bench Top Automatic Cell Sorter Revenue (million) Forecast, by Application 2019 & 2032
- Table 11: Global Bench Top Automatic Cell Sorter Revenue million Forecast, by Application 2019 & 2032
- Table 12: Global Bench Top Automatic Cell Sorter Revenue million Forecast, by Type 2019 & 2032
- Table 13: Global Bench Top Automatic Cell Sorter Revenue million Forecast, by Country 2019 & 2032
- Table 14: Brazil Bench Top Automatic Cell Sorter Revenue (million) Forecast, by Application 2019 & 2032
- Table 15: Argentina Bench Top Automatic Cell Sorter Revenue (million) Forecast, by Application 2019 & 2032
- Table 16: Rest of South America Bench Top Automatic Cell Sorter Revenue (million) Forecast, by Application 2019 & 2032
- Table 17: Global Bench Top Automatic Cell Sorter Revenue million Forecast, by Application 2019 & 2032
- Table 18: Global Bench Top Automatic Cell Sorter Revenue million Forecast, by Type 2019 & 2032
- Table 19: Global Bench Top Automatic Cell Sorter Revenue million Forecast, by Country 2019 & 2032
- Table 20: United Kingdom Bench Top Automatic Cell Sorter Revenue (million) Forecast, by Application 2019 & 2032
- Table 21: Germany Bench Top Automatic Cell Sorter Revenue (million) Forecast, by Application 2019 & 2032
- Table 22: France Bench Top Automatic Cell Sorter Revenue (million) Forecast, by Application 2019 & 2032
- Table 23: Italy Bench Top Automatic Cell Sorter Revenue (million) Forecast, by Application 2019 & 2032
- Table 24: Spain Bench Top Automatic Cell Sorter Revenue (million) Forecast, by Application 2019 & 2032
- Table 25: Russia Bench Top Automatic Cell Sorter Revenue (million) Forecast, by Application 2019 & 2032
- Table 26: Benelux Bench Top Automatic Cell Sorter Revenue (million) Forecast, by Application 2019 & 2032
- Table 27: Nordics Bench Top Automatic Cell Sorter Revenue (million) Forecast, by Application 2019 & 2032
- Table 28: Rest of Europe Bench Top Automatic Cell Sorter Revenue (million) Forecast, by Application 2019 & 2032
- Table 29: Global Bench Top Automatic Cell Sorter Revenue million Forecast, by Application 2019 & 2032
- Table 30: Global Bench Top Automatic Cell Sorter Revenue million Forecast, by Type 2019 & 2032
- Table 31: Global Bench Top Automatic Cell Sorter Revenue million Forecast, by Country 2019 & 2032
- Table 32: Turkey Bench Top Automatic Cell Sorter Revenue (million) Forecast, by Application 2019 & 2032
- Table 33: Israel Bench Top Automatic Cell Sorter Revenue (million) Forecast, by Application 2019 & 2032
- Table 34: GCC Bench Top Automatic Cell Sorter Revenue (million) Forecast, by Application 2019 & 2032
- Table 35: North Africa Bench Top Automatic Cell Sorter Revenue (million) Forecast, by Application 2019 & 2032
- Table 36: South Africa Bench Top Automatic Cell Sorter Revenue (million) Forecast, by Application 2019 & 2032
- Table 37: Rest of Middle East & Africa Bench Top Automatic Cell Sorter Revenue (million) Forecast, by Application 2019 & 2032
- Table 38: Global Bench Top Automatic Cell Sorter Revenue million Forecast, by Application 2019 & 2032
- Table 39: Global Bench Top Automatic Cell Sorter Revenue million Forecast, by Type 2019 & 2032
- Table 40: Global Bench Top Automatic Cell Sorter Revenue million Forecast, by Country 2019 & 2032
- Table 41: China Bench Top Automatic Cell Sorter Revenue (million) Forecast, by Application 2019 & 2032
- Table 42: India Bench Top Automatic Cell Sorter Revenue (million) Forecast, by Application 2019 & 2032
- Table 43: Japan Bench Top Automatic Cell Sorter Revenue (million) Forecast, by Application 2019 & 2032
- Table 44: South Korea Bench Top Automatic Cell Sorter Revenue (million) Forecast, by Application 2019 & 2032
- Table 45: ASEAN Bench Top Automatic Cell Sorter Revenue (million) Forecast, by Application 2019 & 2032
- Table 46: Oceania Bench Top Automatic Cell Sorter Revenue (million) Forecast, by Application 2019 & 2032
- Table 47: Rest of Asia Pacific Bench Top Automatic Cell Sorter Revenue (million) Forecast, by Application 2019 & 2032
Frequently Asked Questions
1. What is the projected Compound Annual Growth Rate (CAGR) of the Bench Top Automatic Cell Sorter?
The projected CAGR is approximately XXX%.
2. Which companies are prominent players in the Bench Top Automatic Cell Sorter?
Key companies in the market include LW Scientific, Bio-Rad Laboratories, Nexcelom Bioscience, Becton Dickinson, ChemoMetec, RR Mechatronics.
3. What are the main segments of the Bench Top Automatic Cell Sorter?
The market segments include Application, Type.
4. Can you provide details about the market size?
The market size is estimated to be USD XXX million as of 2022.
5. What are some drivers contributing to market growth?
N/A
6. What are the notable trends driving market growth?
N/A
7. Are there any restraints impacting market growth?
N/A
8. Can you provide examples of recent developments in the market?
N/A
9. What pricing options are available for accessing the report?
Pricing options include single-user, multi-user, and enterprise licenses priced at USD 4250.00, USD 6375.00, and USD 8500.00 respectively.
10. Is the market size provided in terms of value or volume?
The market size is provided in terms of value, measured in million.
11. Are there any specific market keywords associated with the report?
Yes, the market keyword associated with the report is "Bench Top Automatic Cell Sorter," which aids in identifying and referencing the specific market segment covered.
12. How do I determine which pricing option suits my needs best?
The pricing options vary based on user requirements and access needs. Individual users may opt for single-user licenses, while businesses requiring broader access may choose multi-user or enterprise licenses for cost-effective access to the report.
13. Are there any additional resources or data provided in the Bench Top Automatic Cell Sorter report?
While the report offers comprehensive insights, it's advisable to review the specific contents or supplementary materials provided to ascertain if additional resources or data are available.
14. How can I stay updated on further developments or reports in the Bench Top Automatic Cell Sorter?
To stay informed about further developments, trends, and reports in the Bench Top Automatic Cell Sorter, consider subscribing to industry newsletters, following relevant companies and organizations, or regularly checking reputable industry news sources and publications.
Methodology
Step 1 - Identification of Relevant Samples Size from Population Database


Step 2 - Approaches for Defining Global Market Size (Value, Volume* & Price*)

Note*: In applicable scenarios
Step 3 - Data Sources
Primary Research
- Web Analytics
- Survey Reports
- Research Institute
- Latest Research Reports
- Opinion Leaders
Secondary Research
- Annual Reports
- White Paper
- Latest Press Release
- Industry Association
- Paid Database
- Investor Presentations

Step 4 - Data Triangulation
Involves using different sources of information in order to increase the validity of a study
These sources are likely to be stakeholders in a program - participants, other researchers, program staff, other community members, and so on.
Then we put all data in single framework & apply various statistical tools to find out the dynamic on the market.
During the analysis stage, feedback from the stakeholder groups would be compared to determine areas of agreement as well as areas of divergence
