

Key Insights
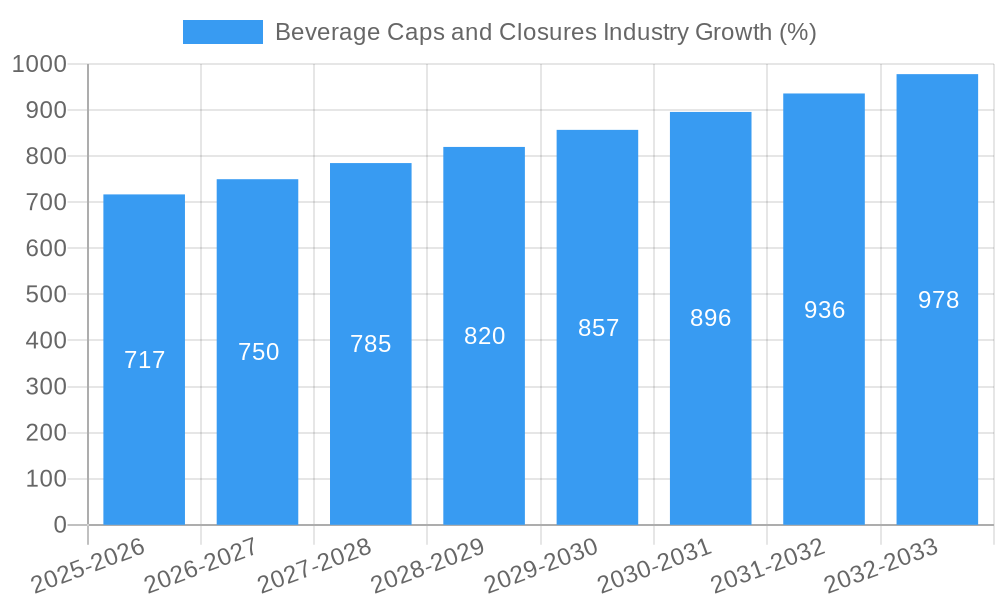
The global beverage caps and closures market is a dynamic sector experiencing steady growth, projected at a 4.54% CAGR from 2025 to 2033. This expansion is driven by several key factors. The increasing demand for convenient and tamper-evident packaging solutions across various beverage types, including carbonated soft drinks, juices, bottled water, and alcoholic beverages, is a significant driver. Consumer preference for sustainable and eco-friendly packaging materials, such as recycled plastics and bio-based alternatives, is also fueling market growth. Furthermore, technological advancements in closure design, incorporating features like resealable caps and improved tamper-evidence mechanisms, are enhancing product appeal and driving adoption. Regional growth is expected to vary, with developing economies in Asia-Pacific anticipated to demonstrate robust growth due to increasing consumption and rising disposable incomes. However, fluctuating raw material prices and stringent regulatory compliance requirements pose challenges to market expansion. The market is segmented by material type, with metal, plastic, and other materials (rubber, cork) competing for market share. Metal closures maintain a strong position due to their durability and tamper-evident properties, while plastic closures dominate due to cost-effectiveness and versatility. The “other materials” segment holds a niche market, primarily catering to specialized beverage types. Leading players, including Aptar Group Inc., Tetra Laval International, Pact Group, and others, are actively engaged in research and development to innovate and offer advanced solutions catering to evolving consumer demands and environmental concerns.
The competitive landscape is marked by both established multinational corporations and regional players. These companies are employing various strategies such as strategic partnerships, mergers and acquisitions, and product diversification to strengthen their market position and expand their reach. The market's future trajectory will be significantly influenced by consumer preferences regarding sustainability, the introduction of innovative closure technologies, and the overall economic conditions in key regions. Given the anticipated growth in the beverage industry, particularly in emerging markets, the demand for beverage caps and closures is projected to remain strong throughout the forecast period. However, manufacturers will need to adapt to changing regulations and consumer preferences to ensure long-term success in this competitive market. The market size in 2025 is estimated to be around $XX Billion (this value needs to be provided to accurately complete this analysis). Assuming a constant CAGR, the value can be projected for future years.

Beverage Caps and Closures Industry Market Report: 2019-2033
This comprehensive report provides an in-depth analysis of the global beverage caps and closures market, encompassing market dynamics, growth trends, regional insights, competitive landscape, and future outlook. The study covers the period 2019-2033, with 2025 as the base year and forecasts extending to 2033. The report segments the market by material (metal, plastic, other materials – rubber, cork) providing a granular understanding of the industry's structure and future trajectory. Market size is presented in million units.
Beverage Caps and Closures Industry Market Dynamics & Structure
The beverage caps and closures market is characterized by moderate concentration, with key players holding significant market shares. Technological innovation, particularly in sustainable materials and closure designs, is a key driver. Stringent regulatory frameworks concerning material safety and recyclability influence market dynamics. Competition from substitute products, such as alternative packaging solutions, presents a challenge. End-user demographics, specifically shifting consumer preferences towards sustainability and convenience, are shaping demand. The market has witnessed several mergers and acquisitions (M&A) in recent years, indicating consolidation and growth strategies.
- Market Concentration: Highly concentrated, with top 10 players holding approximately xx% market share in 2025.
- Technological Innovation: Focus on lightweighting, recyclability, and tamper-evident features.
- Regulatory Landscape: Stringent regulations on material safety and recyclability across different regions.
- Competitive Substitutes: Growing competition from alternative packaging materials and closure technologies.
- M&A Activity: xx major M&A deals in the last five years, indicating industry consolidation.
- Innovation Barriers: High R&D costs and regulatory compliance requirements hinder innovation.
Beverage Caps and Closures Industry Growth Trends & Insights
The global beverage caps and closures market experienced significant growth between 2019 and 2024, driven by factors including rising beverage consumption, particularly in emerging economies, and increasing demand for convenient packaging. The market size reached xx million units in 2024, registering a CAGR of xx% during the historical period. Technological disruptions, such as the adoption of sustainable materials and smart closures, are further accelerating market growth. Consumer preference shifts towards eco-friendly options are influencing product development and demand. The forecast period (2025-2033) projects continued growth, with a projected CAGR of xx%, driven by expanding beverage markets and technological advancements. Market penetration of sustainable materials is expected to increase significantly.
Dominant Regions, Countries, or Segments in Beverage Caps and Closures Industry
The North American region currently holds a dominant position in the beverage caps and closures market, followed by Europe and Asia-Pacific. Within materials, plastic caps currently dominate, owing to their cost-effectiveness and versatility. However, growing environmental concerns are driving a shift towards sustainable materials like metal and bio-based plastics.
- North America: High beverage consumption, advanced packaging technology, and strong regulatory frameworks contribute to its dominance.
- Europe: Stringent environmental regulations are driving innovation in sustainable materials.
- Asia-Pacific: Rapid economic growth and increasing beverage consumption fuel market expansion.
- Plastic Segment: Cost-effectiveness and wide applicability drive its current market leadership.
- Metal Segment: Growing demand for recyclable and premium packaging options is boosting its growth.
- Other Materials (Rubber, Cork): Niche applications in specialty beverages contribute to market share.
Beverage Caps and Closures Industry Product Landscape
The beverage caps and closures market offers a wide range of products catering to diverse beverage types and consumer preferences. Innovations focus on improved functionality, enhanced sustainability, and enhanced consumer experience. Products are designed with features like tamper evidence, resealability, and ease of opening, along with growing focus on recyclability and biodegradability. Technological advancements encompass smart closures with integrated sensors for tracking and authentication.
Key Drivers, Barriers & Challenges in Beverage Caps and Closures Industry
Key Drivers: Increasing beverage consumption globally, rising demand for convenient packaging, technological advancements in materials and closure designs, and stringent regulations promoting sustainable packaging.
Challenges: Fluctuating raw material prices, intense competition, concerns about plastic pollution and environmental sustainability, and supply chain disruptions. The impact of these challenges could reduce overall market growth by an estimated xx% in the forecast period if not addressed effectively.
Emerging Opportunities in Beverage Caps and Closures Industry
Emerging opportunities lie in the development and adoption of sustainable and recyclable materials, smart closures with integrated technologies, and personalized caps. Untapped markets in developing economies represent significant growth potential. Growing consumer demand for eco-friendly and convenient packaging solutions drives innovation and offers lucrative opportunities.
Growth Accelerators in the Beverage Caps and Closures Industry
Long-term growth in the beverage caps and closures industry will be driven by strategic partnerships focusing on material innovation and sustainable solutions. Technological breakthroughs in smart closures and improved recycling technologies will also accelerate market expansion. Furthermore, geographic expansion into emerging markets and increased adoption of sustainable packaging materials will contribute significantly to long-term growth.
Key Players Shaping the Beverage Caps and Closures Industry Market
- Aptar Group Inc
- Tetra Laval International
- Pact Group
- Ball Corporation
- Global Closure Systems
- Bericap GmbH & Co KG
- Guala Closures Group
- Crown Holdings Inc
- Albea Group
- Evergreen Packaging Inc
- Berry Global Inc
- Silgan Holdings Inc
- Amcor Ltd
Notable Milestones in Beverage Caps and Closures Industry Sector
- 2021-Q3: Berry Global launched a new range of recycled PET beverage closures.
- 2022-Q1: Amcor and Aptar announced a strategic partnership focusing on sustainable packaging solutions.
- 2023-Q2: Crown Holdings introduced a new tamper-evident closure designed for enhanced security. (Further milestones to be added based on data)
In-Depth Beverage Caps and Closures Industry Market Outlook
The future of the beverage caps and closures market is bright, driven by strong growth in beverage consumption, technological innovations in sustainable packaging, and expanding demand for convenience and functionality. Strategic partnerships, mergers and acquisitions, and a focus on sustainability will shape the market landscape in the coming years. The market is expected to witness a sustained period of growth, with significant opportunities for companies that can effectively address consumer preferences for eco-friendly and innovative solutions.
Beverage Caps and Closures Industry Segmentation
-
1. Material
- 1.1. Metal
- 1.2. Plastic
- 1.3. Other Materials (Rubber, Cork)
Beverage Caps and Closures Industry Segmentation By Geography
-
1. North America
- 1.1. US
- 1.2. Canada
-
2. Europe
- 2.1. Germany
- 2.2. UK
- 2.3. France
- 2.4. Rest of Europe
-
3. Asia Pacific
- 3.1. China
- 3.2. Japan
- 3.3. India
- 3.4. Rest of Asia Pacific
-
4. Latin America
- 4.1. Brazil
- 4.2. Mexico
- 4.3. Rest of Latin America
-
5. Middle East and Africa
- 5.1. UAE
- 5.2. Saudi Arabia
- 5.3. South Africa
- 5.4. Rest of Middle East

Beverage Caps and Closures Industry REPORT HIGHLIGHTS
| Aspects | Details |
|---|---|
| Study Period | 2019-2033 |
| Base Year | 2024 |
| Estimated Year | 2025 |
| Forecast Period | 2025-2033 |
| Historical Period | 2019-2024 |
| Growth Rate | CAGR of 4.54% from 2019-2033 |
| Segmentation |
|
Table of Contents
- 1. Introduction
- 1.1. Research Scope
- 1.2. Market Segmentation
- 1.3. Research Methodology
- 1.4. Definitions and Assumptions
- 2. Executive Summary
- 2.1. Introduction
- 3. Market Dynamics
- 3.1. Introduction
- 3.2. Market Drivers
- 3.2.1. ; Increasing Beverage Consumption in Developing Economies; Technological Advancements and Innovative Packaging Solutions
- 3.3. Market Restrains
- 3.3.1. ; Stringent Regulations on the Usage of Plastic Bottles
- 3.4. Market Trends
- 3.4.1. Plastic is Expected to Experience a Significant Market Share
- 4. Market Factor Analysis
- 4.1. Porters Five Forces
- 4.2. Supply/Value Chain
- 4.3. PESTEL analysis
- 4.4. Market Entropy
- 4.5. Patent/Trademark Analysis
- 5. Global Beverage Caps and Closures Industry Analysis, Insights and Forecast, 2019-2031
- 5.1. Market Analysis, Insights and Forecast - by Material
- 5.1.1. Metal
- 5.1.2. Plastic
- 5.1.3. Other Materials (Rubber, Cork)
- 5.2. Market Analysis, Insights and Forecast - by Region
- 5.2.1. North America
- 5.2.2. Europe
- 5.2.3. Asia Pacific
- 5.2.4. Latin America
- 5.2.5. Middle East and Africa
- 5.1. Market Analysis, Insights and Forecast - by Material
- 6. North America Beverage Caps and Closures Industry Analysis, Insights and Forecast, 2019-2031
- 6.1. Market Analysis, Insights and Forecast - by Material
- 6.1.1. Metal
- 6.1.2. Plastic
- 6.1.3. Other Materials (Rubber, Cork)
- 6.1. Market Analysis, Insights and Forecast - by Material
- 7. Europe Beverage Caps and Closures Industry Analysis, Insights and Forecast, 2019-2031
- 7.1. Market Analysis, Insights and Forecast - by Material
- 7.1.1. Metal
- 7.1.2. Plastic
- 7.1.3. Other Materials (Rubber, Cork)
- 7.1. Market Analysis, Insights and Forecast - by Material
- 8. Asia Pacific Beverage Caps and Closures Industry Analysis, Insights and Forecast, 2019-2031
- 8.1. Market Analysis, Insights and Forecast - by Material
- 8.1.1. Metal
- 8.1.2. Plastic
- 8.1.3. Other Materials (Rubber, Cork)
- 8.1. Market Analysis, Insights and Forecast - by Material
- 9. Latin America Beverage Caps and Closures Industry Analysis, Insights and Forecast, 2019-2031
- 9.1. Market Analysis, Insights and Forecast - by Material
- 9.1.1. Metal
- 9.1.2. Plastic
- 9.1.3. Other Materials (Rubber, Cork)
- 9.1. Market Analysis, Insights and Forecast - by Material
- 10. Middle East and Africa Beverage Caps and Closures Industry Analysis, Insights and Forecast, 2019-2031
- 10.1. Market Analysis, Insights and Forecast - by Material
- 10.1.1. Metal
- 10.1.2. Plastic
- 10.1.3. Other Materials (Rubber, Cork)
- 10.1. Market Analysis, Insights and Forecast - by Material
- 11. North America Beverage Caps and Closures Industry Analysis, Insights and Forecast, 2019-2031
- 11.1. Market Analysis, Insights and Forecast - By Country/Sub-region
- 11.1.1 US
- 11.1.2 Canada
- 12. Europe Beverage Caps and Closures Industry Analysis, Insights and Forecast, 2019-2031
- 12.1. Market Analysis, Insights and Forecast - By Country/Sub-region
- 12.1.1 Germany
- 12.1.2 UK
- 12.1.3 France
- 12.1.4 Rest of Europe
- 13. Asia Pacific Beverage Caps and Closures Industry Analysis, Insights and Forecast, 2019-2031
- 13.1. Market Analysis, Insights and Forecast - By Country/Sub-region
- 13.1.1 China
- 13.1.2 Japan
- 13.1.3 India
- 13.1.4 Rest of Asia Pacific
- 14. Latin America Beverage Caps and Closures Industry Analysis, Insights and Forecast, 2019-2031
- 14.1. Market Analysis, Insights and Forecast - By Country/Sub-region
- 14.1.1 Brazil
- 14.1.2 Mexico
- 14.1.3 Rest of Latin America
- 15. Middle East and Africa Beverage Caps and Closures Industry Analysis, Insights and Forecast, 2019-2031
- 15.1. Market Analysis, Insights and Forecast - By Country/Sub-region
- 15.1.1 UAE
- 15.1.2 Saudi Arabia
- 15.1.3 South Africa
- 15.1.4 Rest of Middle East
- 16. Competitive Analysis
- 16.1. Global Market Share Analysis 2024
- 16.2. Company Profiles
- 16.2.1 Aptar Group Inc
- 16.2.1.1. Overview
- 16.2.1.2. Products
- 16.2.1.3. SWOT Analysis
- 16.2.1.4. Recent Developments
- 16.2.1.5. Financials (Based on Availability)
- 16.2.2 Tetra Laval International*List Not Exhaustive
- 16.2.2.1. Overview
- 16.2.2.2. Products
- 16.2.2.3. SWOT Analysis
- 16.2.2.4. Recent Developments
- 16.2.2.5. Financials (Based on Availability)
- 16.2.3 Pact Group
- 16.2.3.1. Overview
- 16.2.3.2. Products
- 16.2.3.3. SWOT Analysis
- 16.2.3.4. Recent Developments
- 16.2.3.5. Financials (Based on Availability)
- 16.2.4 Ball Corporation
- 16.2.4.1. Overview
- 16.2.4.2. Products
- 16.2.4.3. SWOT Analysis
- 16.2.4.4. Recent Developments
- 16.2.4.5. Financials (Based on Availability)
- 16.2.5 Global Closure Systems
- 16.2.5.1. Overview
- 16.2.5.2. Products
- 16.2.5.3. SWOT Analysis
- 16.2.5.4. Recent Developments
- 16.2.5.5. Financials (Based on Availability)
- 16.2.6 Bericap GmbH & Co KG
- 16.2.6.1. Overview
- 16.2.6.2. Products
- 16.2.6.3. SWOT Analysis
- 16.2.6.4. Recent Developments
- 16.2.6.5. Financials (Based on Availability)
- 16.2.7 Guala Closures Group
- 16.2.7.1. Overview
- 16.2.7.2. Products
- 16.2.7.3. SWOT Analysis
- 16.2.7.4. Recent Developments
- 16.2.7.5. Financials (Based on Availability)
- 16.2.8 Crown Holdings Inc
- 16.2.8.1. Overview
- 16.2.8.2. Products
- 16.2.8.3. SWOT Analysis
- 16.2.8.4. Recent Developments
- 16.2.8.5. Financials (Based on Availability)
- 16.2.9 Albea Group
- 16.2.9.1. Overview
- 16.2.9.2. Products
- 16.2.9.3. SWOT Analysis
- 16.2.9.4. Recent Developments
- 16.2.9.5. Financials (Based on Availability)
- 16.2.10 Evergreen Packaging Inc
- 16.2.10.1. Overview
- 16.2.10.2. Products
- 16.2.10.3. SWOT Analysis
- 16.2.10.4. Recent Developments
- 16.2.10.5. Financials (Based on Availability)
- 16.2.11 Berry Global Inc
- 16.2.11.1. Overview
- 16.2.11.2. Products
- 16.2.11.3. SWOT Analysis
- 16.2.11.4. Recent Developments
- 16.2.11.5. Financials (Based on Availability)
- 16.2.12 Silgan Holdings Inc
- 16.2.12.1. Overview
- 16.2.12.2. Products
- 16.2.12.3. SWOT Analysis
- 16.2.12.4. Recent Developments
- 16.2.12.5. Financials (Based on Availability)
- 16.2.13 Amcor Ltd
- 16.2.13.1. Overview
- 16.2.13.2. Products
- 16.2.13.3. SWOT Analysis
- 16.2.13.4. Recent Developments
- 16.2.13.5. Financials (Based on Availability)
- 16.2.1 Aptar Group Inc
List of Figures
- Figure 1: Global Beverage Caps and Closures Industry Revenue Breakdown (Million, %) by Region 2024 & 2032
- Figure 2: North America Beverage Caps and Closures Industry Revenue (Million), by Country 2024 & 2032
- Figure 3: North America Beverage Caps and Closures Industry Revenue Share (%), by Country 2024 & 2032
- Figure 4: Europe Beverage Caps and Closures Industry Revenue (Million), by Country 2024 & 2032
- Figure 5: Europe Beverage Caps and Closures Industry Revenue Share (%), by Country 2024 & 2032
- Figure 6: Asia Pacific Beverage Caps and Closures Industry Revenue (Million), by Country 2024 & 2032
- Figure 7: Asia Pacific Beverage Caps and Closures Industry Revenue Share (%), by Country 2024 & 2032
- Figure 8: Latin America Beverage Caps and Closures Industry Revenue (Million), by Country 2024 & 2032
- Figure 9: Latin America Beverage Caps and Closures Industry Revenue Share (%), by Country 2024 & 2032
- Figure 10: Middle East and Africa Beverage Caps and Closures Industry Revenue (Million), by Country 2024 & 2032
- Figure 11: Middle East and Africa Beverage Caps and Closures Industry Revenue Share (%), by Country 2024 & 2032
- Figure 12: North America Beverage Caps and Closures Industry Revenue (Million), by Material 2024 & 2032
- Figure 13: North America Beverage Caps and Closures Industry Revenue Share (%), by Material 2024 & 2032
- Figure 14: North America Beverage Caps and Closures Industry Revenue (Million), by Country 2024 & 2032
- Figure 15: North America Beverage Caps and Closures Industry Revenue Share (%), by Country 2024 & 2032
- Figure 16: Europe Beverage Caps and Closures Industry Revenue (Million), by Material 2024 & 2032
- Figure 17: Europe Beverage Caps and Closures Industry Revenue Share (%), by Material 2024 & 2032
- Figure 18: Europe Beverage Caps and Closures Industry Revenue (Million), by Country 2024 & 2032
- Figure 19: Europe Beverage Caps and Closures Industry Revenue Share (%), by Country 2024 & 2032
- Figure 20: Asia Pacific Beverage Caps and Closures Industry Revenue (Million), by Material 2024 & 2032
- Figure 21: Asia Pacific Beverage Caps and Closures Industry Revenue Share (%), by Material 2024 & 2032
- Figure 22: Asia Pacific Beverage Caps and Closures Industry Revenue (Million), by Country 2024 & 2032
- Figure 23: Asia Pacific Beverage Caps and Closures Industry Revenue Share (%), by Country 2024 & 2032
- Figure 24: Latin America Beverage Caps and Closures Industry Revenue (Million), by Material 2024 & 2032
- Figure 25: Latin America Beverage Caps and Closures Industry Revenue Share (%), by Material 2024 & 2032
- Figure 26: Latin America Beverage Caps and Closures Industry Revenue (Million), by Country 2024 & 2032
- Figure 27: Latin America Beverage Caps and Closures Industry Revenue Share (%), by Country 2024 & 2032
- Figure 28: Middle East and Africa Beverage Caps and Closures Industry Revenue (Million), by Material 2024 & 2032
- Figure 29: Middle East and Africa Beverage Caps and Closures Industry Revenue Share (%), by Material 2024 & 2032
- Figure 30: Middle East and Africa Beverage Caps and Closures Industry Revenue (Million), by Country 2024 & 2032
- Figure 31: Middle East and Africa Beverage Caps and Closures Industry Revenue Share (%), by Country 2024 & 2032
List of Tables
- Table 1: Global Beverage Caps and Closures Industry Revenue Million Forecast, by Region 2019 & 2032
- Table 2: Global Beverage Caps and Closures Industry Revenue Million Forecast, by Material 2019 & 2032
- Table 3: Global Beverage Caps and Closures Industry Revenue Million Forecast, by Region 2019 & 2032
- Table 4: Global Beverage Caps and Closures Industry Revenue Million Forecast, by Country 2019 & 2032
- Table 5: US Beverage Caps and Closures Industry Revenue (Million) Forecast, by Application 2019 & 2032
- Table 6: Canada Beverage Caps and Closures Industry Revenue (Million) Forecast, by Application 2019 & 2032
- Table 7: Global Beverage Caps and Closures Industry Revenue Million Forecast, by Country 2019 & 2032
- Table 8: Germany Beverage Caps and Closures Industry Revenue (Million) Forecast, by Application 2019 & 2032
- Table 9: UK Beverage Caps and Closures Industry Revenue (Million) Forecast, by Application 2019 & 2032
- Table 10: France Beverage Caps and Closures Industry Revenue (Million) Forecast, by Application 2019 & 2032
- Table 11: Rest of Europe Beverage Caps and Closures Industry Revenue (Million) Forecast, by Application 2019 & 2032
- Table 12: Global Beverage Caps and Closures Industry Revenue Million Forecast, by Country 2019 & 2032
- Table 13: China Beverage Caps and Closures Industry Revenue (Million) Forecast, by Application 2019 & 2032
- Table 14: Japan Beverage Caps and Closures Industry Revenue (Million) Forecast, by Application 2019 & 2032
- Table 15: India Beverage Caps and Closures Industry Revenue (Million) Forecast, by Application 2019 & 2032
- Table 16: Rest of Asia Pacific Beverage Caps and Closures Industry Revenue (Million) Forecast, by Application 2019 & 2032
- Table 17: Global Beverage Caps and Closures Industry Revenue Million Forecast, by Country 2019 & 2032
- Table 18: Brazil Beverage Caps and Closures Industry Revenue (Million) Forecast, by Application 2019 & 2032
- Table 19: Mexico Beverage Caps and Closures Industry Revenue (Million) Forecast, by Application 2019 & 2032
- Table 20: Rest of Latin America Beverage Caps and Closures Industry Revenue (Million) Forecast, by Application 2019 & 2032
- Table 21: Global Beverage Caps and Closures Industry Revenue Million Forecast, by Country 2019 & 2032
- Table 22: UAE Beverage Caps and Closures Industry Revenue (Million) Forecast, by Application 2019 & 2032
- Table 23: Saudi Arabia Beverage Caps and Closures Industry Revenue (Million) Forecast, by Application 2019 & 2032
- Table 24: South Africa Beverage Caps and Closures Industry Revenue (Million) Forecast, by Application 2019 & 2032
- Table 25: Rest of Middle East Beverage Caps and Closures Industry Revenue (Million) Forecast, by Application 2019 & 2032
- Table 26: Global Beverage Caps and Closures Industry Revenue Million Forecast, by Material 2019 & 2032
- Table 27: Global Beverage Caps and Closures Industry Revenue Million Forecast, by Country 2019 & 2032
- Table 28: US Beverage Caps and Closures Industry Revenue (Million) Forecast, by Application 2019 & 2032
- Table 29: Canada Beverage Caps and Closures Industry Revenue (Million) Forecast, by Application 2019 & 2032
- Table 30: Global Beverage Caps and Closures Industry Revenue Million Forecast, by Material 2019 & 2032
- Table 31: Global Beverage Caps and Closures Industry Revenue Million Forecast, by Country 2019 & 2032
- Table 32: Germany Beverage Caps and Closures Industry Revenue (Million) Forecast, by Application 2019 & 2032
- Table 33: UK Beverage Caps and Closures Industry Revenue (Million) Forecast, by Application 2019 & 2032
- Table 34: France Beverage Caps and Closures Industry Revenue (Million) Forecast, by Application 2019 & 2032
- Table 35: Rest of Europe Beverage Caps and Closures Industry Revenue (Million) Forecast, by Application 2019 & 2032
- Table 36: Global Beverage Caps and Closures Industry Revenue Million Forecast, by Material 2019 & 2032
- Table 37: Global Beverage Caps and Closures Industry Revenue Million Forecast, by Country 2019 & 2032
- Table 38: China Beverage Caps and Closures Industry Revenue (Million) Forecast, by Application 2019 & 2032
- Table 39: Japan Beverage Caps and Closures Industry Revenue (Million) Forecast, by Application 2019 & 2032
- Table 40: India Beverage Caps and Closures Industry Revenue (Million) Forecast, by Application 2019 & 2032
- Table 41: Rest of Asia Pacific Beverage Caps and Closures Industry Revenue (Million) Forecast, by Application 2019 & 2032
- Table 42: Global Beverage Caps and Closures Industry Revenue Million Forecast, by Material 2019 & 2032
- Table 43: Global Beverage Caps and Closures Industry Revenue Million Forecast, by Country 2019 & 2032
- Table 44: Brazil Beverage Caps and Closures Industry Revenue (Million) Forecast, by Application 2019 & 2032
- Table 45: Mexico Beverage Caps and Closures Industry Revenue (Million) Forecast, by Application 2019 & 2032
- Table 46: Rest of Latin America Beverage Caps and Closures Industry Revenue (Million) Forecast, by Application 2019 & 2032
- Table 47: Global Beverage Caps and Closures Industry Revenue Million Forecast, by Material 2019 & 2032
- Table 48: Global Beverage Caps and Closures Industry Revenue Million Forecast, by Country 2019 & 2032
- Table 49: UAE Beverage Caps and Closures Industry Revenue (Million) Forecast, by Application 2019 & 2032
- Table 50: Saudi Arabia Beverage Caps and Closures Industry Revenue (Million) Forecast, by Application 2019 & 2032
- Table 51: South Africa Beverage Caps and Closures Industry Revenue (Million) Forecast, by Application 2019 & 2032
- Table 52: Rest of Middle East Beverage Caps and Closures Industry Revenue (Million) Forecast, by Application 2019 & 2032
Frequently Asked Questions
1. What is the projected Compound Annual Growth Rate (CAGR) of the Beverage Caps and Closures Industry?
The projected CAGR is approximately 4.54%.
2. Which companies are prominent players in the Beverage Caps and Closures Industry?
Key companies in the market include Aptar Group Inc, Tetra Laval International*List Not Exhaustive, Pact Group, Ball Corporation, Global Closure Systems, Bericap GmbH & Co KG, Guala Closures Group, Crown Holdings Inc, Albea Group, Evergreen Packaging Inc, Berry Global Inc, Silgan Holdings Inc, Amcor Ltd.
3. What are the main segments of the Beverage Caps and Closures Industry?
The market segments include Material.
4. Can you provide details about the market size?
The market size is estimated to be USD XX Million as of 2022.
5. What are some drivers contributing to market growth?
; Increasing Beverage Consumption in Developing Economies; Technological Advancements and Innovative Packaging Solutions.
6. What are the notable trends driving market growth?
Plastic is Expected to Experience a Significant Market Share.
7. Are there any restraints impacting market growth?
; Stringent Regulations on the Usage of Plastic Bottles.
8. Can you provide examples of recent developments in the market?
N/A
9. What pricing options are available for accessing the report?
Pricing options include single-user, multi-user, and enterprise licenses priced at USD 4750, USD 5250, and USD 8750 respectively.
10. Is the market size provided in terms of value or volume?
The market size is provided in terms of value, measured in Million.
11. Are there any specific market keywords associated with the report?
Yes, the market keyword associated with the report is "Beverage Caps and Closures Industry," which aids in identifying and referencing the specific market segment covered.
12. How do I determine which pricing option suits my needs best?
The pricing options vary based on user requirements and access needs. Individual users may opt for single-user licenses, while businesses requiring broader access may choose multi-user or enterprise licenses for cost-effective access to the report.
13. Are there any additional resources or data provided in the Beverage Caps and Closures Industry report?
While the report offers comprehensive insights, it's advisable to review the specific contents or supplementary materials provided to ascertain if additional resources or data are available.
14. How can I stay updated on further developments or reports in the Beverage Caps and Closures Industry?
To stay informed about further developments, trends, and reports in the Beverage Caps and Closures Industry, consider subscribing to industry newsletters, following relevant companies and organizations, or regularly checking reputable industry news sources and publications.
Methodology
Step 1 - Identification of Relevant Samples Size from Population Database


Step 2 - Approaches for Defining Global Market Size (Value, Volume* & Price*)

Note*: In applicable scenarios
Step 3 - Data Sources
Primary Research
- Web Analytics
- Survey Reports
- Research Institute
- Latest Research Reports
- Opinion Leaders
Secondary Research
- Annual Reports
- White Paper
- Latest Press Release
- Industry Association
- Paid Database
- Investor Presentations

Step 4 - Data Triangulation
Involves using different sources of information in order to increase the validity of a study
These sources are likely to be stakeholders in a program - participants, other researchers, program staff, other community members, and so on.
Then we put all data in single framework & apply various statistical tools to find out the dynamic on the market.
During the analysis stage, feedback from the stakeholder groups would be compared to determine areas of agreement as well as areas of divergence
