

Key Insights
The bio-based foam market is experiencing robust growth, driven by increasing environmental concerns and the rising demand for sustainable materials across various end-use industries. A Compound Annual Growth Rate (CAGR) of 14.73% from 2019 to 2024 suggests a significant market expansion, with projections indicating continued growth through 2033. Key drivers include stringent regulations on the use of petroleum-based foams, growing consumer preference for eco-friendly products, and advancements in bio-based polyurethane technology leading to improved performance characteristics comparable to traditional foams. The diverse applications of bio-based foams, spanning from automotive interiors and footwear to packaging and construction insulation, further contribute to market expansion. While challenges remain, such as higher initial production costs compared to conventional foams and limited availability of certain bio-based raw materials, ongoing research and development efforts are actively addressing these limitations. The market segmentation reveals strong growth across application areas, with foams and coatings sectors leading the way, driven by strong demand from the transportation and construction industries. Geographically, North America and Europe currently hold significant market shares due to established environmental regulations and high consumer awareness. However, the Asia-Pacific region is projected to witness the most rapid growth in the coming years, fueled by increasing industrialization and rising disposable incomes.
The competitive landscape is characterized by a mix of large multinational chemical companies and specialized bio-material producers. Major players are actively investing in research and development to improve the properties of bio-based foams and expand their product portfolios. Strategic collaborations, mergers, and acquisitions are anticipated to shape the market dynamics in the future. Furthermore, the increasing focus on circular economy principles and the development of biodegradable bio-based foams are poised to create new opportunities for growth in this dynamic market segment. The ongoing transition towards sustainability across various industries will continue to propel the demand for bio-based foams, making it an attractive market for investment and innovation. Future market growth will likely be influenced by factors such as government policies promoting sustainable materials, technological advancements, and the price competitiveness of bio-based alternatives.
Bio-Based Foam Industry Market Report: 2019-2033
This comprehensive report provides a detailed analysis of the bio-based foam industry, encompassing market dynamics, growth trends, regional insights, and key player strategies. With a study period spanning 2019-2033 (base year 2025, forecast period 2025-2033), this report is an invaluable resource for industry professionals, investors, and strategic decision-makers seeking to navigate this rapidly evolving market. The report leverages proprietary data and extensive research to deliver actionable insights and projections. The market is segmented by application (foams, coatings, adhesives & sealants, other applications) and end-user industry (transportation, footwear & textile, construction, packaging, furniture & bedding, electronics, and others), providing a granular understanding of market structure and growth drivers. The total market size is projected to reach xx Million units by 2033.
Bio-Based Foam Industry Market Dynamics & Structure
The bio-based foam market is characterized by moderate concentration, with several major players holding significant market share. Technological innovation, driven by the need for sustainable materials and improved performance characteristics, is a key driver. Stringent environmental regulations are also shaping industry trends, pushing adoption of bio-based alternatives. Competitive pressures from traditional petroleum-based foams remain, though bio-based options are gaining traction due to their eco-friendly profile. Mergers and acquisitions (M&A) activity is moderate, with larger players strategically acquiring smaller companies to expand their product portfolios and market reach.
- Market Concentration: Moderately concentrated, with top 5 players holding approximately xx% of the market share in 2024.
- Technological Innovation: Focus on improving bio-based foam properties (strength, durability, cost-effectiveness) to compete with traditional foams.
- Regulatory Framework: Increasingly stringent environmental regulations are driving demand for sustainable alternatives like bio-based foams.
- Competitive Substitutes: Traditional petroleum-based foams pose a significant competitive threat.
- M&A Trends: Moderate M&A activity, with strategic acquisitions aimed at expanding product lines and market access. Approximately xx M&A deals were observed in the historical period.
- Innovation Barriers: High initial investment costs for R&D and scaling up production remain a challenge.
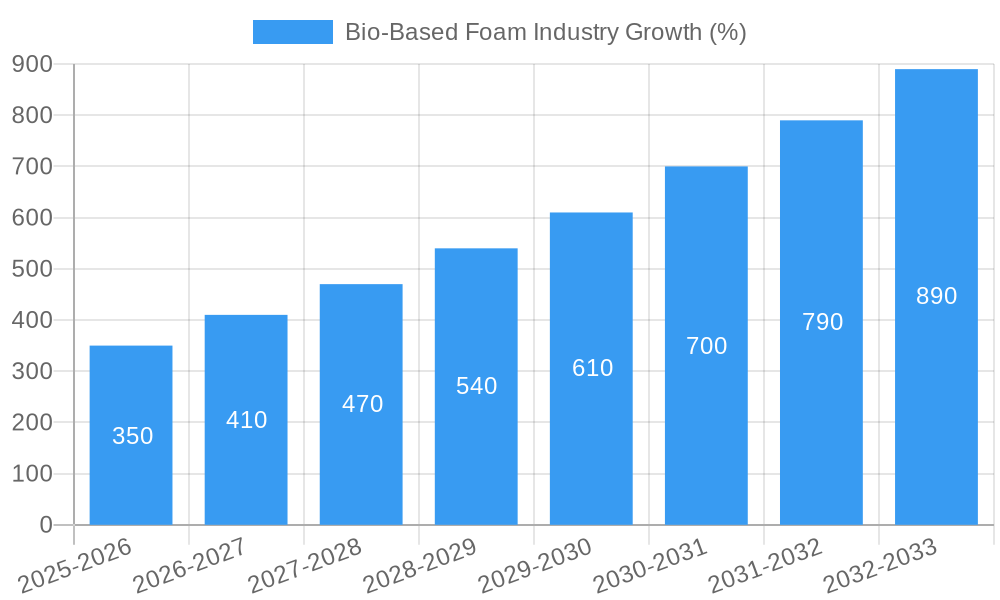
Bio-Based Foam Industry Growth Trends & Insights
The bio-based foam market has witnessed robust growth in recent years, driven by increasing environmental awareness and stricter regulations on conventional foam production. The market experienced a CAGR of xx% during the historical period (2019-2024) and is projected to maintain a CAGR of xx% during the forecast period (2025-2033). This growth is attributed to factors such as rising demand from key end-use sectors (e.g., construction, packaging, automotive), technological advancements leading to improved product performance, and increasing consumer preference for eco-friendly products. Market penetration is expected to rise from xx% in 2024 to xx% by 2033. Technological disruptions, such as the development of novel bio-based polymers and improved manufacturing processes, are further fueling market expansion. Shifting consumer behavior towards sustainable products and a growing emphasis on circular economy principles are also contributing to the market's upward trajectory.
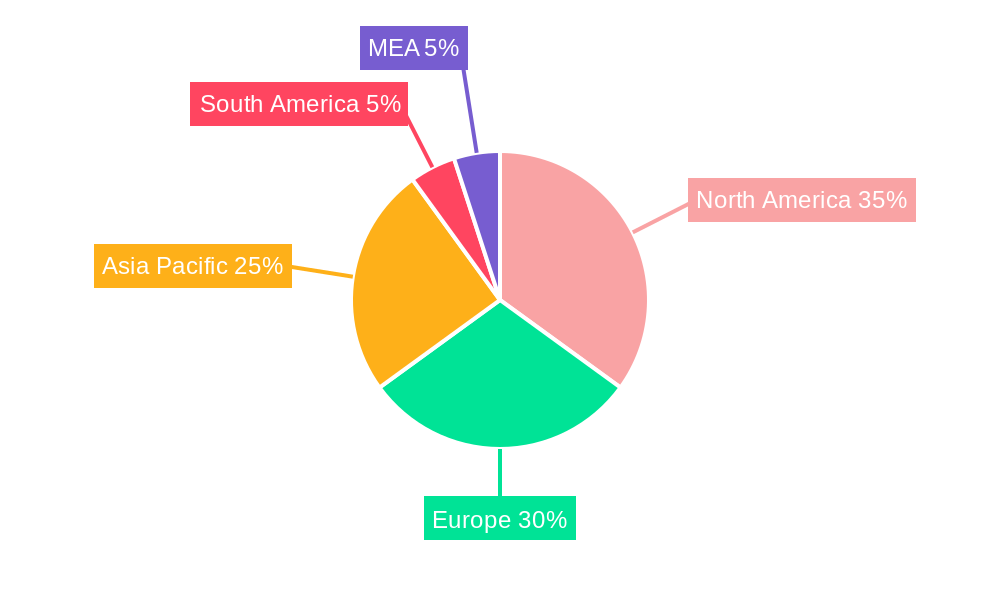
Dominant Regions, Countries, or Segments in Bio-Based Foam Industry
The North American region currently holds the largest market share, driven by strong demand from the construction and automotive industries. Europe is also a significant market, fueled by stringent environmental regulations and a focus on sustainable materials. Within application segments, foams dominate the market, followed by coatings and adhesives & sealants. The transportation industry is a major end-user, followed by packaging and construction.
- Key Drivers:
- Stringent environmental regulations in Europe and North America.
- Growing demand from the construction and transportation sectors.
- Increased investments in research and development of bio-based foams.
- Government incentives and subsidies for the adoption of sustainable materials.
- Dominance Factors:
- North America's strong automotive and construction sectors drive high demand.
- Europe's stringent environmental regulations foster the adoption of bio-based alternatives.
- The foams application segment benefits from versatile applications across various industries.
Bio-Based Foam Industry Product Landscape
The bio-based foam product landscape is characterized by continuous innovation, with new products offering improved performance characteristics, enhanced sustainability, and wider applications. Key developments include the introduction of bio-based polyurethane foams with superior thermal insulation properties, improved flexibility, and enhanced durability. These advancements are broadening the applications of bio-based foams in various sectors, expanding market reach and driving growth. Unique selling propositions emphasize environmental friendliness, cost-effectiveness in certain applications, and improved performance compared to some traditional alternatives.
Key Drivers, Barriers & Challenges in Bio-Based Foam Industry
Key Drivers: Growing environmental awareness, stringent government regulations promoting sustainable materials, and rising demand from key end-use sectors such as packaging, construction, and automotive are driving market growth. Technological advancements leading to improved bio-based foam properties also contribute significantly.
Challenges: High production costs compared to conventional foams remain a significant barrier to wider adoption. Supply chain limitations and fluctuations in raw material prices can disrupt production. Regulatory hurdles and complex approval processes in some regions pose challenges to market penetration. Competition from established petroleum-based foam manufacturers also restricts market growth.
Emerging Opportunities in Bio-Based Foam Industry
Untapped markets in developing economies, coupled with growing demand for eco-friendly materials in emerging sectors such as biomedical and renewable energy, present significant growth opportunities. Innovation in bio-based foam formulations targeting niche applications, like specialized packaging or high-performance insulation, offers further expansion potential. Evolving consumer preferences for sustainable and ethical products create a favorable market environment for bio-based foam manufacturers.
Growth Accelerators in the Bio-Based Foam Industry
Technological breakthroughs in bio-based polymer synthesis and improved manufacturing processes are accelerating market growth. Strategic partnerships between bio-based foam manufacturers and key players in downstream industries are fostering innovation and expanding market reach. Aggressive marketing campaigns highlighting the environmental and performance benefits of bio-based foams are enhancing brand visibility and stimulating market demand. Expansion into new geographic markets and diversification into higher-value applications are also driving long-term growth.
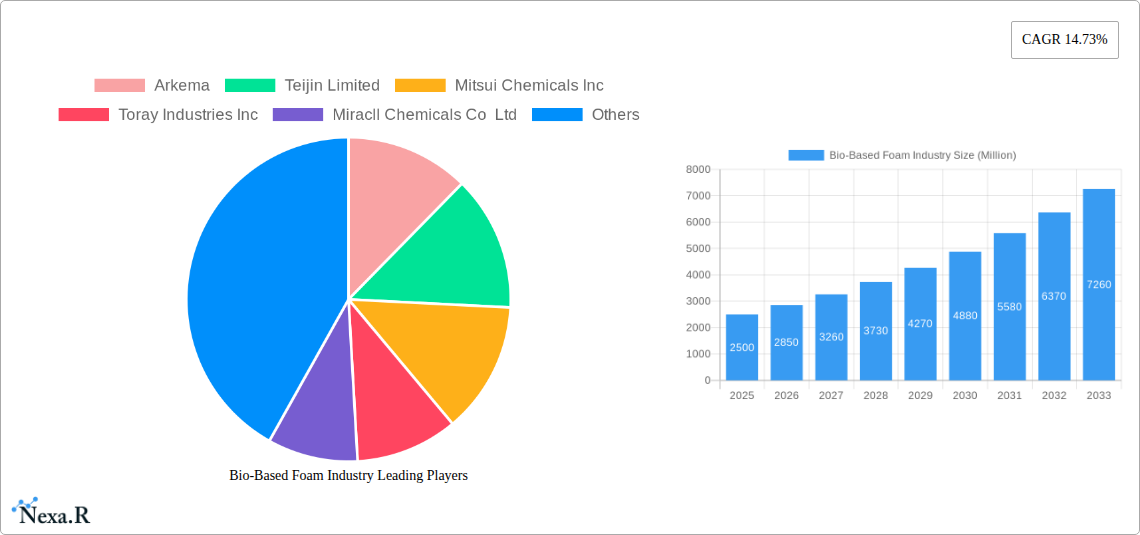
Key Players Shaping the Bio-Based Foam Industry Market
- Arkema
- Teijin Limited
- Mitsui Chemicals Inc
- Toray Industries Inc
- Miracll Chemicals Co Ltd
- BASF SE
- Huntsman International LLC
- Woodbridge
- Stahl Holdings BV
- The Lubrizol Corporation
- Covestro AG
Notable Milestones in Bio-Based Foam Industry Sector
- October 2022: Carbon's EPU 44 wins the 2022 Polyurethane Innovation Award, highlighting advancements in bio-based polyurethane technology.
- November 2022: Covestro AG and Coleitec form a strategic partnership to accelerate the development and market adoption of PU composite materials.
In-Depth Bio-Based Foam Industry Market Outlook
The bio-based foam market is poised for significant growth in the coming years, driven by strong tailwinds such as increasing environmental concerns, supportive government policies, and continuous technological advancements. Strategic partnerships, focused research and development, and expansion into new applications and markets will be crucial factors in shaping the future landscape. The market presents promising opportunities for companies that can effectively address the challenges related to production costs, supply chain resilience, and competition. The focus on sustainability and improved performance characteristics will likely lead to increased market penetration and establish bio-based foams as a leading material in various applications.
Bio-Based Foam Industry Segmentation
-
1. Application
- 1.1. Foams
- 1.2. Coatings
- 1.3. Adhesive and Sealants
- 1.4. Other Ap
-
2. End-user Industry
- 2.1. Transportation
- 2.2. Footwear and Textile
- 2.3. Construction
- 2.4. Packaging
- 2.5. Furniture and Bedding
- 2.6. Electronics
- 2.7. Other En
Bio-Based Foam Industry Segmentation By Geography
-
1. Asia Pacific
- 1.1. China
- 1.2. India
- 1.3. Japan
- 1.4. South Korea
- 1.5. Rest of Asia Pacific
-
2. North America
- 2.1. United States
- 2.2. Canada
- 2.3. Mexico
-
3. Europe
- 3.1. Germany
- 3.2. United Kingdom
- 3.3. Italy
- 3.4. France
- 3.5. Spain
- 3.6. Rest of Europe
-
4. Rest of the World
- 4.1. Brazil
- 4.2. Saudi Arabia
- 4.3. South Africa
- 4.4. Rest of the Countries
Bio-Based Foam Industry REPORT HIGHLIGHTS
| Aspects | Details |
|---|---|
| Study Period | 2019-2033 |
| Base Year | 2024 |
| Estimated Year | 2025 |
| Forecast Period | 2025-2033 |
| Historical Period | 2019-2024 |
| Growth Rate | CAGR of 14.73% from 2019-2033 |
| Segmentation |
|
Table of Contents
- 1. Introduction
- 1.1. Research Scope
- 1.2. Market Segmentation
- 1.3. Research Methodology
- 1.4. Definitions and Assumptions
- 2. Executive Summary
- 2.1. Introduction
- 3. Market Dynamics
- 3.1. Introduction
- 3.2. Market Drivers
- 3.2.1. Increasing Demand from the Construction Industry in Developing Countries; Growing Demand from Electronic Appliance Manufacturing.; Other Drivers
- 3.3. Market Restrains
- 3.3.1. High Cost of Bio-based Materials; Other Restraints
- 3.4. Market Trends
- 3.4.1. Increasing Demand from the Transportation Industry
- 4. Market Factor Analysis
- 4.1. Porters Five Forces
- 4.2. Supply/Value Chain
- 4.3. PESTEL analysis
- 4.4. Market Entropy
- 4.5. Patent/Trademark Analysis
- 5. Global Bio-Based Foam Industry Analysis, Insights and Forecast, 2019-2031
- 5.1. Market Analysis, Insights and Forecast - by Application
- 5.1.1. Foams
- 5.1.2. Coatings
- 5.1.3. Adhesive and Sealants
- 5.1.4. Other Ap
- 5.2. Market Analysis, Insights and Forecast - by End-user Industry
- 5.2.1. Transportation
- 5.2.2. Footwear and Textile
- 5.2.3. Construction
- 5.2.4. Packaging
- 5.2.5. Furniture and Bedding
- 5.2.6. Electronics
- 5.2.7. Other En
- 5.3. Market Analysis, Insights and Forecast - by Region
- 5.3.1. Asia Pacific
- 5.3.2. North America
- 5.3.3. Europe
- 5.3.4. Rest of the World
- 5.1. Market Analysis, Insights and Forecast - by Application
- 6. Asia Pacific Bio-Based Foam Industry Analysis, Insights and Forecast, 2019-2031
- 6.1. Market Analysis, Insights and Forecast - by Application
- 6.1.1. Foams
- 6.1.2. Coatings
- 6.1.3. Adhesive and Sealants
- 6.1.4. Other Ap
- 6.2. Market Analysis, Insights and Forecast - by End-user Industry
- 6.2.1. Transportation
- 6.2.2. Footwear and Textile
- 6.2.3. Construction
- 6.2.4. Packaging
- 6.2.5. Furniture and Bedding
- 6.2.6. Electronics
- 6.2.7. Other En
- 6.1. Market Analysis, Insights and Forecast - by Application
- 7. North America Bio-Based Foam Industry Analysis, Insights and Forecast, 2019-2031
- 7.1. Market Analysis, Insights and Forecast - by Application
- 7.1.1. Foams
- 7.1.2. Coatings
- 7.1.3. Adhesive and Sealants
- 7.1.4. Other Ap
- 7.2. Market Analysis, Insights and Forecast - by End-user Industry
- 7.2.1. Transportation
- 7.2.2. Footwear and Textile
- 7.2.3. Construction
- 7.2.4. Packaging
- 7.2.5. Furniture and Bedding
- 7.2.6. Electronics
- 7.2.7. Other En
- 7.1. Market Analysis, Insights and Forecast - by Application
- 8. Europe Bio-Based Foam Industry Analysis, Insights and Forecast, 2019-2031
- 8.1. Market Analysis, Insights and Forecast - by Application
- 8.1.1. Foams
- 8.1.2. Coatings
- 8.1.3. Adhesive and Sealants
- 8.1.4. Other Ap
- 8.2. Market Analysis, Insights and Forecast - by End-user Industry
- 8.2.1. Transportation
- 8.2.2. Footwear and Textile
- 8.2.3. Construction
- 8.2.4. Packaging
- 8.2.5. Furniture and Bedding
- 8.2.6. Electronics
- 8.2.7. Other En
- 8.1. Market Analysis, Insights and Forecast - by Application
- 9. Rest of the World Bio-Based Foam Industry Analysis, Insights and Forecast, 2019-2031
- 9.1. Market Analysis, Insights and Forecast - by Application
- 9.1.1. Foams
- 9.1.2. Coatings
- 9.1.3. Adhesive and Sealants
- 9.1.4. Other Ap
- 9.2. Market Analysis, Insights and Forecast - by End-user Industry
- 9.2.1. Transportation
- 9.2.2. Footwear and Textile
- 9.2.3. Construction
- 9.2.4. Packaging
- 9.2.5. Furniture and Bedding
- 9.2.6. Electronics
- 9.2.7. Other En
- 9.1. Market Analysis, Insights and Forecast - by Application
- 10. North America Bio-Based Foam Industry Analysis, Insights and Forecast, 2019-2031
- 10.1. Market Analysis, Insights and Forecast - By Country/Sub-region
- 10.1.1 United States
- 10.1.2 Canada
- 10.1.3 Mexico
- 11. Europe Bio-Based Foam Industry Analysis, Insights and Forecast, 2019-2031
- 11.1. Market Analysis, Insights and Forecast - By Country/Sub-region
- 11.1.1 Germany
- 11.1.2 France
- 11.1.3 Italy
- 11.1.4 United Kingdom
- 11.1.5 Netherlands
- 11.1.6 Rest of Europe
- 12. Asia Pacific Bio-Based Foam Industry Analysis, Insights and Forecast, 2019-2031
- 12.1. Market Analysis, Insights and Forecast - By Country/Sub-region
- 12.1.1 China
- 12.1.2 Japan
- 12.1.3 India
- 12.1.4 South Korea
- 12.1.5 Taiwan
- 12.1.6 Australia
- 12.1.7 Rest of Asia-Pacific
- 13. South America Bio-Based Foam Industry Analysis, Insights and Forecast, 2019-2031
- 13.1. Market Analysis, Insights and Forecast - By Country/Sub-region
- 13.1.1 Brazil
- 13.1.2 Argentina
- 13.1.3 Rest of South America
- 14. MEA Bio-Based Foam Industry Analysis, Insights and Forecast, 2019-2031
- 14.1. Market Analysis, Insights and Forecast - By Country/Sub-region
- 14.1.1 Middle East
- 14.1.2 Africa
- 15. Competitive Analysis
- 15.1. Global Market Share Analysis 2024
- 15.2. Company Profiles
- 15.2.1 Arkema
- 15.2.1.1. Overview
- 15.2.1.2. Products
- 15.2.1.3. SWOT Analysis
- 15.2.1.4. Recent Developments
- 15.2.1.5. Financials (Based on Availability)
- 15.2.2 Teijin Limited
- 15.2.2.1. Overview
- 15.2.2.2. Products
- 15.2.2.3. SWOT Analysis
- 15.2.2.4. Recent Developments
- 15.2.2.5. Financials (Based on Availability)
- 15.2.3 Mitsui Chemicals Inc
- 15.2.3.1. Overview
- 15.2.3.2. Products
- 15.2.3.3. SWOT Analysis
- 15.2.3.4. Recent Developments
- 15.2.3.5. Financials (Based on Availability)
- 15.2.4 Toray Industries Inc
- 15.2.4.1. Overview
- 15.2.4.2. Products
- 15.2.4.3. SWOT Analysis
- 15.2.4.4. Recent Developments
- 15.2.4.5. Financials (Based on Availability)
- 15.2.5 Miracll Chemicals Co Ltd
- 15.2.5.1. Overview
- 15.2.5.2. Products
- 15.2.5.3. SWOT Analysis
- 15.2.5.4. Recent Developments
- 15.2.5.5. Financials (Based on Availability)
- 15.2.6 BASF SE
- 15.2.6.1. Overview
- 15.2.6.2. Products
- 15.2.6.3. SWOT Analysis
- 15.2.6.4. Recent Developments
- 15.2.6.5. Financials (Based on Availability)
- 15.2.7 Huntsman International LLC
- 15.2.7.1. Overview
- 15.2.7.2. Products
- 15.2.7.3. SWOT Analysis
- 15.2.7.4. Recent Developments
- 15.2.7.5. Financials (Based on Availability)
- 15.2.8 Woodbridge
- 15.2.8.1. Overview
- 15.2.8.2. Products
- 15.2.8.3. SWOT Analysis
- 15.2.8.4. Recent Developments
- 15.2.8.5. Financials (Based on Availability)
- 15.2.9 Stahl Holdings BV
- 15.2.9.1. Overview
- 15.2.9.2. Products
- 15.2.9.3. SWOT Analysis
- 15.2.9.4. Recent Developments
- 15.2.9.5. Financials (Based on Availability)
- 15.2.10 The Lubrizol Corporation
- 15.2.10.1. Overview
- 15.2.10.2. Products
- 15.2.10.3. SWOT Analysis
- 15.2.10.4. Recent Developments
- 15.2.10.5. Financials (Based on Availability)
- 15.2.11 Covestro AG
- 15.2.11.1. Overview
- 15.2.11.2. Products
- 15.2.11.3. SWOT Analysis
- 15.2.11.4. Recent Developments
- 15.2.11.5. Financials (Based on Availability)
- 15.2.1 Arkema
List of Figures
- Figure 1: Global Bio-Based Foam Industry Revenue Breakdown (Million, %) by Region 2024 & 2032
- Figure 2: Global Bio-Based Foam Industry Volume Breakdown (kilotons, %) by Region 2024 & 2032
- Figure 3: North America Bio-Based Foam Industry Revenue (Million), by Country 2024 & 2032
- Figure 4: North America Bio-Based Foam Industry Volume (kilotons), by Country 2024 & 2032
- Figure 5: North America Bio-Based Foam Industry Revenue Share (%), by Country 2024 & 2032
- Figure 6: North America Bio-Based Foam Industry Volume Share (%), by Country 2024 & 2032
- Figure 7: Europe Bio-Based Foam Industry Revenue (Million), by Country 2024 & 2032
- Figure 8: Europe Bio-Based Foam Industry Volume (kilotons), by Country 2024 & 2032
- Figure 9: Europe Bio-Based Foam Industry Revenue Share (%), by Country 2024 & 2032
- Figure 10: Europe Bio-Based Foam Industry Volume Share (%), by Country 2024 & 2032
- Figure 11: Asia Pacific Bio-Based Foam Industry Revenue (Million), by Country 2024 & 2032
- Figure 12: Asia Pacific Bio-Based Foam Industry Volume (kilotons), by Country 2024 & 2032
- Figure 13: Asia Pacific Bio-Based Foam Industry Revenue Share (%), by Country 2024 & 2032
- Figure 14: Asia Pacific Bio-Based Foam Industry Volume Share (%), by Country 2024 & 2032
- Figure 15: South America Bio-Based Foam Industry Revenue (Million), by Country 2024 & 2032
- Figure 16: South America Bio-Based Foam Industry Volume (kilotons), by Country 2024 & 2032
- Figure 17: South America Bio-Based Foam Industry Revenue Share (%), by Country 2024 & 2032
- Figure 18: South America Bio-Based Foam Industry Volume Share (%), by Country 2024 & 2032
- Figure 19: MEA Bio-Based Foam Industry Revenue (Million), by Country 2024 & 2032
- Figure 20: MEA Bio-Based Foam Industry Volume (kilotons), by Country 2024 & 2032
- Figure 21: MEA Bio-Based Foam Industry Revenue Share (%), by Country 2024 & 2032
- Figure 22: MEA Bio-Based Foam Industry Volume Share (%), by Country 2024 & 2032
- Figure 23: Asia Pacific Bio-Based Foam Industry Revenue (Million), by Application 2024 & 2032
- Figure 24: Asia Pacific Bio-Based Foam Industry Volume (kilotons), by Application 2024 & 2032
- Figure 25: Asia Pacific Bio-Based Foam Industry Revenue Share (%), by Application 2024 & 2032
- Figure 26: Asia Pacific Bio-Based Foam Industry Volume Share (%), by Application 2024 & 2032
- Figure 27: Asia Pacific Bio-Based Foam Industry Revenue (Million), by End-user Industry 2024 & 2032
- Figure 28: Asia Pacific Bio-Based Foam Industry Volume (kilotons), by End-user Industry 2024 & 2032
- Figure 29: Asia Pacific Bio-Based Foam Industry Revenue Share (%), by End-user Industry 2024 & 2032
- Figure 30: Asia Pacific Bio-Based Foam Industry Volume Share (%), by End-user Industry 2024 & 2032
- Figure 31: Asia Pacific Bio-Based Foam Industry Revenue (Million), by Country 2024 & 2032
- Figure 32: Asia Pacific Bio-Based Foam Industry Volume (kilotons), by Country 2024 & 2032
- Figure 33: Asia Pacific Bio-Based Foam Industry Revenue Share (%), by Country 2024 & 2032
- Figure 34: Asia Pacific Bio-Based Foam Industry Volume Share (%), by Country 2024 & 2032
- Figure 35: North America Bio-Based Foam Industry Revenue (Million), by Application 2024 & 2032
- Figure 36: North America Bio-Based Foam Industry Volume (kilotons), by Application 2024 & 2032
- Figure 37: North America Bio-Based Foam Industry Revenue Share (%), by Application 2024 & 2032
- Figure 38: North America Bio-Based Foam Industry Volume Share (%), by Application 2024 & 2032
- Figure 39: North America Bio-Based Foam Industry Revenue (Million), by End-user Industry 2024 & 2032
- Figure 40: North America Bio-Based Foam Industry Volume (kilotons), by End-user Industry 2024 & 2032
- Figure 41: North America Bio-Based Foam Industry Revenue Share (%), by End-user Industry 2024 & 2032
- Figure 42: North America Bio-Based Foam Industry Volume Share (%), by End-user Industry 2024 & 2032
- Figure 43: North America Bio-Based Foam Industry Revenue (Million), by Country 2024 & 2032
- Figure 44: North America Bio-Based Foam Industry Volume (kilotons), by Country 2024 & 2032
- Figure 45: North America Bio-Based Foam Industry Revenue Share (%), by Country 2024 & 2032
- Figure 46: North America Bio-Based Foam Industry Volume Share (%), by Country 2024 & 2032
- Figure 47: Europe Bio-Based Foam Industry Revenue (Million), by Application 2024 & 2032
- Figure 48: Europe Bio-Based Foam Industry Volume (kilotons), by Application 2024 & 2032
- Figure 49: Europe Bio-Based Foam Industry Revenue Share (%), by Application 2024 & 2032
- Figure 50: Europe Bio-Based Foam Industry Volume Share (%), by Application 2024 & 2032
- Figure 51: Europe Bio-Based Foam Industry Revenue (Million), by End-user Industry 2024 & 2032
- Figure 52: Europe Bio-Based Foam Industry Volume (kilotons), by End-user Industry 2024 & 2032
- Figure 53: Europe Bio-Based Foam Industry Revenue Share (%), by End-user Industry 2024 & 2032
- Figure 54: Europe Bio-Based Foam Industry Volume Share (%), by End-user Industry 2024 & 2032
- Figure 55: Europe Bio-Based Foam Industry Revenue (Million), by Country 2024 & 2032
- Figure 56: Europe Bio-Based Foam Industry Volume (kilotons), by Country 2024 & 2032
- Figure 57: Europe Bio-Based Foam Industry Revenue Share (%), by Country 2024 & 2032
- Figure 58: Europe Bio-Based Foam Industry Volume Share (%), by Country 2024 & 2032
- Figure 59: Rest of the World Bio-Based Foam Industry Revenue (Million), by Application 2024 & 2032
- Figure 60: Rest of the World Bio-Based Foam Industry Volume (kilotons), by Application 2024 & 2032
- Figure 61: Rest of the World Bio-Based Foam Industry Revenue Share (%), by Application 2024 & 2032
- Figure 62: Rest of the World Bio-Based Foam Industry Volume Share (%), by Application 2024 & 2032
- Figure 63: Rest of the World Bio-Based Foam Industry Revenue (Million), by End-user Industry 2024 & 2032
- Figure 64: Rest of the World Bio-Based Foam Industry Volume (kilotons), by End-user Industry 2024 & 2032
- Figure 65: Rest of the World Bio-Based Foam Industry Revenue Share (%), by End-user Industry 2024 & 2032
- Figure 66: Rest of the World Bio-Based Foam Industry Volume Share (%), by End-user Industry 2024 & 2032
- Figure 67: Rest of the World Bio-Based Foam Industry Revenue (Million), by Country 2024 & 2032
- Figure 68: Rest of the World Bio-Based Foam Industry Volume (kilotons), by Country 2024 & 2032
- Figure 69: Rest of the World Bio-Based Foam Industry Revenue Share (%), by Country 2024 & 2032
- Figure 70: Rest of the World Bio-Based Foam Industry Volume Share (%), by Country 2024 & 2032
List of Tables
- Table 1: Global Bio-Based Foam Industry Revenue Million Forecast, by Region 2019 & 2032
- Table 2: Global Bio-Based Foam Industry Volume kilotons Forecast, by Region 2019 & 2032
- Table 3: Global Bio-Based Foam Industry Revenue Million Forecast, by Application 2019 & 2032
- Table 4: Global Bio-Based Foam Industry Volume kilotons Forecast, by Application 2019 & 2032
- Table 5: Global Bio-Based Foam Industry Revenue Million Forecast, by End-user Industry 2019 & 2032
- Table 6: Global Bio-Based Foam Industry Volume kilotons Forecast, by End-user Industry 2019 & 2032
- Table 7: Global Bio-Based Foam Industry Revenue Million Forecast, by Region 2019 & 2032
- Table 8: Global Bio-Based Foam Industry Volume kilotons Forecast, by Region 2019 & 2032
- Table 9: Global Bio-Based Foam Industry Revenue Million Forecast, by Country 2019 & 2032
- Table 10: Global Bio-Based Foam Industry Volume kilotons Forecast, by Country 2019 & 2032
- Table 11: United States Bio-Based Foam Industry Revenue (Million) Forecast, by Application 2019 & 2032
- Table 12: United States Bio-Based Foam Industry Volume (kilotons) Forecast, by Application 2019 & 2032
- Table 13: Canada Bio-Based Foam Industry Revenue (Million) Forecast, by Application 2019 & 2032
- Table 14: Canada Bio-Based Foam Industry Volume (kilotons) Forecast, by Application 2019 & 2032
- Table 15: Mexico Bio-Based Foam Industry Revenue (Million) Forecast, by Application 2019 & 2032
- Table 16: Mexico Bio-Based Foam Industry Volume (kilotons) Forecast, by Application 2019 & 2032
- Table 17: Global Bio-Based Foam Industry Revenue Million Forecast, by Country 2019 & 2032
- Table 18: Global Bio-Based Foam Industry Volume kilotons Forecast, by Country 2019 & 2032
- Table 19: Germany Bio-Based Foam Industry Revenue (Million) Forecast, by Application 2019 & 2032
- Table 20: Germany Bio-Based Foam Industry Volume (kilotons) Forecast, by Application 2019 & 2032
- Table 21: France Bio-Based Foam Industry Revenue (Million) Forecast, by Application 2019 & 2032
- Table 22: France Bio-Based Foam Industry Volume (kilotons) Forecast, by Application 2019 & 2032
- Table 23: Italy Bio-Based Foam Industry Revenue (Million) Forecast, by Application 2019 & 2032
- Table 24: Italy Bio-Based Foam Industry Volume (kilotons) Forecast, by Application 2019 & 2032
- Table 25: United Kingdom Bio-Based Foam Industry Revenue (Million) Forecast, by Application 2019 & 2032
- Table 26: United Kingdom Bio-Based Foam Industry Volume (kilotons) Forecast, by Application 2019 & 2032
- Table 27: Netherlands Bio-Based Foam Industry Revenue (Million) Forecast, by Application 2019 & 2032
- Table 28: Netherlands Bio-Based Foam Industry Volume (kilotons) Forecast, by Application 2019 & 2032
- Table 29: Rest of Europe Bio-Based Foam Industry Revenue (Million) Forecast, by Application 2019 & 2032
- Table 30: Rest of Europe Bio-Based Foam Industry Volume (kilotons) Forecast, by Application 2019 & 2032
- Table 31: Global Bio-Based Foam Industry Revenue Million Forecast, by Country 2019 & 2032
- Table 32: Global Bio-Based Foam Industry Volume kilotons Forecast, by Country 2019 & 2032
- Table 33: China Bio-Based Foam Industry Revenue (Million) Forecast, by Application 2019 & 2032
- Table 34: China Bio-Based Foam Industry Volume (kilotons) Forecast, by Application 2019 & 2032
- Table 35: Japan Bio-Based Foam Industry Revenue (Million) Forecast, by Application 2019 & 2032
- Table 36: Japan Bio-Based Foam Industry Volume (kilotons) Forecast, by Application 2019 & 2032
- Table 37: India Bio-Based Foam Industry Revenue (Million) Forecast, by Application 2019 & 2032
- Table 38: India Bio-Based Foam Industry Volume (kilotons) Forecast, by Application 2019 & 2032
- Table 39: South Korea Bio-Based Foam Industry Revenue (Million) Forecast, by Application 2019 & 2032
- Table 40: South Korea Bio-Based Foam Industry Volume (kilotons) Forecast, by Application 2019 & 2032
- Table 41: Taiwan Bio-Based Foam Industry Revenue (Million) Forecast, by Application 2019 & 2032
- Table 42: Taiwan Bio-Based Foam Industry Volume (kilotons) Forecast, by Application 2019 & 2032
- Table 43: Australia Bio-Based Foam Industry Revenue (Million) Forecast, by Application 2019 & 2032
- Table 44: Australia Bio-Based Foam Industry Volume (kilotons) Forecast, by Application 2019 & 2032
- Table 45: Rest of Asia-Pacific Bio-Based Foam Industry Revenue (Million) Forecast, by Application 2019 & 2032
- Table 46: Rest of Asia-Pacific Bio-Based Foam Industry Volume (kilotons) Forecast, by Application 2019 & 2032
- Table 47: Global Bio-Based Foam Industry Revenue Million Forecast, by Country 2019 & 2032
- Table 48: Global Bio-Based Foam Industry Volume kilotons Forecast, by Country 2019 & 2032
- Table 49: Brazil Bio-Based Foam Industry Revenue (Million) Forecast, by Application 2019 & 2032
- Table 50: Brazil Bio-Based Foam Industry Volume (kilotons) Forecast, by Application 2019 & 2032
- Table 51: Argentina Bio-Based Foam Industry Revenue (Million) Forecast, by Application 2019 & 2032
- Table 52: Argentina Bio-Based Foam Industry Volume (kilotons) Forecast, by Application 2019 & 2032
- Table 53: Rest of South America Bio-Based Foam Industry Revenue (Million) Forecast, by Application 2019 & 2032
- Table 54: Rest of South America Bio-Based Foam Industry Volume (kilotons) Forecast, by Application 2019 & 2032
- Table 55: Global Bio-Based Foam Industry Revenue Million Forecast, by Country 2019 & 2032
- Table 56: Global Bio-Based Foam Industry Volume kilotons Forecast, by Country 2019 & 2032
- Table 57: Middle East Bio-Based Foam Industry Revenue (Million) Forecast, by Application 2019 & 2032
- Table 58: Middle East Bio-Based Foam Industry Volume (kilotons) Forecast, by Application 2019 & 2032
- Table 59: Africa Bio-Based Foam Industry Revenue (Million) Forecast, by Application 2019 & 2032
- Table 60: Africa Bio-Based Foam Industry Volume (kilotons) Forecast, by Application 2019 & 2032
- Table 61: Global Bio-Based Foam Industry Revenue Million Forecast, by Application 2019 & 2032
- Table 62: Global Bio-Based Foam Industry Volume kilotons Forecast, by Application 2019 & 2032
- Table 63: Global Bio-Based Foam Industry Revenue Million Forecast, by End-user Industry 2019 & 2032
- Table 64: Global Bio-Based Foam Industry Volume kilotons Forecast, by End-user Industry 2019 & 2032
- Table 65: Global Bio-Based Foam Industry Revenue Million Forecast, by Country 2019 & 2032
- Table 66: Global Bio-Based Foam Industry Volume kilotons Forecast, by Country 2019 & 2032
- Table 67: China Bio-Based Foam Industry Revenue (Million) Forecast, by Application 2019 & 2032
- Table 68: China Bio-Based Foam Industry Volume (kilotons) Forecast, by Application 2019 & 2032
- Table 69: India Bio-Based Foam Industry Revenue (Million) Forecast, by Application 2019 & 2032
- Table 70: India Bio-Based Foam Industry Volume (kilotons) Forecast, by Application 2019 & 2032
- Table 71: Japan Bio-Based Foam Industry Revenue (Million) Forecast, by Application 2019 & 2032
- Table 72: Japan Bio-Based Foam Industry Volume (kilotons) Forecast, by Application 2019 & 2032
- Table 73: South Korea Bio-Based Foam Industry Revenue (Million) Forecast, by Application 2019 & 2032
- Table 74: South Korea Bio-Based Foam Industry Volume (kilotons) Forecast, by Application 2019 & 2032
- Table 75: Rest of Asia Pacific Bio-Based Foam Industry Revenue (Million) Forecast, by Application 2019 & 2032
- Table 76: Rest of Asia Pacific Bio-Based Foam Industry Volume (kilotons) Forecast, by Application 2019 & 2032
- Table 77: Global Bio-Based Foam Industry Revenue Million Forecast, by Application 2019 & 2032
- Table 78: Global Bio-Based Foam Industry Volume kilotons Forecast, by Application 2019 & 2032
- Table 79: Global Bio-Based Foam Industry Revenue Million Forecast, by End-user Industry 2019 & 2032
- Table 80: Global Bio-Based Foam Industry Volume kilotons Forecast, by End-user Industry 2019 & 2032
- Table 81: Global Bio-Based Foam Industry Revenue Million Forecast, by Country 2019 & 2032
- Table 82: Global Bio-Based Foam Industry Volume kilotons Forecast, by Country 2019 & 2032
- Table 83: United States Bio-Based Foam Industry Revenue (Million) Forecast, by Application 2019 & 2032
- Table 84: United States Bio-Based Foam Industry Volume (kilotons) Forecast, by Application 2019 & 2032
- Table 85: Canada Bio-Based Foam Industry Revenue (Million) Forecast, by Application 2019 & 2032
- Table 86: Canada Bio-Based Foam Industry Volume (kilotons) Forecast, by Application 2019 & 2032
- Table 87: Mexico Bio-Based Foam Industry Revenue (Million) Forecast, by Application 2019 & 2032
- Table 88: Mexico Bio-Based Foam Industry Volume (kilotons) Forecast, by Application 2019 & 2032
- Table 89: Global Bio-Based Foam Industry Revenue Million Forecast, by Application 2019 & 2032
- Table 90: Global Bio-Based Foam Industry Volume kilotons Forecast, by Application 2019 & 2032
- Table 91: Global Bio-Based Foam Industry Revenue Million Forecast, by End-user Industry 2019 & 2032
- Table 92: Global Bio-Based Foam Industry Volume kilotons Forecast, by End-user Industry 2019 & 2032
- Table 93: Global Bio-Based Foam Industry Revenue Million Forecast, by Country 2019 & 2032
- Table 94: Global Bio-Based Foam Industry Volume kilotons Forecast, by Country 2019 & 2032
- Table 95: Germany Bio-Based Foam Industry Revenue (Million) Forecast, by Application 2019 & 2032
- Table 96: Germany Bio-Based Foam Industry Volume (kilotons) Forecast, by Application 2019 & 2032
- Table 97: United Kingdom Bio-Based Foam Industry Revenue (Million) Forecast, by Application 2019 & 2032
- Table 98: United Kingdom Bio-Based Foam Industry Volume (kilotons) Forecast, by Application 2019 & 2032
- Table 99: Italy Bio-Based Foam Industry Revenue (Million) Forecast, by Application 2019 & 2032
- Table 100: Italy Bio-Based Foam Industry Volume (kilotons) Forecast, by Application 2019 & 2032
- Table 101: France Bio-Based Foam Industry Revenue (Million) Forecast, by Application 2019 & 2032
- Table 102: France Bio-Based Foam Industry Volume (kilotons) Forecast, by Application 2019 & 2032
- Table 103: Spain Bio-Based Foam Industry Revenue (Million) Forecast, by Application 2019 & 2032
- Table 104: Spain Bio-Based Foam Industry Volume (kilotons) Forecast, by Application 2019 & 2032
- Table 105: Rest of Europe Bio-Based Foam Industry Revenue (Million) Forecast, by Application 2019 & 2032
- Table 106: Rest of Europe Bio-Based Foam Industry Volume (kilotons) Forecast, by Application 2019 & 2032
- Table 107: Global Bio-Based Foam Industry Revenue Million Forecast, by Application 2019 & 2032
- Table 108: Global Bio-Based Foam Industry Volume kilotons Forecast, by Application 2019 & 2032
- Table 109: Global Bio-Based Foam Industry Revenue Million Forecast, by End-user Industry 2019 & 2032
- Table 110: Global Bio-Based Foam Industry Volume kilotons Forecast, by End-user Industry 2019 & 2032
- Table 111: Global Bio-Based Foam Industry Revenue Million Forecast, by Country 2019 & 2032
- Table 112: Global Bio-Based Foam Industry Volume kilotons Forecast, by Country 2019 & 2032
- Table 113: Brazil Bio-Based Foam Industry Revenue (Million) Forecast, by Application 2019 & 2032
- Table 114: Brazil Bio-Based Foam Industry Volume (kilotons) Forecast, by Application 2019 & 2032
- Table 115: Saudi Arabia Bio-Based Foam Industry Revenue (Million) Forecast, by Application 2019 & 2032
- Table 116: Saudi Arabia Bio-Based Foam Industry Volume (kilotons) Forecast, by Application 2019 & 2032
- Table 117: South Africa Bio-Based Foam Industry Revenue (Million) Forecast, by Application 2019 & 2032
- Table 118: South Africa Bio-Based Foam Industry Volume (kilotons) Forecast, by Application 2019 & 2032
- Table 119: Rest of the Countries Bio-Based Foam Industry Revenue (Million) Forecast, by Application 2019 & 2032
- Table 120: Rest of the Countries Bio-Based Foam Industry Volume (kilotons) Forecast, by Application 2019 & 2032
Frequently Asked Questions
1. What is the projected Compound Annual Growth Rate (CAGR) of the Bio-Based Foam Industry?
The projected CAGR is approximately 14.73%.
2. Which companies are prominent players in the Bio-Based Foam Industry?
Key companies in the market include Arkema, Teijin Limited, Mitsui Chemicals Inc, Toray Industries Inc, Miracll Chemicals Co Ltd, BASF SE, Huntsman International LLC, Woodbridge, Stahl Holdings BV, The Lubrizol Corporation, Covestro AG.
3. What are the main segments of the Bio-Based Foam Industry?
The market segments include Application, End-user Industry.
4. Can you provide details about the market size?
The market size is estimated to be USD XX Million as of 2022.
5. What are some drivers contributing to market growth?
Increasing Demand from the Construction Industry in Developing Countries; Growing Demand from Electronic Appliance Manufacturing.; Other Drivers.
6. What are the notable trends driving market growth?
Increasing Demand from the Transportation Industry.
7. Are there any restraints impacting market growth?
High Cost of Bio-based Materials; Other Restraints.
8. Can you provide examples of recent developments in the market?
November 2022: Covestro AG, a materials supplier, and Coleitec, a Chinese high-tech company, signed a strategic partnership agreement to accelerate the application development of polyurethane (PU) composite materials and further expand their market-oriented cooperation.
9. What pricing options are available for accessing the report?
Pricing options include single-user, multi-user, and enterprise licenses priced at USD 4750, USD 5250, and USD 8750 respectively.
10. Is the market size provided in terms of value or volume?
The market size is provided in terms of value, measured in Million and volume, measured in kilotons.
11. Are there any specific market keywords associated with the report?
Yes, the market keyword associated with the report is "Bio-Based Foam Industry," which aids in identifying and referencing the specific market segment covered.
12. How do I determine which pricing option suits my needs best?
The pricing options vary based on user requirements and access needs. Individual users may opt for single-user licenses, while businesses requiring broader access may choose multi-user or enterprise licenses for cost-effective access to the report.
13. Are there any additional resources or data provided in the Bio-Based Foam Industry report?
While the report offers comprehensive insights, it's advisable to review the specific contents or supplementary materials provided to ascertain if additional resources or data are available.
14. How can I stay updated on further developments or reports in the Bio-Based Foam Industry?
To stay informed about further developments, trends, and reports in the Bio-Based Foam Industry, consider subscribing to industry newsletters, following relevant companies and organizations, or regularly checking reputable industry news sources and publications.
Methodology
Step 1 - Identification of Relevant Samples Size from Population Database


Step 2 - Approaches for Defining Global Market Size (Value, Volume* & Price*)

Note*: In applicable scenarios
Step 3 - Data Sources
Primary Research
- Web Analytics
- Survey Reports
- Research Institute
- Latest Research Reports
- Opinion Leaders
Secondary Research
- Annual Reports
- White Paper
- Latest Press Release
- Industry Association
- Paid Database
- Investor Presentations

Step 4 - Data Triangulation
Involves using different sources of information in order to increase the validity of a study
These sources are likely to be stakeholders in a program - participants, other researchers, program staff, other community members, and so on.
Then we put all data in single framework & apply various statistical tools to find out the dynamic on the market.
During the analysis stage, feedback from the stakeholder groups would be compared to determine areas of agreement as well as areas of divergence
