

Key Insights
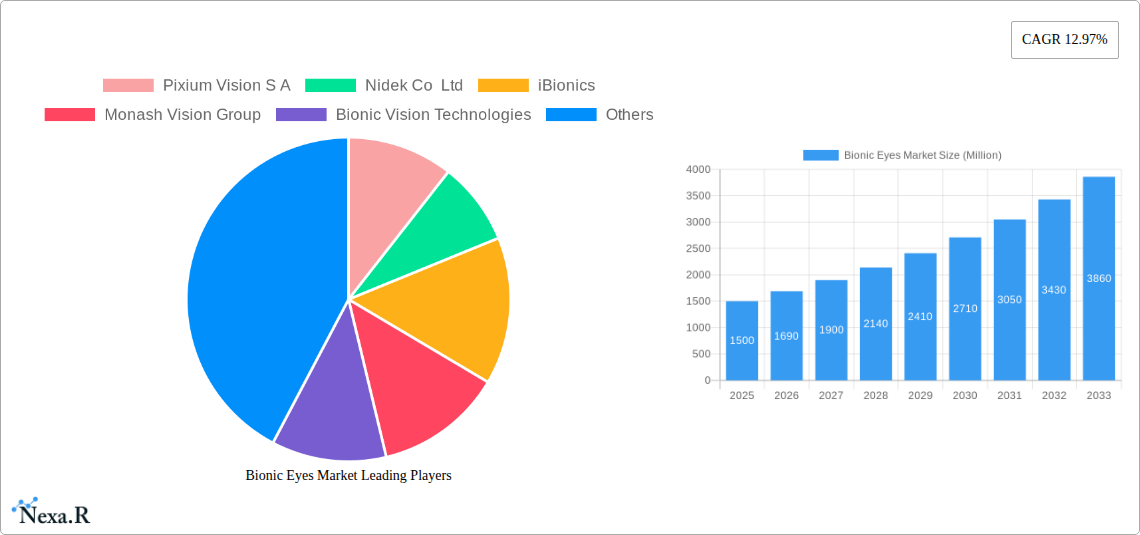
The global bionic eye market is experiencing robust growth, driven by a rising geriatric population susceptible to age-related vision impairments like macular degeneration, increasing technological advancements leading to improved visual acuity and functionality of bionic eyes, and rising healthcare expenditure globally. The market's Compound Annual Growth Rate (CAGR) of 12.97% from 2019-2024 suggests significant expansion, projected to continue over the forecast period (2025-2033). The market segmentation reveals a strong preference for external devices over implanted ones, likely due to less invasive procedures and lower initial costs. However, advancements in implantable technology, coupled with ongoing research into improved biocompatibility and functionality, are expected to fuel the growth of this segment in the coming years. Electronic bionic eyes are gaining traction over mechanical alternatives, fueled by their superior image processing capabilities and improved visual outcomes. The major applications of this technology are centered around addressing vision loss and impairment, with dry age-related macular degeneration (dry AMD) representing a significant portion of the market due to its prevalence. North America and Europe currently dominate the market, owing to higher healthcare spending, technological advancements, and greater awareness of bionic eye technology. However, rapidly growing economies in Asia-Pacific are expected to contribute significantly to market expansion in the future, primarily driven by increasing disposable incomes and rising healthcare infrastructure. The competitive landscape includes both established players and emerging startups, fostering innovation and driving competition to further refine and commercialize advanced bionic eye solutions.
The leading market players are actively engaged in research and development, focusing on improving the resolution, field of view, and overall functionality of bionic eyes. Strategic collaborations, mergers, and acquisitions are also expected to play a crucial role in shaping the market dynamics in the coming years. Regulatory approvals and reimbursement policies remain key factors influencing market penetration. The challenges lie in addressing the high cost of treatment, ensuring long-term device functionality and biocompatibility, and raising public awareness to drive adoption. Despite these challenges, the long-term growth prospects for the bionic eye market remain exceptionally promising as technological innovations continue to enhance visual outcomes for individuals affected by vision loss. The increasing prevalence of age-related vision impairments, coupled with rising investments in research and development, points towards a substantial expansion of the bionic eye market in the years to come.
Bionic Eyes Market Report: 2019-2033
This comprehensive report provides a detailed analysis of the global Bionic Eyes Market, encompassing its current state, future trajectory, and key players. With a focus on market segmentation by type (External Eye, Implanted Eye), technology (Mechanical, Electronic), indication (Vision Loss and Impairment, Dry Age-related Macular Degeneration (dry AMD), Others), and end-user (Hospitals, Ophthalmic Clinics, Others), this report offers invaluable insights for industry professionals, investors, and researchers. The study period covers 2019-2033, with a base year of 2025 and a forecast period of 2025-2033. Market values are presented in Million units.
Bionic Eyes Market Market Dynamics & Structure
The Bionic Eyes Market is characterized by a relatively low concentration, with several key players vying for market share. Technological innovation, particularly in miniaturization and image processing, is a crucial driver. Regulatory approvals present significant hurdles, influencing market entry and adoption rates. Competitive pressure arises from ongoing research into alternative vision restoration technologies. The end-user demographic is primarily aging populations with age-related macular degeneration (AMD) and other vision impairments. M&A activity within the sector has been moderate, reflecting the high capital investment required for development and clinical trials.
- Market Concentration: Moderately fragmented, with no single dominant player. Market share held by top 5 players: xx% (2025).
- Technological Innovation: Significant advancements in image sensors, microelectronics, and biocompatible materials drive product development. Barriers include miniaturization challenges, power consumption, and biointegration.
- Regulatory Frameworks: Stringent regulatory pathways in various regions influence market access and timelines.
- Competitive Product Substitutes: Emerging technologies like gene therapy and stem cell therapies present potential substitutes.
- End-User Demographics: Aging population with increasing prevalence of age-related vision loss forms the primary target market.
- M&A Trends: Moderate activity, with a few strategic acquisitions driving consolidation in recent years. Estimated deal volume: xx deals (2019-2024).
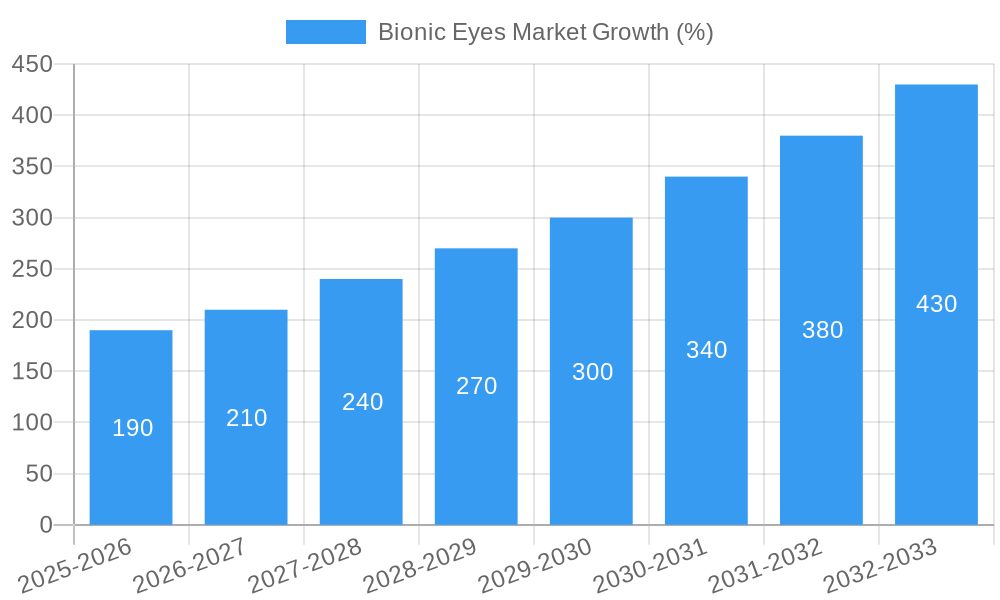
Bionic Eyes Market Growth Trends & Insights
The Bionic Eyes Market is poised for significant growth, driven by an aging global population and increasing prevalence of age-related vision loss. Market size is projected to reach xx Million units by 2025, exhibiting a Compound Annual Growth Rate (CAGR) of xx% during the forecast period (2025-2033). Adoption rates are expected to increase with advancements in technology, reduced costs, and improved clinical outcomes. Technological disruptions, such as the development of wireless implants and improved image processing, are key growth catalysts. Consumer behavior is shifting toward a preference for minimally invasive procedures and improved quality of life. Market penetration remains relatively low, signifying substantial untapped potential.
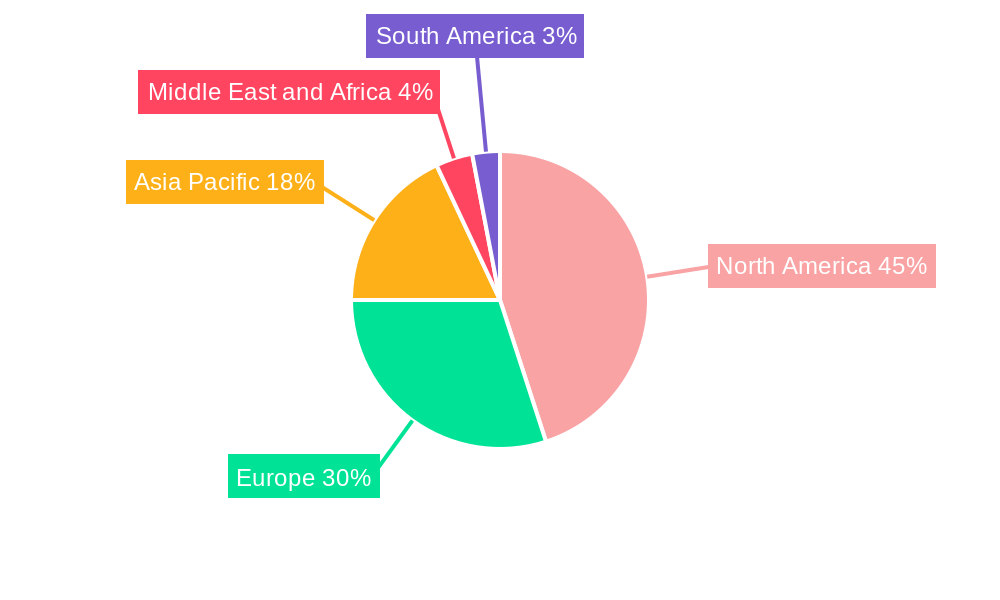
Dominant Regions, Countries, or Segments in Bionic Eyes Market
North America currently holds a significant share of the global Bionic Eyes Market due to its advanced healthcare infrastructure, higher adoption rates, and presence of major players. However, regions like Europe and Asia-Pacific are expected to exhibit robust growth in the coming years, driven by rising awareness, improving healthcare access, and increasing government initiatives. Within segments, the Implanted Eye type holds a larger market share compared to External Eye due to its potential for more effective vision restoration. Electronic technology-based devices dominate the market owing to their superior performance. Dry AMD is a major indication driving market demand. Hospitals are the leading end users.
- Key Drivers: Increased prevalence of age-related macular degeneration, technological advancements, rising disposable incomes, and supportive government policies.
- North America: High market share due to established healthcare infrastructure and early adoption.
- Europe: Significant growth potential driven by increasing prevalence of vision impairments and government support.
- Asia-Pacific: Rapid expansion expected due to growing awareness, improving healthcare accessibility and expanding population.
Bionic Eyes Market Product Landscape
The Bionic Eyes Market features a range of products, from external retinal prostheses to implanted devices, each employing varying technologies. Recent innovations include improved image resolution, longer battery life, and enhanced biocompatibility. Unique selling propositions focus on improved visual acuity, enhanced image processing, and minimized invasiveness. Technological advancements revolve around wireless transmission, artificial intelligence (AI)-powered image enhancement, and personalized implant designs.
Key Drivers, Barriers & Challenges in Bionic Eyes Market
Key Drivers: Rising prevalence of age-related vision loss, technological advancements leading to improved device performance, and increasing investments in R&D. Favorable regulatory policies in some regions also accelerate market growth.
Challenges & Restraints: High cost of devices and procedures, lengthy regulatory approval processes, potential side effects and complications, and limited reimbursement coverage pose significant barriers. The complex manufacturing process and supply chain constraints also limit market expansion. Competition from alternative vision restoration treatments further challenges growth.
Emerging Opportunities in Bionic Eyes Market
Untapped markets in developing countries, particularly in Asia and Africa, represent a significant growth opportunity. The development of more compact and user-friendly devices can improve adoption rates. AI-powered image processing and personalized implant designs will further enhance the patient experience and create new market segments.
Growth Accelerators in the Bionic Eyes Market Industry
Technological breakthroughs in miniaturization, improved image processing, and wireless technology are significant growth accelerators. Strategic partnerships between device manufacturers, research institutions, and healthcare providers are crucial for advancing the field. Expansion into emerging markets and increased government funding will propel further market growth.
Key Players Shaping the Bionic Eyes Market Market
- Pixium Vision S A
- Nidek Co Ltd
- iBionics
- Monash Vision Group
- Bionic Vision Technologies
- Vivani Medical Inc
- Nano Retina Ltd
- Optobionics Corporation
Notable Milestones in Bionic Eyes Market Sector
- July 2022: Pixium Vision SA successfully implants the first patient in the Netherlands in the PRIMAvera pivotal trial for dry AMD.
- January 2022: Pixium Vision implants the first patient in France with the Prima System device for partial vision restoration in dry AMD.
In-Depth Bionic Eyes Market Market Outlook
The Bionic Eyes Market is projected to experience substantial growth over the next decade, driven by technological advancements, increasing prevalence of vision impairment, and growing investment in R&D. Strategic partnerships and market expansion into new regions will further accelerate growth. Focus on improving affordability and accessibility will unlock substantial untapped potential. The market presents significant opportunities for companies engaged in innovation, manufacturing, and distribution of bionic eye systems.
Bionic Eyes Market Segmentation
-
1. Type
- 1.1. External Eye
- 1.2. Implanted Eye
-
2. Technology
- 2.1. Mechanical
- 2.2. Electronic
-
3. Indication
- 3.1. Vision Loss and Impairment
- 3.2. Dry Age-related Macular Degeneration (dry AMD)
- 3.3. Others
-
4. End User
- 4.1. Hospitals
- 4.2. Ophthalmic Clinics
- 4.3. Others
Bionic Eyes Market Segmentation By Geography
-
1. North America
- 1.1. United States
- 1.2. Canada
- 1.3. Mexico
-
2. Europe
- 2.1. United Kingdom
- 2.2. France
- 2.3. Germany
- 2.4. Italy
- 2.5. Spain
- 2.6. Rest of Europe
-
3. Asia Pacific
- 3.1. India
- 3.2. China
- 3.3. Japan
- 3.4. Australia
- 3.5. South Korea
- 3.6. Rest of Asia Pacific
-
4. Middle East and Africa
- 4.1. GCC
- 4.2. South Africa
- 4.3. Rest of Middle East and Africa
-
5. South America
- 5.1. Brazil
- 5.2. Argentina
- 5.3. Rest of South America
Bionic Eyes Market REPORT HIGHLIGHTS
| Aspects | Details |
|---|---|
| Study Period | 2019-2033 |
| Base Year | 2024 |
| Estimated Year | 2025 |
| Forecast Period | 2025-2033 |
| Historical Period | 2019-2024 |
| Growth Rate | CAGR of 12.97% from 2019-2033 |
| Segmentation |
|
Table of Contents
- 1. Introduction
- 1.1. Research Scope
- 1.2. Market Segmentation
- 1.3. Research Methodology
- 1.4. Definitions and Assumptions
- 2. Executive Summary
- 2.1. Introduction
- 3. Market Dynamics
- 3.1. Introduction
- 3.2. Market Drivers
- 3.2.1. Growing Prevalence of Vision Loss and Other Chronic Eye Diseases; Increasing Funding by Private and Public Organizations; Rapid Advancements in Technological Developments
- 3.3. Market Restrains
- 3.3.1. High Research and Development Costs; Low Awareness Among Target Population Regarding Available Products
- 3.4. Market Trends
- 3.4.1. Implanted Eye Segment is Predicted to Grow Significantly Over the Forecast Period
- 4. Market Factor Analysis
- 4.1. Porters Five Forces
- 4.2. Supply/Value Chain
- 4.3. PESTEL analysis
- 4.4. Market Entropy
- 4.5. Patent/Trademark Analysis
- 5. Global Bionic Eyes Market Analysis, Insights and Forecast, 2019-2031
- 5.1. Market Analysis, Insights and Forecast - by Type
- 5.1.1. External Eye
- 5.1.2. Implanted Eye
- 5.2. Market Analysis, Insights and Forecast - by Technology
- 5.2.1. Mechanical
- 5.2.2. Electronic
- 5.3. Market Analysis, Insights and Forecast - by Indication
- 5.3.1. Vision Loss and Impairment
- 5.3.2. Dry Age-related Macular Degeneration (dry AMD)
- 5.3.3. Others
- 5.4. Market Analysis, Insights and Forecast - by End User
- 5.4.1. Hospitals
- 5.4.2. Ophthalmic Clinics
- 5.4.3. Others
- 5.5. Market Analysis, Insights and Forecast - by Region
- 5.5.1. North America
- 5.5.2. Europe
- 5.5.3. Asia Pacific
- 5.5.4. Middle East and Africa
- 5.5.5. South America
- 5.1. Market Analysis, Insights and Forecast - by Type
- 6. North America Bionic Eyes Market Analysis, Insights and Forecast, 2019-2031
- 6.1. Market Analysis, Insights and Forecast - by Type
- 6.1.1. External Eye
- 6.1.2. Implanted Eye
- 6.2. Market Analysis, Insights and Forecast - by Technology
- 6.2.1. Mechanical
- 6.2.2. Electronic
- 6.3. Market Analysis, Insights and Forecast - by Indication
- 6.3.1. Vision Loss and Impairment
- 6.3.2. Dry Age-related Macular Degeneration (dry AMD)
- 6.3.3. Others
- 6.4. Market Analysis, Insights and Forecast - by End User
- 6.4.1. Hospitals
- 6.4.2. Ophthalmic Clinics
- 6.4.3. Others
- 6.1. Market Analysis, Insights and Forecast - by Type
- 7. Europe Bionic Eyes Market Analysis, Insights and Forecast, 2019-2031
- 7.1. Market Analysis, Insights and Forecast - by Type
- 7.1.1. External Eye
- 7.1.2. Implanted Eye
- 7.2. Market Analysis, Insights and Forecast - by Technology
- 7.2.1. Mechanical
- 7.2.2. Electronic
- 7.3. Market Analysis, Insights and Forecast - by Indication
- 7.3.1. Vision Loss and Impairment
- 7.3.2. Dry Age-related Macular Degeneration (dry AMD)
- 7.3.3. Others
- 7.4. Market Analysis, Insights and Forecast - by End User
- 7.4.1. Hospitals
- 7.4.2. Ophthalmic Clinics
- 7.4.3. Others
- 7.1. Market Analysis, Insights and Forecast - by Type
- 8. Asia Pacific Bionic Eyes Market Analysis, Insights and Forecast, 2019-2031
- 8.1. Market Analysis, Insights and Forecast - by Type
- 8.1.1. External Eye
- 8.1.2. Implanted Eye
- 8.2. Market Analysis, Insights and Forecast - by Technology
- 8.2.1. Mechanical
- 8.2.2. Electronic
- 8.3. Market Analysis, Insights and Forecast - by Indication
- 8.3.1. Vision Loss and Impairment
- 8.3.2. Dry Age-related Macular Degeneration (dry AMD)
- 8.3.3. Others
- 8.4. Market Analysis, Insights and Forecast - by End User
- 8.4.1. Hospitals
- 8.4.2. Ophthalmic Clinics
- 8.4.3. Others
- 8.1. Market Analysis, Insights and Forecast - by Type
- 9. Middle East and Africa Bionic Eyes Market Analysis, Insights and Forecast, 2019-2031
- 9.1. Market Analysis, Insights and Forecast - by Type
- 9.1.1. External Eye
- 9.1.2. Implanted Eye
- 9.2. Market Analysis, Insights and Forecast - by Technology
- 9.2.1. Mechanical
- 9.2.2. Electronic
- 9.3. Market Analysis, Insights and Forecast - by Indication
- 9.3.1. Vision Loss and Impairment
- 9.3.2. Dry Age-related Macular Degeneration (dry AMD)
- 9.3.3. Others
- 9.4. Market Analysis, Insights and Forecast - by End User
- 9.4.1. Hospitals
- 9.4.2. Ophthalmic Clinics
- 9.4.3. Others
- 9.1. Market Analysis, Insights and Forecast - by Type
- 10. South America Bionic Eyes Market Analysis, Insights and Forecast, 2019-2031
- 10.1. Market Analysis, Insights and Forecast - by Type
- 10.1.1. External Eye
- 10.1.2. Implanted Eye
- 10.2. Market Analysis, Insights and Forecast - by Technology
- 10.2.1. Mechanical
- 10.2.2. Electronic
- 10.3. Market Analysis, Insights and Forecast - by Indication
- 10.3.1. Vision Loss and Impairment
- 10.3.2. Dry Age-related Macular Degeneration (dry AMD)
- 10.3.3. Others
- 10.4. Market Analysis, Insights and Forecast - by End User
- 10.4.1. Hospitals
- 10.4.2. Ophthalmic Clinics
- 10.4.3. Others
- 10.1. Market Analysis, Insights and Forecast - by Type
- 11. North America Bionic Eyes Market Analysis, Insights and Forecast, 2019-2031
- 11.1. Market Analysis, Insights and Forecast - By Country/Sub-region
- 11.1.1 United States
- 11.1.2 Canada
- 11.1.3 Mexico
- 12. Europe Bionic Eyes Market Analysis, Insights and Forecast, 2019-2031
- 12.1. Market Analysis, Insights and Forecast - By Country/Sub-region
- 12.1.1 United Kingdom
- 12.1.2 France
- 12.1.3 Germany
- 12.1.4 Italy
- 12.1.5 Spain
- 12.1.6 Rest of Europe
- 13. Asia Pacific Bionic Eyes Market Analysis, Insights and Forecast, 2019-2031
- 13.1. Market Analysis, Insights and Forecast - By Country/Sub-region
- 13.1.1 India
- 13.1.2 China
- 13.1.3 Japan
- 13.1.4 Australia
- 13.1.5 South Korea
- 13.1.6 Rest of Asia Pacific
- 14. Middle East and Africa Bionic Eyes Market Analysis, Insights and Forecast, 2019-2031
- 14.1. Market Analysis, Insights and Forecast - By Country/Sub-region
- 14.1.1 GCC
- 14.1.2 South Africa
- 14.1.3 Rest of Middle East and Africa
- 15. South America Bionic Eyes Market Analysis, Insights and Forecast, 2019-2031
- 15.1. Market Analysis, Insights and Forecast - By Country/Sub-region
- 15.1.1 Brazil
- 15.1.2 Argentina
- 15.1.3 Rest of South America
- 16. Competitive Analysis
- 16.1. Global Market Share Analysis 2024
- 16.2. Company Profiles
- 16.2.1 Pixium Vision S A
- 16.2.1.1. Overview
- 16.2.1.2. Products
- 16.2.1.3. SWOT Analysis
- 16.2.1.4. Recent Developments
- 16.2.1.5. Financials (Based on Availability)
- 16.2.2 Nidek Co Ltd
- 16.2.2.1. Overview
- 16.2.2.2. Products
- 16.2.2.3. SWOT Analysis
- 16.2.2.4. Recent Developments
- 16.2.2.5. Financials (Based on Availability)
- 16.2.3 iBionics
- 16.2.3.1. Overview
- 16.2.3.2. Products
- 16.2.3.3. SWOT Analysis
- 16.2.3.4. Recent Developments
- 16.2.3.5. Financials (Based on Availability)
- 16.2.4 Monash Vision Group
- 16.2.4.1. Overview
- 16.2.4.2. Products
- 16.2.4.3. SWOT Analysis
- 16.2.4.4. Recent Developments
- 16.2.4.5. Financials (Based on Availability)
- 16.2.5 Bionic Vision Technologies
- 16.2.5.1. Overview
- 16.2.5.2. Products
- 16.2.5.3. SWOT Analysis
- 16.2.5.4. Recent Developments
- 16.2.5.5. Financials (Based on Availability)
- 16.2.6 Vivani Medical Inc
- 16.2.6.1. Overview
- 16.2.6.2. Products
- 16.2.6.3. SWOT Analysis
- 16.2.6.4. Recent Developments
- 16.2.6.5. Financials (Based on Availability)
- 16.2.7 Nano Retina Ltd
- 16.2.7.1. Overview
- 16.2.7.2. Products
- 16.2.7.3. SWOT Analysis
- 16.2.7.4. Recent Developments
- 16.2.7.5. Financials (Based on Availability)
- 16.2.8 Optobionics Corporation
- 16.2.8.1. Overview
- 16.2.8.2. Products
- 16.2.8.3. SWOT Analysis
- 16.2.8.4. Recent Developments
- 16.2.8.5. Financials (Based on Availability)
- 16.2.1 Pixium Vision S A
List of Figures
- Figure 1: Global Bionic Eyes Market Revenue Breakdown (Million, %) by Region 2024 & 2032
- Figure 2: Global Bionic Eyes Market Volume Breakdown (K Unit, %) by Region 2024 & 2032
- Figure 3: North America Bionic Eyes Market Revenue (Million), by Country 2024 & 2032
- Figure 4: North America Bionic Eyes Market Volume (K Unit), by Country 2024 & 2032
- Figure 5: North America Bionic Eyes Market Revenue Share (%), by Country 2024 & 2032
- Figure 6: North America Bionic Eyes Market Volume Share (%), by Country 2024 & 2032
- Figure 7: Europe Bionic Eyes Market Revenue (Million), by Country 2024 & 2032
- Figure 8: Europe Bionic Eyes Market Volume (K Unit), by Country 2024 & 2032
- Figure 9: Europe Bionic Eyes Market Revenue Share (%), by Country 2024 & 2032
- Figure 10: Europe Bionic Eyes Market Volume Share (%), by Country 2024 & 2032
- Figure 11: Asia Pacific Bionic Eyes Market Revenue (Million), by Country 2024 & 2032
- Figure 12: Asia Pacific Bionic Eyes Market Volume (K Unit), by Country 2024 & 2032
- Figure 13: Asia Pacific Bionic Eyes Market Revenue Share (%), by Country 2024 & 2032
- Figure 14: Asia Pacific Bionic Eyes Market Volume Share (%), by Country 2024 & 2032
- Figure 15: Middle East and Africa Bionic Eyes Market Revenue (Million), by Country 2024 & 2032
- Figure 16: Middle East and Africa Bionic Eyes Market Volume (K Unit), by Country 2024 & 2032
- Figure 17: Middle East and Africa Bionic Eyes Market Revenue Share (%), by Country 2024 & 2032
- Figure 18: Middle East and Africa Bionic Eyes Market Volume Share (%), by Country 2024 & 2032
- Figure 19: South America Bionic Eyes Market Revenue (Million), by Country 2024 & 2032
- Figure 20: South America Bionic Eyes Market Volume (K Unit), by Country 2024 & 2032
- Figure 21: South America Bionic Eyes Market Revenue Share (%), by Country 2024 & 2032
- Figure 22: South America Bionic Eyes Market Volume Share (%), by Country 2024 & 2032
- Figure 23: North America Bionic Eyes Market Revenue (Million), by Type 2024 & 2032
- Figure 24: North America Bionic Eyes Market Volume (K Unit), by Type 2024 & 2032
- Figure 25: North America Bionic Eyes Market Revenue Share (%), by Type 2024 & 2032
- Figure 26: North America Bionic Eyes Market Volume Share (%), by Type 2024 & 2032
- Figure 27: North America Bionic Eyes Market Revenue (Million), by Technology 2024 & 2032
- Figure 28: North America Bionic Eyes Market Volume (K Unit), by Technology 2024 & 2032
- Figure 29: North America Bionic Eyes Market Revenue Share (%), by Technology 2024 & 2032
- Figure 30: North America Bionic Eyes Market Volume Share (%), by Technology 2024 & 2032
- Figure 31: North America Bionic Eyes Market Revenue (Million), by Indication 2024 & 2032
- Figure 32: North America Bionic Eyes Market Volume (K Unit), by Indication 2024 & 2032
- Figure 33: North America Bionic Eyes Market Revenue Share (%), by Indication 2024 & 2032
- Figure 34: North America Bionic Eyes Market Volume Share (%), by Indication 2024 & 2032
- Figure 35: North America Bionic Eyes Market Revenue (Million), by End User 2024 & 2032
- Figure 36: North America Bionic Eyes Market Volume (K Unit), by End User 2024 & 2032
- Figure 37: North America Bionic Eyes Market Revenue Share (%), by End User 2024 & 2032
- Figure 38: North America Bionic Eyes Market Volume Share (%), by End User 2024 & 2032
- Figure 39: North America Bionic Eyes Market Revenue (Million), by Country 2024 & 2032
- Figure 40: North America Bionic Eyes Market Volume (K Unit), by Country 2024 & 2032
- Figure 41: North America Bionic Eyes Market Revenue Share (%), by Country 2024 & 2032
- Figure 42: North America Bionic Eyes Market Volume Share (%), by Country 2024 & 2032
- Figure 43: Europe Bionic Eyes Market Revenue (Million), by Type 2024 & 2032
- Figure 44: Europe Bionic Eyes Market Volume (K Unit), by Type 2024 & 2032
- Figure 45: Europe Bionic Eyes Market Revenue Share (%), by Type 2024 & 2032
- Figure 46: Europe Bionic Eyes Market Volume Share (%), by Type 2024 & 2032
- Figure 47: Europe Bionic Eyes Market Revenue (Million), by Technology 2024 & 2032
- Figure 48: Europe Bionic Eyes Market Volume (K Unit), by Technology 2024 & 2032
- Figure 49: Europe Bionic Eyes Market Revenue Share (%), by Technology 2024 & 2032
- Figure 50: Europe Bionic Eyes Market Volume Share (%), by Technology 2024 & 2032
- Figure 51: Europe Bionic Eyes Market Revenue (Million), by Indication 2024 & 2032
- Figure 52: Europe Bionic Eyes Market Volume (K Unit), by Indication 2024 & 2032
- Figure 53: Europe Bionic Eyes Market Revenue Share (%), by Indication 2024 & 2032
- Figure 54: Europe Bionic Eyes Market Volume Share (%), by Indication 2024 & 2032
- Figure 55: Europe Bionic Eyes Market Revenue (Million), by End User 2024 & 2032
- Figure 56: Europe Bionic Eyes Market Volume (K Unit), by End User 2024 & 2032
- Figure 57: Europe Bionic Eyes Market Revenue Share (%), by End User 2024 & 2032
- Figure 58: Europe Bionic Eyes Market Volume Share (%), by End User 2024 & 2032
- Figure 59: Europe Bionic Eyes Market Revenue (Million), by Country 2024 & 2032
- Figure 60: Europe Bionic Eyes Market Volume (K Unit), by Country 2024 & 2032
- Figure 61: Europe Bionic Eyes Market Revenue Share (%), by Country 2024 & 2032
- Figure 62: Europe Bionic Eyes Market Volume Share (%), by Country 2024 & 2032
- Figure 63: Asia Pacific Bionic Eyes Market Revenue (Million), by Type 2024 & 2032
- Figure 64: Asia Pacific Bionic Eyes Market Volume (K Unit), by Type 2024 & 2032
- Figure 65: Asia Pacific Bionic Eyes Market Revenue Share (%), by Type 2024 & 2032
- Figure 66: Asia Pacific Bionic Eyes Market Volume Share (%), by Type 2024 & 2032
- Figure 67: Asia Pacific Bionic Eyes Market Revenue (Million), by Technology 2024 & 2032
- Figure 68: Asia Pacific Bionic Eyes Market Volume (K Unit), by Technology 2024 & 2032
- Figure 69: Asia Pacific Bionic Eyes Market Revenue Share (%), by Technology 2024 & 2032
- Figure 70: Asia Pacific Bionic Eyes Market Volume Share (%), by Technology 2024 & 2032
- Figure 71: Asia Pacific Bionic Eyes Market Revenue (Million), by Indication 2024 & 2032
- Figure 72: Asia Pacific Bionic Eyes Market Volume (K Unit), by Indication 2024 & 2032
- Figure 73: Asia Pacific Bionic Eyes Market Revenue Share (%), by Indication 2024 & 2032
- Figure 74: Asia Pacific Bionic Eyes Market Volume Share (%), by Indication 2024 & 2032
- Figure 75: Asia Pacific Bionic Eyes Market Revenue (Million), by End User 2024 & 2032
- Figure 76: Asia Pacific Bionic Eyes Market Volume (K Unit), by End User 2024 & 2032
- Figure 77: Asia Pacific Bionic Eyes Market Revenue Share (%), by End User 2024 & 2032
- Figure 78: Asia Pacific Bionic Eyes Market Volume Share (%), by End User 2024 & 2032
- Figure 79: Asia Pacific Bionic Eyes Market Revenue (Million), by Country 2024 & 2032
- Figure 80: Asia Pacific Bionic Eyes Market Volume (K Unit), by Country 2024 & 2032
- Figure 81: Asia Pacific Bionic Eyes Market Revenue Share (%), by Country 2024 & 2032
- Figure 82: Asia Pacific Bionic Eyes Market Volume Share (%), by Country 2024 & 2032
- Figure 83: Middle East and Africa Bionic Eyes Market Revenue (Million), by Type 2024 & 2032
- Figure 84: Middle East and Africa Bionic Eyes Market Volume (K Unit), by Type 2024 & 2032
- Figure 85: Middle East and Africa Bionic Eyes Market Revenue Share (%), by Type 2024 & 2032
- Figure 86: Middle East and Africa Bionic Eyes Market Volume Share (%), by Type 2024 & 2032
- Figure 87: Middle East and Africa Bionic Eyes Market Revenue (Million), by Technology 2024 & 2032
- Figure 88: Middle East and Africa Bionic Eyes Market Volume (K Unit), by Technology 2024 & 2032
- Figure 89: Middle East and Africa Bionic Eyes Market Revenue Share (%), by Technology 2024 & 2032
- Figure 90: Middle East and Africa Bionic Eyes Market Volume Share (%), by Technology 2024 & 2032
- Figure 91: Middle East and Africa Bionic Eyes Market Revenue (Million), by Indication 2024 & 2032
- Figure 92: Middle East and Africa Bionic Eyes Market Volume (K Unit), by Indication 2024 & 2032
- Figure 93: Middle East and Africa Bionic Eyes Market Revenue Share (%), by Indication 2024 & 2032
- Figure 94: Middle East and Africa Bionic Eyes Market Volume Share (%), by Indication 2024 & 2032
- Figure 95: Middle East and Africa Bionic Eyes Market Revenue (Million), by End User 2024 & 2032
- Figure 96: Middle East and Africa Bionic Eyes Market Volume (K Unit), by End User 2024 & 2032
- Figure 97: Middle East and Africa Bionic Eyes Market Revenue Share (%), by End User 2024 & 2032
- Figure 98: Middle East and Africa Bionic Eyes Market Volume Share (%), by End User 2024 & 2032
- Figure 99: Middle East and Africa Bionic Eyes Market Revenue (Million), by Country 2024 & 2032
- Figure 100: Middle East and Africa Bionic Eyes Market Volume (K Unit), by Country 2024 & 2032
- Figure 101: Middle East and Africa Bionic Eyes Market Revenue Share (%), by Country 2024 & 2032
- Figure 102: Middle East and Africa Bionic Eyes Market Volume Share (%), by Country 2024 & 2032
- Figure 103: South America Bionic Eyes Market Revenue (Million), by Type 2024 & 2032
- Figure 104: South America Bionic Eyes Market Volume (K Unit), by Type 2024 & 2032
- Figure 105: South America Bionic Eyes Market Revenue Share (%), by Type 2024 & 2032
- Figure 106: South America Bionic Eyes Market Volume Share (%), by Type 2024 & 2032
- Figure 107: South America Bionic Eyes Market Revenue (Million), by Technology 2024 & 2032
- Figure 108: South America Bionic Eyes Market Volume (K Unit), by Technology 2024 & 2032
- Figure 109: South America Bionic Eyes Market Revenue Share (%), by Technology 2024 & 2032
- Figure 110: South America Bionic Eyes Market Volume Share (%), by Technology 2024 & 2032
- Figure 111: South America Bionic Eyes Market Revenue (Million), by Indication 2024 & 2032
- Figure 112: South America Bionic Eyes Market Volume (K Unit), by Indication 2024 & 2032
- Figure 113: South America Bionic Eyes Market Revenue Share (%), by Indication 2024 & 2032
- Figure 114: South America Bionic Eyes Market Volume Share (%), by Indication 2024 & 2032
- Figure 115: South America Bionic Eyes Market Revenue (Million), by End User 2024 & 2032
- Figure 116: South America Bionic Eyes Market Volume (K Unit), by End User 2024 & 2032
- Figure 117: South America Bionic Eyes Market Revenue Share (%), by End User 2024 & 2032
- Figure 118: South America Bionic Eyes Market Volume Share (%), by End User 2024 & 2032
- Figure 119: South America Bionic Eyes Market Revenue (Million), by Country 2024 & 2032
- Figure 120: South America Bionic Eyes Market Volume (K Unit), by Country 2024 & 2032
- Figure 121: South America Bionic Eyes Market Revenue Share (%), by Country 2024 & 2032
- Figure 122: South America Bionic Eyes Market Volume Share (%), by Country 2024 & 2032
List of Tables
- Table 1: Global Bionic Eyes Market Revenue Million Forecast, by Region 2019 & 2032
- Table 2: Global Bionic Eyes Market Volume K Unit Forecast, by Region 2019 & 2032
- Table 3: Global Bionic Eyes Market Revenue Million Forecast, by Type 2019 & 2032
- Table 4: Global Bionic Eyes Market Volume K Unit Forecast, by Type 2019 & 2032
- Table 5: Global Bionic Eyes Market Revenue Million Forecast, by Technology 2019 & 2032
- Table 6: Global Bionic Eyes Market Volume K Unit Forecast, by Technology 2019 & 2032
- Table 7: Global Bionic Eyes Market Revenue Million Forecast, by Indication 2019 & 2032
- Table 8: Global Bionic Eyes Market Volume K Unit Forecast, by Indication 2019 & 2032
- Table 9: Global Bionic Eyes Market Revenue Million Forecast, by End User 2019 & 2032
- Table 10: Global Bionic Eyes Market Volume K Unit Forecast, by End User 2019 & 2032
- Table 11: Global Bionic Eyes Market Revenue Million Forecast, by Region 2019 & 2032
- Table 12: Global Bionic Eyes Market Volume K Unit Forecast, by Region 2019 & 2032
- Table 13: Global Bionic Eyes Market Revenue Million Forecast, by Country 2019 & 2032
- Table 14: Global Bionic Eyes Market Volume K Unit Forecast, by Country 2019 & 2032
- Table 15: United States Bionic Eyes Market Revenue (Million) Forecast, by Application 2019 & 2032
- Table 16: United States Bionic Eyes Market Volume (K Unit) Forecast, by Application 2019 & 2032
- Table 17: Canada Bionic Eyes Market Revenue (Million) Forecast, by Application 2019 & 2032
- Table 18: Canada Bionic Eyes Market Volume (K Unit) Forecast, by Application 2019 & 2032
- Table 19: Mexico Bionic Eyes Market Revenue (Million) Forecast, by Application 2019 & 2032
- Table 20: Mexico Bionic Eyes Market Volume (K Unit) Forecast, by Application 2019 & 2032
- Table 21: Global Bionic Eyes Market Revenue Million Forecast, by Country 2019 & 2032
- Table 22: Global Bionic Eyes Market Volume K Unit Forecast, by Country 2019 & 2032
- Table 23: United Kingdom Bionic Eyes Market Revenue (Million) Forecast, by Application 2019 & 2032
- Table 24: United Kingdom Bionic Eyes Market Volume (K Unit) Forecast, by Application 2019 & 2032
- Table 25: France Bionic Eyes Market Revenue (Million) Forecast, by Application 2019 & 2032
- Table 26: France Bionic Eyes Market Volume (K Unit) Forecast, by Application 2019 & 2032
- Table 27: Germany Bionic Eyes Market Revenue (Million) Forecast, by Application 2019 & 2032
- Table 28: Germany Bionic Eyes Market Volume (K Unit) Forecast, by Application 2019 & 2032
- Table 29: Italy Bionic Eyes Market Revenue (Million) Forecast, by Application 2019 & 2032
- Table 30: Italy Bionic Eyes Market Volume (K Unit) Forecast, by Application 2019 & 2032
- Table 31: Spain Bionic Eyes Market Revenue (Million) Forecast, by Application 2019 & 2032
- Table 32: Spain Bionic Eyes Market Volume (K Unit) Forecast, by Application 2019 & 2032
- Table 33: Rest of Europe Bionic Eyes Market Revenue (Million) Forecast, by Application 2019 & 2032
- Table 34: Rest of Europe Bionic Eyes Market Volume (K Unit) Forecast, by Application 2019 & 2032
- Table 35: Global Bionic Eyes Market Revenue Million Forecast, by Country 2019 & 2032
- Table 36: Global Bionic Eyes Market Volume K Unit Forecast, by Country 2019 & 2032
- Table 37: India Bionic Eyes Market Revenue (Million) Forecast, by Application 2019 & 2032
- Table 38: India Bionic Eyes Market Volume (K Unit) Forecast, by Application 2019 & 2032
- Table 39: China Bionic Eyes Market Revenue (Million) Forecast, by Application 2019 & 2032
- Table 40: China Bionic Eyes Market Volume (K Unit) Forecast, by Application 2019 & 2032
- Table 41: Japan Bionic Eyes Market Revenue (Million) Forecast, by Application 2019 & 2032
- Table 42: Japan Bionic Eyes Market Volume (K Unit) Forecast, by Application 2019 & 2032
- Table 43: Australia Bionic Eyes Market Revenue (Million) Forecast, by Application 2019 & 2032
- Table 44: Australia Bionic Eyes Market Volume (K Unit) Forecast, by Application 2019 & 2032
- Table 45: South Korea Bionic Eyes Market Revenue (Million) Forecast, by Application 2019 & 2032
- Table 46: South Korea Bionic Eyes Market Volume (K Unit) Forecast, by Application 2019 & 2032
- Table 47: Rest of Asia Pacific Bionic Eyes Market Revenue (Million) Forecast, by Application 2019 & 2032
- Table 48: Rest of Asia Pacific Bionic Eyes Market Volume (K Unit) Forecast, by Application 2019 & 2032
- Table 49: Global Bionic Eyes Market Revenue Million Forecast, by Country 2019 & 2032
- Table 50: Global Bionic Eyes Market Volume K Unit Forecast, by Country 2019 & 2032
- Table 51: GCC Bionic Eyes Market Revenue (Million) Forecast, by Application 2019 & 2032
- Table 52: GCC Bionic Eyes Market Volume (K Unit) Forecast, by Application 2019 & 2032
- Table 53: South Africa Bionic Eyes Market Revenue (Million) Forecast, by Application 2019 & 2032
- Table 54: South Africa Bionic Eyes Market Volume (K Unit) Forecast, by Application 2019 & 2032
- Table 55: Rest of Middle East and Africa Bionic Eyes Market Revenue (Million) Forecast, by Application 2019 & 2032
- Table 56: Rest of Middle East and Africa Bionic Eyes Market Volume (K Unit) Forecast, by Application 2019 & 2032
- Table 57: Global Bionic Eyes Market Revenue Million Forecast, by Country 2019 & 2032
- Table 58: Global Bionic Eyes Market Volume K Unit Forecast, by Country 2019 & 2032
- Table 59: Brazil Bionic Eyes Market Revenue (Million) Forecast, by Application 2019 & 2032
- Table 60: Brazil Bionic Eyes Market Volume (K Unit) Forecast, by Application 2019 & 2032
- Table 61: Argentina Bionic Eyes Market Revenue (Million) Forecast, by Application 2019 & 2032
- Table 62: Argentina Bionic Eyes Market Volume (K Unit) Forecast, by Application 2019 & 2032
- Table 63: Rest of South America Bionic Eyes Market Revenue (Million) Forecast, by Application 2019 & 2032
- Table 64: Rest of South America Bionic Eyes Market Volume (K Unit) Forecast, by Application 2019 & 2032
- Table 65: Global Bionic Eyes Market Revenue Million Forecast, by Type 2019 & 2032
- Table 66: Global Bionic Eyes Market Volume K Unit Forecast, by Type 2019 & 2032
- Table 67: Global Bionic Eyes Market Revenue Million Forecast, by Technology 2019 & 2032
- Table 68: Global Bionic Eyes Market Volume K Unit Forecast, by Technology 2019 & 2032
- Table 69: Global Bionic Eyes Market Revenue Million Forecast, by Indication 2019 & 2032
- Table 70: Global Bionic Eyes Market Volume K Unit Forecast, by Indication 2019 & 2032
- Table 71: Global Bionic Eyes Market Revenue Million Forecast, by End User 2019 & 2032
- Table 72: Global Bionic Eyes Market Volume K Unit Forecast, by End User 2019 & 2032
- Table 73: Global Bionic Eyes Market Revenue Million Forecast, by Country 2019 & 2032
- Table 74: Global Bionic Eyes Market Volume K Unit Forecast, by Country 2019 & 2032
- Table 75: United States Bionic Eyes Market Revenue (Million) Forecast, by Application 2019 & 2032
- Table 76: United States Bionic Eyes Market Volume (K Unit) Forecast, by Application 2019 & 2032
- Table 77: Canada Bionic Eyes Market Revenue (Million) Forecast, by Application 2019 & 2032
- Table 78: Canada Bionic Eyes Market Volume (K Unit) Forecast, by Application 2019 & 2032
- Table 79: Mexico Bionic Eyes Market Revenue (Million) Forecast, by Application 2019 & 2032
- Table 80: Mexico Bionic Eyes Market Volume (K Unit) Forecast, by Application 2019 & 2032
- Table 81: Global Bionic Eyes Market Revenue Million Forecast, by Type 2019 & 2032
- Table 82: Global Bionic Eyes Market Volume K Unit Forecast, by Type 2019 & 2032
- Table 83: Global Bionic Eyes Market Revenue Million Forecast, by Technology 2019 & 2032
- Table 84: Global Bionic Eyes Market Volume K Unit Forecast, by Technology 2019 & 2032
- Table 85: Global Bionic Eyes Market Revenue Million Forecast, by Indication 2019 & 2032
- Table 86: Global Bionic Eyes Market Volume K Unit Forecast, by Indication 2019 & 2032
- Table 87: Global Bionic Eyes Market Revenue Million Forecast, by End User 2019 & 2032
- Table 88: Global Bionic Eyes Market Volume K Unit Forecast, by End User 2019 & 2032
- Table 89: Global Bionic Eyes Market Revenue Million Forecast, by Country 2019 & 2032
- Table 90: Global Bionic Eyes Market Volume K Unit Forecast, by Country 2019 & 2032
- Table 91: United Kingdom Bionic Eyes Market Revenue (Million) Forecast, by Application 2019 & 2032
- Table 92: United Kingdom Bionic Eyes Market Volume (K Unit) Forecast, by Application 2019 & 2032
- Table 93: France Bionic Eyes Market Revenue (Million) Forecast, by Application 2019 & 2032
- Table 94: France Bionic Eyes Market Volume (K Unit) Forecast, by Application 2019 & 2032
- Table 95: Germany Bionic Eyes Market Revenue (Million) Forecast, by Application 2019 & 2032
- Table 96: Germany Bionic Eyes Market Volume (K Unit) Forecast, by Application 2019 & 2032
- Table 97: Italy Bionic Eyes Market Revenue (Million) Forecast, by Application 2019 & 2032
- Table 98: Italy Bionic Eyes Market Volume (K Unit) Forecast, by Application 2019 & 2032
- Table 99: Spain Bionic Eyes Market Revenue (Million) Forecast, by Application 2019 & 2032
- Table 100: Spain Bionic Eyes Market Volume (K Unit) Forecast, by Application 2019 & 2032
- Table 101: Rest of Europe Bionic Eyes Market Revenue (Million) Forecast, by Application 2019 & 2032
- Table 102: Rest of Europe Bionic Eyes Market Volume (K Unit) Forecast, by Application 2019 & 2032
- Table 103: Global Bionic Eyes Market Revenue Million Forecast, by Type 2019 & 2032
- Table 104: Global Bionic Eyes Market Volume K Unit Forecast, by Type 2019 & 2032
- Table 105: Global Bionic Eyes Market Revenue Million Forecast, by Technology 2019 & 2032
- Table 106: Global Bionic Eyes Market Volume K Unit Forecast, by Technology 2019 & 2032
- Table 107: Global Bionic Eyes Market Revenue Million Forecast, by Indication 2019 & 2032
- Table 108: Global Bionic Eyes Market Volume K Unit Forecast, by Indication 2019 & 2032
- Table 109: Global Bionic Eyes Market Revenue Million Forecast, by End User 2019 & 2032
- Table 110: Global Bionic Eyes Market Volume K Unit Forecast, by End User 2019 & 2032
- Table 111: Global Bionic Eyes Market Revenue Million Forecast, by Country 2019 & 2032
- Table 112: Global Bionic Eyes Market Volume K Unit Forecast, by Country 2019 & 2032
- Table 113: India Bionic Eyes Market Revenue (Million) Forecast, by Application 2019 & 2032
- Table 114: India Bionic Eyes Market Volume (K Unit) Forecast, by Application 2019 & 2032
- Table 115: China Bionic Eyes Market Revenue (Million) Forecast, by Application 2019 & 2032
- Table 116: China Bionic Eyes Market Volume (K Unit) Forecast, by Application 2019 & 2032
- Table 117: Japan Bionic Eyes Market Revenue (Million) Forecast, by Application 2019 & 2032
- Table 118: Japan Bionic Eyes Market Volume (K Unit) Forecast, by Application 2019 & 2032
- Table 119: Australia Bionic Eyes Market Revenue (Million) Forecast, by Application 2019 & 2032
- Table 120: Australia Bionic Eyes Market Volume (K Unit) Forecast, by Application 2019 & 2032
- Table 121: South Korea Bionic Eyes Market Revenue (Million) Forecast, by Application 2019 & 2032
- Table 122: South Korea Bionic Eyes Market Volume (K Unit) Forecast, by Application 2019 & 2032
- Table 123: Rest of Asia Pacific Bionic Eyes Market Revenue (Million) Forecast, by Application 2019 & 2032
- Table 124: Rest of Asia Pacific Bionic Eyes Market Volume (K Unit) Forecast, by Application 2019 & 2032
- Table 125: Global Bionic Eyes Market Revenue Million Forecast, by Type 2019 & 2032
- Table 126: Global Bionic Eyes Market Volume K Unit Forecast, by Type 2019 & 2032
- Table 127: Global Bionic Eyes Market Revenue Million Forecast, by Technology 2019 & 2032
- Table 128: Global Bionic Eyes Market Volume K Unit Forecast, by Technology 2019 & 2032
- Table 129: Global Bionic Eyes Market Revenue Million Forecast, by Indication 2019 & 2032
- Table 130: Global Bionic Eyes Market Volume K Unit Forecast, by Indication 2019 & 2032
- Table 131: Global Bionic Eyes Market Revenue Million Forecast, by End User 2019 & 2032
- Table 132: Global Bionic Eyes Market Volume K Unit Forecast, by End User 2019 & 2032
- Table 133: Global Bionic Eyes Market Revenue Million Forecast, by Country 2019 & 2032
- Table 134: Global Bionic Eyes Market Volume K Unit Forecast, by Country 2019 & 2032
- Table 135: GCC Bionic Eyes Market Revenue (Million) Forecast, by Application 2019 & 2032
- Table 136: GCC Bionic Eyes Market Volume (K Unit) Forecast, by Application 2019 & 2032
- Table 137: South Africa Bionic Eyes Market Revenue (Million) Forecast, by Application 2019 & 2032
- Table 138: South Africa Bionic Eyes Market Volume (K Unit) Forecast, by Application 2019 & 2032
- Table 139: Rest of Middle East and Africa Bionic Eyes Market Revenue (Million) Forecast, by Application 2019 & 2032
- Table 140: Rest of Middle East and Africa Bionic Eyes Market Volume (K Unit) Forecast, by Application 2019 & 2032
- Table 141: Global Bionic Eyes Market Revenue Million Forecast, by Type 2019 & 2032
- Table 142: Global Bionic Eyes Market Volume K Unit Forecast, by Type 2019 & 2032
- Table 143: Global Bionic Eyes Market Revenue Million Forecast, by Technology 2019 & 2032
- Table 144: Global Bionic Eyes Market Volume K Unit Forecast, by Technology 2019 & 2032
- Table 145: Global Bionic Eyes Market Revenue Million Forecast, by Indication 2019 & 2032
- Table 146: Global Bionic Eyes Market Volume K Unit Forecast, by Indication 2019 & 2032
- Table 147: Global Bionic Eyes Market Revenue Million Forecast, by End User 2019 & 2032
- Table 148: Global Bionic Eyes Market Volume K Unit Forecast, by End User 2019 & 2032
- Table 149: Global Bionic Eyes Market Revenue Million Forecast, by Country 2019 & 2032
- Table 150: Global Bionic Eyes Market Volume K Unit Forecast, by Country 2019 & 2032
- Table 151: Brazil Bionic Eyes Market Revenue (Million) Forecast, by Application 2019 & 2032
- Table 152: Brazil Bionic Eyes Market Volume (K Unit) Forecast, by Application 2019 & 2032
- Table 153: Argentina Bionic Eyes Market Revenue (Million) Forecast, by Application 2019 & 2032
- Table 154: Argentina Bionic Eyes Market Volume (K Unit) Forecast, by Application 2019 & 2032
- Table 155: Rest of South America Bionic Eyes Market Revenue (Million) Forecast, by Application 2019 & 2032
- Table 156: Rest of South America Bionic Eyes Market Volume (K Unit) Forecast, by Application 2019 & 2032
Frequently Asked Questions
1. What is the projected Compound Annual Growth Rate (CAGR) of the Bionic Eyes Market?
The projected CAGR is approximately 12.97%.
2. Which companies are prominent players in the Bionic Eyes Market?
Key companies in the market include Pixium Vision S A, Nidek Co Ltd, iBionics, Monash Vision Group, Bionic Vision Technologies, Vivani Medical Inc, Nano Retina Ltd, Optobionics Corporation.
3. What are the main segments of the Bionic Eyes Market?
The market segments include Type, Technology, Indication, End User.
4. Can you provide details about the market size?
The market size is estimated to be USD XX Million as of 2022.
5. What are some drivers contributing to market growth?
Growing Prevalence of Vision Loss and Other Chronic Eye Diseases; Increasing Funding by Private and Public Organizations; Rapid Advancements in Technological Developments.
6. What are the notable trends driving market growth?
Implanted Eye Segment is Predicted to Grow Significantly Over the Forecast Period.
7. Are there any restraints impacting market growth?
High Research and Development Costs; Low Awareness Among Target Population Regarding Available Products.
8. Can you provide examples of recent developments in the market?
July 2022: Pixium Vision SA, a bioelectronics company focused on developing bionic vision systems, reported the successful implantation of the first patient in the Netherlands in the PRIMAvera pivotal trial in atrophic dry age-related macular degeneration (dry AMD) following approval of the PRIMAvera study by the Dutch Ministry of Health, Welfare, and Sport and the opening of the first PRIMAvera clinical site in the Netherlands at the Rotterdam Eye Hospital.
9. What pricing options are available for accessing the report?
Pricing options include single-user, multi-user, and enterprise licenses priced at USD 4750, USD 5250, and USD 8750 respectively.
10. Is the market size provided in terms of value or volume?
The market size is provided in terms of value, measured in Million and volume, measured in K Unit.
11. Are there any specific market keywords associated with the report?
Yes, the market keyword associated with the report is "Bionic Eyes Market," which aids in identifying and referencing the specific market segment covered.
12. How do I determine which pricing option suits my needs best?
The pricing options vary based on user requirements and access needs. Individual users may opt for single-user licenses, while businesses requiring broader access may choose multi-user or enterprise licenses for cost-effective access to the report.
13. Are there any additional resources or data provided in the Bionic Eyes Market report?
While the report offers comprehensive insights, it's advisable to review the specific contents or supplementary materials provided to ascertain if additional resources or data are available.
14. How can I stay updated on further developments or reports in the Bionic Eyes Market?
To stay informed about further developments, trends, and reports in the Bionic Eyes Market, consider subscribing to industry newsletters, following relevant companies and organizations, or regularly checking reputable industry news sources and publications.
Methodology
Step 1 - Identification of Relevant Samples Size from Population Database


Step 2 - Approaches for Defining Global Market Size (Value, Volume* & Price*)

Note*: In applicable scenarios
Step 3 - Data Sources
Primary Research
- Web Analytics
- Survey Reports
- Research Institute
- Latest Research Reports
- Opinion Leaders
Secondary Research
- Annual Reports
- White Paper
- Latest Press Release
- Industry Association
- Paid Database
- Investor Presentations

Step 4 - Data Triangulation
Involves using different sources of information in order to increase the validity of a study
These sources are likely to be stakeholders in a program - participants, other researchers, program staff, other community members, and so on.
Then we put all data in single framework & apply various statistical tools to find out the dynamic on the market.
During the analysis stage, feedback from the stakeholder groups would be compared to determine areas of agreement as well as areas of divergence
