

Key Insights
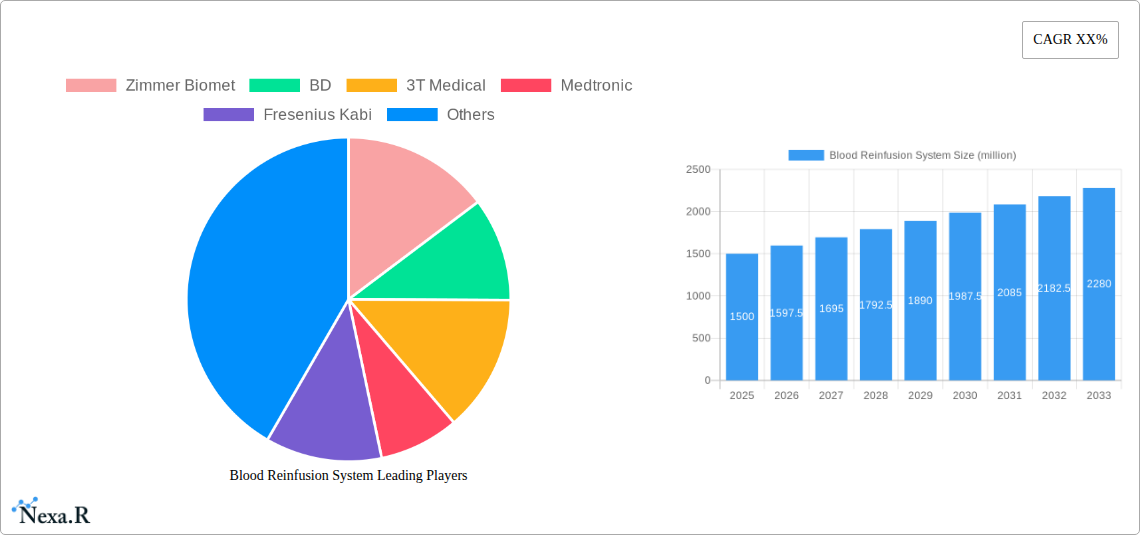
The global Blood Reinfusion System market is poised for significant expansion, projected to reach an estimated USD 1,500 million by 2025, growing at a robust CAGR of 6.5% through 2033. This dynamic growth is primarily fueled by an increasing prevalence of surgical procedures across various specialties, a heightened awareness regarding blood conservation strategies, and advancements in medical device technology leading to more efficient and safer reinfusion systems. The rising incidence of chronic diseases, necessitating complex surgeries, also contributes substantially to market demand. Furthermore, the persistent drive in healthcare to reduce allogeneic blood transfusions, driven by cost considerations and the potential risks associated with donor blood, positions blood reinfusion systems as a critical component of modern surgical care. Innovations in automated and closed-loop systems are also enhancing efficacy and patient outcomes, further stimulating market adoption.
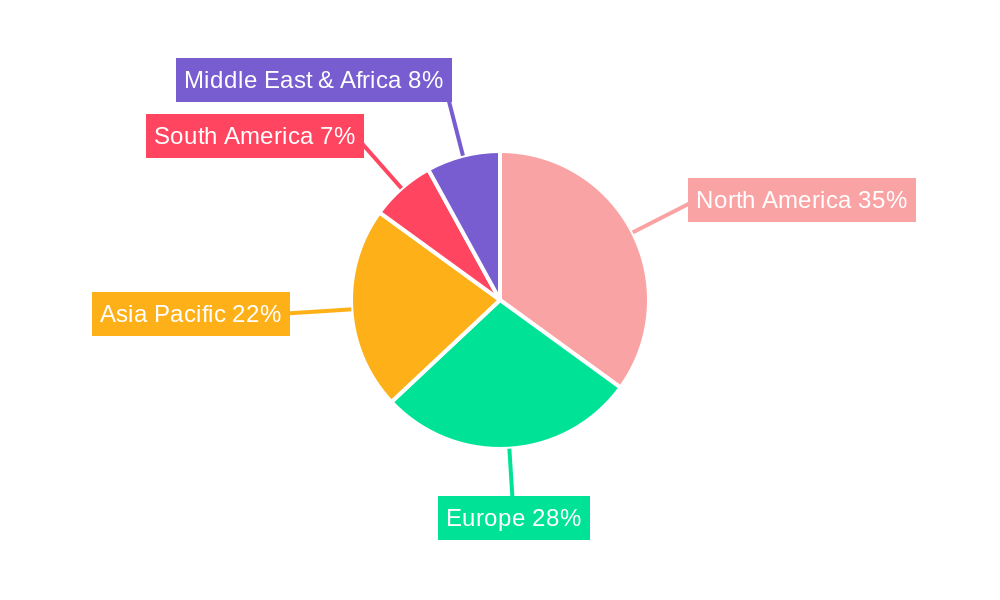
The market landscape is characterized by a strong emphasis on both intraoperative and postoperative systems, catering to the diverse needs of healthcare facilities. Hospitals represent the largest application segment, owing to their high volume of surgical interventions, followed by clinics. Geographically, North America is anticipated to lead the market, driven by sophisticated healthcare infrastructure, high adoption rates of advanced medical technologies, and favorable reimbursement policies. Asia Pacific, however, is expected to exhibit the fastest growth, propelled by expanding healthcare access, increasing investments in medical facilities, and a growing pool of patients undergoing surgical procedures. While the market demonstrates considerable promise, restraints such as the high initial cost of advanced systems and the need for specialized training for healthcare professionals could pose challenges to widespread adoption in certain regions.
Blood Reinfusion System Market Analysis: Comprehensive Report 2019–2033
This in-depth report offers a detailed examination of the global Blood Reinfusion System market, a critical segment within the healthcare industry focused on intraoperative and postoperative blood recovery and management. Covering a comprehensive study period from 2019 to 2033, with a base and estimated year of 2025, this analysis provides crucial insights for industry professionals, investors, and stakeholders. We dissect market dynamics, growth trends, regional dominance, product innovations, key drivers, challenges, and emerging opportunities, leveraging market data for the forecast period of 2025–2033. The report presents market size, market share, and CAGR values in millions of units, providing actionable intelligence for strategic decision-making in this rapidly evolving sector.
Blood Reinfusion System Market Dynamics & Structure
The global blood reinfusion system market is characterized by a moderately consolidated structure, with leading players like Zimmer Biomet, BD, Medtronic, and Fresenius Kabi holding significant market share. Technological innovation remains a primary driver, with advancements focusing on enhanced efficiency, patient safety, and ease of use. Regulatory frameworks, particularly those established by the FDA and EMA, play a crucial role in shaping market entry and product development, ensuring compliance with stringent safety and efficacy standards. Competitive product substitutes include autologous blood donation services and alternative hemostatic agents, though the inherent advantages of reinfusion systems in reducing allogeneic blood transfusions continue to drive adoption. End-user demographics are primarily influenced by the growing prevalence of surgical procedures, an aging global population, and increasing awareness regarding the benefits of blood conservation strategies in hospitals and clinics. Mergers and acquisitions (M&A) activity, while moderate, is strategically focused on consolidating market share, expanding product portfolios, and gaining access to new geographical regions.
- Market Concentration: Moderate, with a few key players dominating the landscape.
- Technological Innovation Drivers: Focus on miniaturization, automation, disposables, and integrated software solutions.
- Regulatory Frameworks: Strict FDA and EMA guidelines influencing product approval and market access.
- Competitive Product Substitutes: Autologous blood donation, hemostatic agents.
- End-User Demographics: Hospitals and clinics performing elective and emergency surgeries, particularly in cardiology, orthopedics, and general surgery.
- M&A Trends: Strategic acquisitions to enhance product offerings and market reach.
Blood Reinfusion System Growth Trends & Insights
The blood reinfusion system market is poised for robust growth, projected to witness a compound annual growth rate (CAGR) of approximately 6.5% during the forecast period of 2025–2033. This expansion is fueled by a confluence of factors, including the increasing volume of surgical procedures worldwide, a rising demand for minimally invasive techniques, and a heightened emphasis on patient blood management (PBM) protocols within healthcare institutions. The market size is estimated to reach xx million units by 2033, a significant increase from xx million units in 2024. Adoption rates for blood reinfusion systems are accelerating, driven by the demonstrable cost savings associated with reduced allogeneic blood transfusions, including lower blood procurement costs and decreased risks of transfusion-related complications. Technological disruptions are continuously shaping the market, with innovations in disposable components, automated processing, and smart connectivity enhancing user experience and operational efficiency. Consumer behavior shifts are also playing a pivotal role, as patients and healthcare providers increasingly prioritize blood conservation strategies to minimize transfusion risks and improve patient outcomes. The growing awareness of the economic burden of hospital-acquired infections and the desire for faster patient recovery post-surgery are further propelling the adoption of these advanced systems. The increasing implementation of PBM programs in hospitals, aimed at optimizing red blood cell utilization, directly translates to higher demand for effective blood reinfusion technologies.
Dominant Regions, Countries, or Segments in Blood Reinfusion System
North America currently stands as the dominant region in the global blood reinfusion system market, driven by a sophisticated healthcare infrastructure, high prevalence of complex surgical procedures, and substantial investments in medical technology innovation. The United States, in particular, accounts for a significant portion of this dominance due to its advanced healthcare systems and strong emphasis on patient blood management. The Hospital segment emerges as the leading application, representing the largest market share, owing to the concentration of surgical facilities and the extensive use of reinfusion systems in various surgical specialties such as cardiovascular, orthopedic, and general surgery. Intraoperative System applications are particularly prominent within hospitals, facilitating immediate blood recovery during surgical interventions.
- Dominant Region: North America (led by the United States).
- Key Drivers in North America:
- High per capita healthcare expenditure.
- Advanced healthcare infrastructure and technology adoption.
- Prevalence of chronic diseases and age-related conditions requiring surgery.
- Strong regulatory support and reimbursement policies for PBM.
- Leading Application Segment: Hospital.
- Key Drivers in Hospital Segment:
- High volume of surgical procedures (electives and emergencies).
- Integration of blood management programs into hospital protocols.
- Availability of advanced surgical suites equipped for reinfusion.
- Physician preference and established clinical pathways.
- Dominant Type Segment: Intraoperative System.
- Key Drivers in Intraoperative System:
- Immediate blood loss management during surgery.
- Reduced exposure to allogeneic blood.
- Improved surgical field visibility.
- Enhanced patient safety and faster recovery.
Europe follows North America, exhibiting strong growth driven by an aging population, increasing surgical volumes, and supportive healthcare policies promoting blood conservation. Asia Pacific presents the fastest-growing market, propelled by expanding healthcare expenditure, increasing access to advanced medical technologies, and a growing demand for quality healthcare services, especially in countries like China and India. The Clinic segment, while smaller than the hospital segment, is experiencing steady growth, particularly in specialized surgical centers and outpatient facilities focusing on specific procedures. The Postoperative System segment, though currently trailing Intraoperative Systems, is gaining traction due to its role in managing blood loss after surgery, improving patient recovery, and reducing the need for post-operative blood transfusions.
Blood Reinfusion System Product Landscape
The blood reinfusion system product landscape is characterized by continuous innovation focused on enhancing device performance, safety, and ease of use. Manufacturers are investing in developing advanced filtration technologies that effectively remove cellular debris, anticoagulants, and other contaminants from salvaged blood, ensuring its reinfusability and minimizing the risk of adverse reactions. Key product innovations include automated systems with integrated software for real-time monitoring of blood volume and quality, as well as disposable components designed for single-patient use to prevent cross-contamination and streamline workflow. Performance metrics are primarily centered on the efficiency of red blood cell recovery, the purity of the reinfused blood, and the overall reduction in allogeneic blood transfusions. Unique selling propositions often revolve around the system's ability to handle various blood types and volumes, its compatibility with different surgical procedures, and its contribution to cost-effectiveness for healthcare facilities by reducing reliance on donor blood.
Key Drivers, Barriers & Challenges in Blood Reinfusion System
Key Drivers:
- Increasing Volume of Surgical Procedures: A growing global population and an aging demographic lead to a higher demand for surgical interventions across various medical specialties.
- Emphasis on Patient Blood Management (PBM): Healthcare providers and regulatory bodies are increasingly promoting PBM strategies to minimize allogeneic blood transfusions, improve patient outcomes, and reduce healthcare costs.
- Technological Advancements: Innovations in filtration, automation, and disposables enhance the efficiency, safety, and ease of use of blood reinfusion systems.
- Cost-Effectiveness: Reduced reliance on allogeneic blood transfusions translates to significant cost savings for healthcare institutions, including procurement, storage, and management of donor blood.
Barriers & Challenges:
- Initial High Investment Costs: The upfront cost of purchasing sophisticated blood reinfusion systems can be a deterrent for some smaller healthcare facilities.
- Need for Trained Personnel: Effective operation and maintenance of these systems require trained medical professionals, necessitating ongoing training and education initiatives.
- Potential for Contamination: Despite advanced technologies, the risk of bacterial contamination or improper handling can pose challenges, requiring strict adherence to protocols.
- Regulatory Hurdles: Navigating complex regulatory approvals and compliance standards in different regions can be time-consuming and resource-intensive for manufacturers.
- Availability of Donor Blood: In regions with abundant and inexpensive donor blood, the perceived necessity for reinfusion systems might be lower, posing a competitive challenge.
Emerging Opportunities in Blood Reinfusion System
The blood reinfusion system market presents significant emerging opportunities. The increasing adoption of minimally invasive surgical techniques, which often lead to less blood loss, still benefits from efficient reinfusion for optimal patient recovery. Furthermore, the expanding healthcare infrastructure in emerging economies in Asia Pacific and Latin America offers untapped markets for blood reinfusion systems as these regions invest in advanced medical technologies. The development of more portable and user-friendly systems catering to smaller clinics and remote healthcare settings also represents a growing niche. Additionally, advancements in materials science could lead to more biocompatible and cost-effective disposable components, further driving adoption. The integration of artificial intelligence and machine learning for real-time blood quality assessment and predictive analytics for transfusion needs is another promising avenue.
Growth Accelerators in the Blood Reinfusion System Industry
Long-term growth in the blood reinfusion system industry will be significantly propelled by continuous technological breakthroughs, particularly in areas of automation, miniaturization, and enhanced filtration efficiency. Strategic partnerships between system manufacturers and medical device distributors will be crucial for expanding market reach, especially in underserved regions. Furthermore, the increasing focus on value-based healthcare models will incentivize the adoption of technologies that demonstrably improve patient outcomes and reduce overall healthcare expenditure. Proactive engagement with regulatory bodies to streamline approval processes and the development of standardized training programs for healthcare professionals will also act as significant growth accelerators. The growing body of clinical evidence highlighting the efficacy and safety of blood reinfusion systems will further solidify their position in surgical care protocols.
Key Players Shaping the Blood Reinfusion System Market
- Zimmer Biomet
- BD
- 3T Medical
- Medtronic
- Fresenius Kabi
- LivaNova
- Haemonetics
- Sorin Group
Notable Milestones in Blood Reinfusion System Sector
- 2021: Launch of next-generation automated blood salvage systems with enhanced safety features and improved efficiency in cell recovery.
- 2022: Increased adoption of disposable components, driven by a focus on infection control and reduced reprocessing costs.
- 2023: Key manufacturers invest heavily in R&D for AI-powered blood analysis and quality control within reinfusion systems.
- 2024: Growing emphasis on integrated patient blood management (PBM) platforms, including blood reinfusion as a core component, by major healthcare networks.
- 2025: Introduction of more compact and portable reinfusion systems designed for diverse clinical settings, including specialized clinics.
In-Depth Blood Reinfusion System Market Outlook
The outlook for the blood reinfusion system market remains exceptionally strong, driven by an escalating global demand for efficient blood conservation strategies in surgical settings. Growth accelerators, including relentless technological innovation, strategic market expansion initiatives by key players, and the increasing adoption of value-based healthcare, are set to fuel sustained market expansion. The rising awareness of the benefits of autologous blood reinfusion in terms of patient safety, improved outcomes, and significant cost savings will further bolster demand. Opportunities lie in catering to the burgeoning healthcare markets in developing economies and in innovating for niche applications. The continued focus on improving the user experience and ensuring the highest standards of safety and efficacy will define the future trajectory of this vital segment of medical technology.
Blood Reinfusion System Segmentation
-
1. Application
- 1.1. Hospital
- 1.2. Clinic
- 1.3. Others
-
2. Types
- 2.1. Intraoperative System
- 2.2. Postoperative System
Blood Reinfusion System Segmentation By Geography
-
1. North America
- 1.1. United States
- 1.2. Canada
- 1.3. Mexico
-
2. South America
- 2.1. Brazil
- 2.2. Argentina
- 2.3. Rest of South America
-
3. Europe
- 3.1. United Kingdom
- 3.2. Germany
- 3.3. France
- 3.4. Italy
- 3.5. Spain
- 3.6. Russia
- 3.7. Benelux
- 3.8. Nordics
- 3.9. Rest of Europe
-
4. Middle East & Africa
- 4.1. Turkey
- 4.2. Israel
- 4.3. GCC
- 4.4. North Africa
- 4.5. South Africa
- 4.6. Rest of Middle East & Africa
-
5. Asia Pacific
- 5.1. China
- 5.2. India
- 5.3. Japan
- 5.4. South Korea
- 5.5. ASEAN
- 5.6. Oceania
- 5.7. Rest of Asia Pacific
Blood Reinfusion System REPORT HIGHLIGHTS
| Aspects | Details |
|---|---|
| Study Period | 2019-2033 |
| Base Year | 2024 |
| Estimated Year | 2025 |
| Forecast Period | 2025-2033 |
| Historical Period | 2019-2024 |
| Growth Rate | CAGR of XX% from 2019-2033 |
| Segmentation |
|
Table of Contents
- 1. Introduction
- 1.1. Research Scope
- 1.2. Market Segmentation
- 1.3. Research Methodology
- 1.4. Definitions and Assumptions
- 2. Executive Summary
- 2.1. Introduction
- 3. Market Dynamics
- 3.1. Introduction
- 3.2. Market Drivers
- 3.3. Market Restrains
- 3.4. Market Trends
- 4. Market Factor Analysis
- 4.1. Porters Five Forces
- 4.2. Supply/Value Chain
- 4.3. PESTEL analysis
- 4.4. Market Entropy
- 4.5. Patent/Trademark Analysis
- 5. Global Blood Reinfusion System Analysis, Insights and Forecast, 2019-2031
- 5.1. Market Analysis, Insights and Forecast - by Application
- 5.1.1. Hospital
- 5.1.2. Clinic
- 5.1.3. Others
- 5.2. Market Analysis, Insights and Forecast - by Types
- 5.2.1. Intraoperative System
- 5.2.2. Postoperative System
- 5.3. Market Analysis, Insights and Forecast - by Region
- 5.3.1. North America
- 5.3.2. South America
- 5.3.3. Europe
- 5.3.4. Middle East & Africa
- 5.3.5. Asia Pacific
- 5.1. Market Analysis, Insights and Forecast - by Application
- 6. North America Blood Reinfusion System Analysis, Insights and Forecast, 2019-2031
- 6.1. Market Analysis, Insights and Forecast - by Application
- 6.1.1. Hospital
- 6.1.2. Clinic
- 6.1.3. Others
- 6.2. Market Analysis, Insights and Forecast - by Types
- 6.2.1. Intraoperative System
- 6.2.2. Postoperative System
- 6.1. Market Analysis, Insights and Forecast - by Application
- 7. South America Blood Reinfusion System Analysis, Insights and Forecast, 2019-2031
- 7.1. Market Analysis, Insights and Forecast - by Application
- 7.1.1. Hospital
- 7.1.2. Clinic
- 7.1.3. Others
- 7.2. Market Analysis, Insights and Forecast - by Types
- 7.2.1. Intraoperative System
- 7.2.2. Postoperative System
- 7.1. Market Analysis, Insights and Forecast - by Application
- 8. Europe Blood Reinfusion System Analysis, Insights and Forecast, 2019-2031
- 8.1. Market Analysis, Insights and Forecast - by Application
- 8.1.1. Hospital
- 8.1.2. Clinic
- 8.1.3. Others
- 8.2. Market Analysis, Insights and Forecast - by Types
- 8.2.1. Intraoperative System
- 8.2.2. Postoperative System
- 8.1. Market Analysis, Insights and Forecast - by Application
- 9. Middle East & Africa Blood Reinfusion System Analysis, Insights and Forecast, 2019-2031
- 9.1. Market Analysis, Insights and Forecast - by Application
- 9.1.1. Hospital
- 9.1.2. Clinic
- 9.1.3. Others
- 9.2. Market Analysis, Insights and Forecast - by Types
- 9.2.1. Intraoperative System
- 9.2.2. Postoperative System
- 9.1. Market Analysis, Insights and Forecast - by Application
- 10. Asia Pacific Blood Reinfusion System Analysis, Insights and Forecast, 2019-2031
- 10.1. Market Analysis, Insights and Forecast - by Application
- 10.1.1. Hospital
- 10.1.2. Clinic
- 10.1.3. Others
- 10.2. Market Analysis, Insights and Forecast - by Types
- 10.2.1. Intraoperative System
- 10.2.2. Postoperative System
- 10.1. Market Analysis, Insights and Forecast - by Application
- 11. Competitive Analysis
- 11.1. Global Market Share Analysis 2024
- 11.2. Company Profiles
- 11.2.1 Zimmer Biomet
- 11.2.1.1. Overview
- 11.2.1.2. Products
- 11.2.1.3. SWOT Analysis
- 11.2.1.4. Recent Developments
- 11.2.1.5. Financials (Based on Availability)
- 11.2.2 BD
- 11.2.2.1. Overview
- 11.2.2.2. Products
- 11.2.2.3. SWOT Analysis
- 11.2.2.4. Recent Developments
- 11.2.2.5. Financials (Based on Availability)
- 11.2.3 3T Medical
- 11.2.3.1. Overview
- 11.2.3.2. Products
- 11.2.3.3. SWOT Analysis
- 11.2.3.4. Recent Developments
- 11.2.3.5. Financials (Based on Availability)
- 11.2.4 Medtronic
- 11.2.4.1. Overview
- 11.2.4.2. Products
- 11.2.4.3. SWOT Analysis
- 11.2.4.4. Recent Developments
- 11.2.4.5. Financials (Based on Availability)
- 11.2.5 Fresenius Kabi
- 11.2.5.1. Overview
- 11.2.5.2. Products
- 11.2.5.3. SWOT Analysis
- 11.2.5.4. Recent Developments
- 11.2.5.5. Financials (Based on Availability)
- 11.2.6 LivaNova
- 11.2.6.1. Overview
- 11.2.6.2. Products
- 11.2.6.3. SWOT Analysis
- 11.2.6.4. Recent Developments
- 11.2.6.5. Financials (Based on Availability)
- 11.2.7 Haemonetics
- 11.2.7.1. Overview
- 11.2.7.2. Products
- 11.2.7.3. SWOT Analysis
- 11.2.7.4. Recent Developments
- 11.2.7.5. Financials (Based on Availability)
- 11.2.8 Sorin Group
- 11.2.8.1. Overview
- 11.2.8.2. Products
- 11.2.8.3. SWOT Analysis
- 11.2.8.4. Recent Developments
- 11.2.8.5. Financials (Based on Availability)
- 11.2.1 Zimmer Biomet
List of Figures
- Figure 1: Global Blood Reinfusion System Revenue Breakdown (million, %) by Region 2024 & 2032
- Figure 2: Global Blood Reinfusion System Volume Breakdown (K, %) by Region 2024 & 2032
- Figure 3: North America Blood Reinfusion System Revenue (million), by Application 2024 & 2032
- Figure 4: North America Blood Reinfusion System Volume (K), by Application 2024 & 2032
- Figure 5: North America Blood Reinfusion System Revenue Share (%), by Application 2024 & 2032
- Figure 6: North America Blood Reinfusion System Volume Share (%), by Application 2024 & 2032
- Figure 7: North America Blood Reinfusion System Revenue (million), by Types 2024 & 2032
- Figure 8: North America Blood Reinfusion System Volume (K), by Types 2024 & 2032
- Figure 9: North America Blood Reinfusion System Revenue Share (%), by Types 2024 & 2032
- Figure 10: North America Blood Reinfusion System Volume Share (%), by Types 2024 & 2032
- Figure 11: North America Blood Reinfusion System Revenue (million), by Country 2024 & 2032
- Figure 12: North America Blood Reinfusion System Volume (K), by Country 2024 & 2032
- Figure 13: North America Blood Reinfusion System Revenue Share (%), by Country 2024 & 2032
- Figure 14: North America Blood Reinfusion System Volume Share (%), by Country 2024 & 2032
- Figure 15: South America Blood Reinfusion System Revenue (million), by Application 2024 & 2032
- Figure 16: South America Blood Reinfusion System Volume (K), by Application 2024 & 2032
- Figure 17: South America Blood Reinfusion System Revenue Share (%), by Application 2024 & 2032
- Figure 18: South America Blood Reinfusion System Volume Share (%), by Application 2024 & 2032
- Figure 19: South America Blood Reinfusion System Revenue (million), by Types 2024 & 2032
- Figure 20: South America Blood Reinfusion System Volume (K), by Types 2024 & 2032
- Figure 21: South America Blood Reinfusion System Revenue Share (%), by Types 2024 & 2032
- Figure 22: South America Blood Reinfusion System Volume Share (%), by Types 2024 & 2032
- Figure 23: South America Blood Reinfusion System Revenue (million), by Country 2024 & 2032
- Figure 24: South America Blood Reinfusion System Volume (K), by Country 2024 & 2032
- Figure 25: South America Blood Reinfusion System Revenue Share (%), by Country 2024 & 2032
- Figure 26: South America Blood Reinfusion System Volume Share (%), by Country 2024 & 2032
- Figure 27: Europe Blood Reinfusion System Revenue (million), by Application 2024 & 2032
- Figure 28: Europe Blood Reinfusion System Volume (K), by Application 2024 & 2032
- Figure 29: Europe Blood Reinfusion System Revenue Share (%), by Application 2024 & 2032
- Figure 30: Europe Blood Reinfusion System Volume Share (%), by Application 2024 & 2032
- Figure 31: Europe Blood Reinfusion System Revenue (million), by Types 2024 & 2032
- Figure 32: Europe Blood Reinfusion System Volume (K), by Types 2024 & 2032
- Figure 33: Europe Blood Reinfusion System Revenue Share (%), by Types 2024 & 2032
- Figure 34: Europe Blood Reinfusion System Volume Share (%), by Types 2024 & 2032
- Figure 35: Europe Blood Reinfusion System Revenue (million), by Country 2024 & 2032
- Figure 36: Europe Blood Reinfusion System Volume (K), by Country 2024 & 2032
- Figure 37: Europe Blood Reinfusion System Revenue Share (%), by Country 2024 & 2032
- Figure 38: Europe Blood Reinfusion System Volume Share (%), by Country 2024 & 2032
- Figure 39: Middle East & Africa Blood Reinfusion System Revenue (million), by Application 2024 & 2032
- Figure 40: Middle East & Africa Blood Reinfusion System Volume (K), by Application 2024 & 2032
- Figure 41: Middle East & Africa Blood Reinfusion System Revenue Share (%), by Application 2024 & 2032
- Figure 42: Middle East & Africa Blood Reinfusion System Volume Share (%), by Application 2024 & 2032
- Figure 43: Middle East & Africa Blood Reinfusion System Revenue (million), by Types 2024 & 2032
- Figure 44: Middle East & Africa Blood Reinfusion System Volume (K), by Types 2024 & 2032
- Figure 45: Middle East & Africa Blood Reinfusion System Revenue Share (%), by Types 2024 & 2032
- Figure 46: Middle East & Africa Blood Reinfusion System Volume Share (%), by Types 2024 & 2032
- Figure 47: Middle East & Africa Blood Reinfusion System Revenue (million), by Country 2024 & 2032
- Figure 48: Middle East & Africa Blood Reinfusion System Volume (K), by Country 2024 & 2032
- Figure 49: Middle East & Africa Blood Reinfusion System Revenue Share (%), by Country 2024 & 2032
- Figure 50: Middle East & Africa Blood Reinfusion System Volume Share (%), by Country 2024 & 2032
- Figure 51: Asia Pacific Blood Reinfusion System Revenue (million), by Application 2024 & 2032
- Figure 52: Asia Pacific Blood Reinfusion System Volume (K), by Application 2024 & 2032
- Figure 53: Asia Pacific Blood Reinfusion System Revenue Share (%), by Application 2024 & 2032
- Figure 54: Asia Pacific Blood Reinfusion System Volume Share (%), by Application 2024 & 2032
- Figure 55: Asia Pacific Blood Reinfusion System Revenue (million), by Types 2024 & 2032
- Figure 56: Asia Pacific Blood Reinfusion System Volume (K), by Types 2024 & 2032
- Figure 57: Asia Pacific Blood Reinfusion System Revenue Share (%), by Types 2024 & 2032
- Figure 58: Asia Pacific Blood Reinfusion System Volume Share (%), by Types 2024 & 2032
- Figure 59: Asia Pacific Blood Reinfusion System Revenue (million), by Country 2024 & 2032
- Figure 60: Asia Pacific Blood Reinfusion System Volume (K), by Country 2024 & 2032
- Figure 61: Asia Pacific Blood Reinfusion System Revenue Share (%), by Country 2024 & 2032
- Figure 62: Asia Pacific Blood Reinfusion System Volume Share (%), by Country 2024 & 2032
List of Tables
- Table 1: Global Blood Reinfusion System Revenue million Forecast, by Region 2019 & 2032
- Table 2: Global Blood Reinfusion System Volume K Forecast, by Region 2019 & 2032
- Table 3: Global Blood Reinfusion System Revenue million Forecast, by Application 2019 & 2032
- Table 4: Global Blood Reinfusion System Volume K Forecast, by Application 2019 & 2032
- Table 5: Global Blood Reinfusion System Revenue million Forecast, by Types 2019 & 2032
- Table 6: Global Blood Reinfusion System Volume K Forecast, by Types 2019 & 2032
- Table 7: Global Blood Reinfusion System Revenue million Forecast, by Region 2019 & 2032
- Table 8: Global Blood Reinfusion System Volume K Forecast, by Region 2019 & 2032
- Table 9: Global Blood Reinfusion System Revenue million Forecast, by Application 2019 & 2032
- Table 10: Global Blood Reinfusion System Volume K Forecast, by Application 2019 & 2032
- Table 11: Global Blood Reinfusion System Revenue million Forecast, by Types 2019 & 2032
- Table 12: Global Blood Reinfusion System Volume K Forecast, by Types 2019 & 2032
- Table 13: Global Blood Reinfusion System Revenue million Forecast, by Country 2019 & 2032
- Table 14: Global Blood Reinfusion System Volume K Forecast, by Country 2019 & 2032
- Table 15: United States Blood Reinfusion System Revenue (million) Forecast, by Application 2019 & 2032
- Table 16: United States Blood Reinfusion System Volume (K) Forecast, by Application 2019 & 2032
- Table 17: Canada Blood Reinfusion System Revenue (million) Forecast, by Application 2019 & 2032
- Table 18: Canada Blood Reinfusion System Volume (K) Forecast, by Application 2019 & 2032
- Table 19: Mexico Blood Reinfusion System Revenue (million) Forecast, by Application 2019 & 2032
- Table 20: Mexico Blood Reinfusion System Volume (K) Forecast, by Application 2019 & 2032
- Table 21: Global Blood Reinfusion System Revenue million Forecast, by Application 2019 & 2032
- Table 22: Global Blood Reinfusion System Volume K Forecast, by Application 2019 & 2032
- Table 23: Global Blood Reinfusion System Revenue million Forecast, by Types 2019 & 2032
- Table 24: Global Blood Reinfusion System Volume K Forecast, by Types 2019 & 2032
- Table 25: Global Blood Reinfusion System Revenue million Forecast, by Country 2019 & 2032
- Table 26: Global Blood Reinfusion System Volume K Forecast, by Country 2019 & 2032
- Table 27: Brazil Blood Reinfusion System Revenue (million) Forecast, by Application 2019 & 2032
- Table 28: Brazil Blood Reinfusion System Volume (K) Forecast, by Application 2019 & 2032
- Table 29: Argentina Blood Reinfusion System Revenue (million) Forecast, by Application 2019 & 2032
- Table 30: Argentina Blood Reinfusion System Volume (K) Forecast, by Application 2019 & 2032
- Table 31: Rest of South America Blood Reinfusion System Revenue (million) Forecast, by Application 2019 & 2032
- Table 32: Rest of South America Blood Reinfusion System Volume (K) Forecast, by Application 2019 & 2032
- Table 33: Global Blood Reinfusion System Revenue million Forecast, by Application 2019 & 2032
- Table 34: Global Blood Reinfusion System Volume K Forecast, by Application 2019 & 2032
- Table 35: Global Blood Reinfusion System Revenue million Forecast, by Types 2019 & 2032
- Table 36: Global Blood Reinfusion System Volume K Forecast, by Types 2019 & 2032
- Table 37: Global Blood Reinfusion System Revenue million Forecast, by Country 2019 & 2032
- Table 38: Global Blood Reinfusion System Volume K Forecast, by Country 2019 & 2032
- Table 39: United Kingdom Blood Reinfusion System Revenue (million) Forecast, by Application 2019 & 2032
- Table 40: United Kingdom Blood Reinfusion System Volume (K) Forecast, by Application 2019 & 2032
- Table 41: Germany Blood Reinfusion System Revenue (million) Forecast, by Application 2019 & 2032
- Table 42: Germany Blood Reinfusion System Volume (K) Forecast, by Application 2019 & 2032
- Table 43: France Blood Reinfusion System Revenue (million) Forecast, by Application 2019 & 2032
- Table 44: France Blood Reinfusion System Volume (K) Forecast, by Application 2019 & 2032
- Table 45: Italy Blood Reinfusion System Revenue (million) Forecast, by Application 2019 & 2032
- Table 46: Italy Blood Reinfusion System Volume (K) Forecast, by Application 2019 & 2032
- Table 47: Spain Blood Reinfusion System Revenue (million) Forecast, by Application 2019 & 2032
- Table 48: Spain Blood Reinfusion System Volume (K) Forecast, by Application 2019 & 2032
- Table 49: Russia Blood Reinfusion System Revenue (million) Forecast, by Application 2019 & 2032
- Table 50: Russia Blood Reinfusion System Volume (K) Forecast, by Application 2019 & 2032
- Table 51: Benelux Blood Reinfusion System Revenue (million) Forecast, by Application 2019 & 2032
- Table 52: Benelux Blood Reinfusion System Volume (K) Forecast, by Application 2019 & 2032
- Table 53: Nordics Blood Reinfusion System Revenue (million) Forecast, by Application 2019 & 2032
- Table 54: Nordics Blood Reinfusion System Volume (K) Forecast, by Application 2019 & 2032
- Table 55: Rest of Europe Blood Reinfusion System Revenue (million) Forecast, by Application 2019 & 2032
- Table 56: Rest of Europe Blood Reinfusion System Volume (K) Forecast, by Application 2019 & 2032
- Table 57: Global Blood Reinfusion System Revenue million Forecast, by Application 2019 & 2032
- Table 58: Global Blood Reinfusion System Volume K Forecast, by Application 2019 & 2032
- Table 59: Global Blood Reinfusion System Revenue million Forecast, by Types 2019 & 2032
- Table 60: Global Blood Reinfusion System Volume K Forecast, by Types 2019 & 2032
- Table 61: Global Blood Reinfusion System Revenue million Forecast, by Country 2019 & 2032
- Table 62: Global Blood Reinfusion System Volume K Forecast, by Country 2019 & 2032
- Table 63: Turkey Blood Reinfusion System Revenue (million) Forecast, by Application 2019 & 2032
- Table 64: Turkey Blood Reinfusion System Volume (K) Forecast, by Application 2019 & 2032
- Table 65: Israel Blood Reinfusion System Revenue (million) Forecast, by Application 2019 & 2032
- Table 66: Israel Blood Reinfusion System Volume (K) Forecast, by Application 2019 & 2032
- Table 67: GCC Blood Reinfusion System Revenue (million) Forecast, by Application 2019 & 2032
- Table 68: GCC Blood Reinfusion System Volume (K) Forecast, by Application 2019 & 2032
- Table 69: North Africa Blood Reinfusion System Revenue (million) Forecast, by Application 2019 & 2032
- Table 70: North Africa Blood Reinfusion System Volume (K) Forecast, by Application 2019 & 2032
- Table 71: South Africa Blood Reinfusion System Revenue (million) Forecast, by Application 2019 & 2032
- Table 72: South Africa Blood Reinfusion System Volume (K) Forecast, by Application 2019 & 2032
- Table 73: Rest of Middle East & Africa Blood Reinfusion System Revenue (million) Forecast, by Application 2019 & 2032
- Table 74: Rest of Middle East & Africa Blood Reinfusion System Volume (K) Forecast, by Application 2019 & 2032
- Table 75: Global Blood Reinfusion System Revenue million Forecast, by Application 2019 & 2032
- Table 76: Global Blood Reinfusion System Volume K Forecast, by Application 2019 & 2032
- Table 77: Global Blood Reinfusion System Revenue million Forecast, by Types 2019 & 2032
- Table 78: Global Blood Reinfusion System Volume K Forecast, by Types 2019 & 2032
- Table 79: Global Blood Reinfusion System Revenue million Forecast, by Country 2019 & 2032
- Table 80: Global Blood Reinfusion System Volume K Forecast, by Country 2019 & 2032
- Table 81: China Blood Reinfusion System Revenue (million) Forecast, by Application 2019 & 2032
- Table 82: China Blood Reinfusion System Volume (K) Forecast, by Application 2019 & 2032
- Table 83: India Blood Reinfusion System Revenue (million) Forecast, by Application 2019 & 2032
- Table 84: India Blood Reinfusion System Volume (K) Forecast, by Application 2019 & 2032
- Table 85: Japan Blood Reinfusion System Revenue (million) Forecast, by Application 2019 & 2032
- Table 86: Japan Blood Reinfusion System Volume (K) Forecast, by Application 2019 & 2032
- Table 87: South Korea Blood Reinfusion System Revenue (million) Forecast, by Application 2019 & 2032
- Table 88: South Korea Blood Reinfusion System Volume (K) Forecast, by Application 2019 & 2032
- Table 89: ASEAN Blood Reinfusion System Revenue (million) Forecast, by Application 2019 & 2032
- Table 90: ASEAN Blood Reinfusion System Volume (K) Forecast, by Application 2019 & 2032
- Table 91: Oceania Blood Reinfusion System Revenue (million) Forecast, by Application 2019 & 2032
- Table 92: Oceania Blood Reinfusion System Volume (K) Forecast, by Application 2019 & 2032
- Table 93: Rest of Asia Pacific Blood Reinfusion System Revenue (million) Forecast, by Application 2019 & 2032
- Table 94: Rest of Asia Pacific Blood Reinfusion System Volume (K) Forecast, by Application 2019 & 2032
Frequently Asked Questions
1. What is the projected Compound Annual Growth Rate (CAGR) of the Blood Reinfusion System?
The projected CAGR is approximately XX%.
2. Which companies are prominent players in the Blood Reinfusion System?
Key companies in the market include Zimmer Biomet, BD, 3T Medical, Medtronic, Fresenius Kabi, LivaNova, Haemonetics, Sorin Group.
3. What are the main segments of the Blood Reinfusion System?
The market segments include Application, Types.
4. Can you provide details about the market size?
The market size is estimated to be USD XXX million as of 2022.
5. What are some drivers contributing to market growth?
N/A
6. What are the notable trends driving market growth?
N/A
7. Are there any restraints impacting market growth?
N/A
8. Can you provide examples of recent developments in the market?
N/A
9. What pricing options are available for accessing the report?
Pricing options include single-user, multi-user, and enterprise licenses priced at USD 3350.00, USD 5025.00, and USD 6700.00 respectively.
10. Is the market size provided in terms of value or volume?
The market size is provided in terms of value, measured in million and volume, measured in K.
11. Are there any specific market keywords associated with the report?
Yes, the market keyword associated with the report is "Blood Reinfusion System," which aids in identifying and referencing the specific market segment covered.
12. How do I determine which pricing option suits my needs best?
The pricing options vary based on user requirements and access needs. Individual users may opt for single-user licenses, while businesses requiring broader access may choose multi-user or enterprise licenses for cost-effective access to the report.
13. Are there any additional resources or data provided in the Blood Reinfusion System report?
While the report offers comprehensive insights, it's advisable to review the specific contents or supplementary materials provided to ascertain if additional resources or data are available.
14. How can I stay updated on further developments or reports in the Blood Reinfusion System?
To stay informed about further developments, trends, and reports in the Blood Reinfusion System, consider subscribing to industry newsletters, following relevant companies and organizations, or regularly checking reputable industry news sources and publications.
Methodology
Step 1 - Identification of Relevant Samples Size from Population Database


Step 2 - Approaches for Defining Global Market Size (Value, Volume* & Price*)

Note*: In applicable scenarios
Step 3 - Data Sources
Primary Research
- Web Analytics
- Survey Reports
- Research Institute
- Latest Research Reports
- Opinion Leaders
Secondary Research
- Annual Reports
- White Paper
- Latest Press Release
- Industry Association
- Paid Database
- Investor Presentations

Step 4 - Data Triangulation
Involves using different sources of information in order to increase the validity of a study
These sources are likely to be stakeholders in a program - participants, other researchers, program staff, other community members, and so on.
Then we put all data in single framework & apply various statistical tools to find out the dynamic on the market.
During the analysis stage, feedback from the stakeholder groups would be compared to determine areas of agreement as well as areas of divergence
