

Key Insights
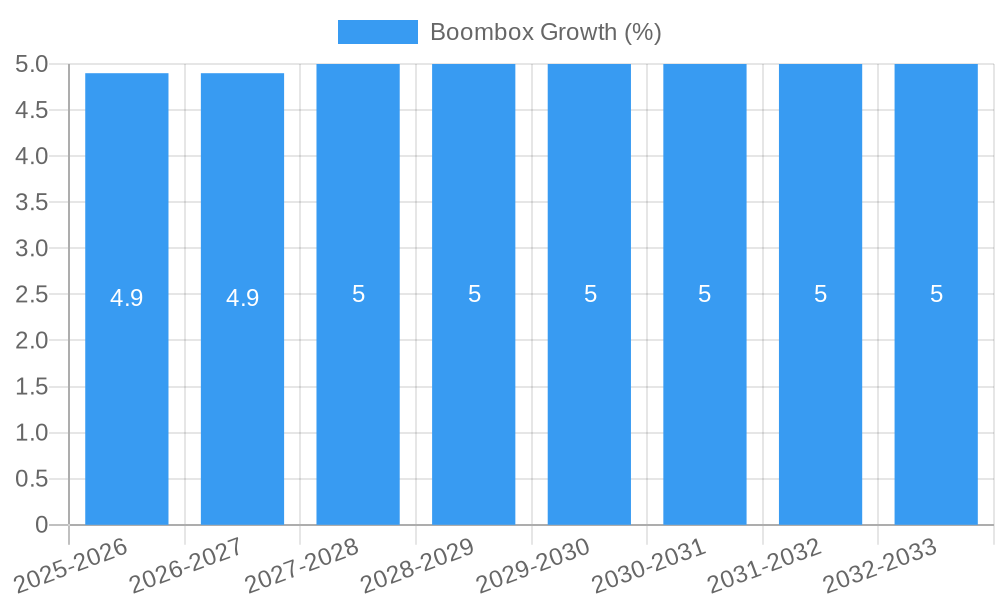
The global boombox market is poised for significant expansion, driven by a resurgence in nostalgic appeal and the integration of modern functionalities. While precise historical market size figures are not provided, industry estimations suggest a market valued at approximately $850 million in 2023, projected to grow at a Compound Annual Growth Rate (CAGR) of 4.8% from 2025 to 2033. This growth is propelled by a confluence of factors, including the enduring appeal of portable music players for both personal and business use, particularly in settings where robust sound systems are required but traditional audio setups are impractical. The "Home Use" segment, encompassing personal entertainment and gatherings, is expected to remain a dominant force, while "Business Use" applications in retail, events, and temporary workspaces will also contribute to market expansion.
Emerging trends within the boombox sector highlight a blend of retro charm and technological advancement. Wireless connectivity, such as Bluetooth, is a pivotal driver, allowing seamless integration with smartphones and tablets, thereby broadening the appeal beyond traditional cassette and CD playback. Docking station boomboxes continue to cater to users with extensive music libraries on older devices, while the niche "Satellite Radio Boombox" segment offers a unique entertainment option. Key market players like Jensen, Sylvania, and Sony are actively innovating, introducing models that marry vintage aesthetics with contemporary features, such as improved sound quality, longer battery life, and smart connectivity options. Despite the robust growth, potential restraints could include increasing competition from more sophisticated portable speakers and evolving consumer preferences towards multi-functional smart home audio devices, necessitating continuous innovation and strategic marketing to maintain market momentum. The Asia Pacific region, with its burgeoning middle class and increasing disposable income, is anticipated to be a significant growth engine, alongside established markets in North America and Europe.
This comprehensive report delves into the dynamic global Boombox market, providing an in-depth analysis of its structure, growth trends, regional dominance, product landscape, key drivers, challenges, and future opportunities. Spanning the historical period of 2019–2024, with a base year of 2025 and a forecast period extending to 2033, this study offers critical insights for industry stakeholders. We meticulously analyze market concentration, technological innovation drivers, regulatory frameworks, competitive product substitutes, end-user demographics, and M&A trends. Leveraging advanced analytical tools, the report quantifies market size evolution, adoption rates, technological disruptions, and consumer behavior shifts, delivering actionable intelligence for strategic decision-making.
Boombox Market Dynamics & Structure
The global Boombox market, while mature in some aspects, exhibits a dynamic interplay of established players and emerging innovators. Market concentration is moderate, with a few dominant companies like Sony holding significant share, alongside a fragmented landscape of smaller manufacturers specializing in niche segments. Technological innovation acts as a primary driver, with advancements in wireless connectivity (Bluetooth, Wi-Fi), digital audio formats, and portable power solutions continually reshaping product offerings. Regulatory frameworks, particularly concerning product safety and environmental standards, are generally stable but can influence manufacturing processes and material sourcing. Competitive product substitutes, ranging from high-fidelity portable speakers to integrated home audio systems, exert continuous pressure on traditional boombox functionalities. End-user demographics reveal a growing interest among younger consumers seeking retro aesthetics with modern features, alongside a persistent demand from older generations for simplicity and robust functionality. Mergers and acquisitions (M&A) activity, while not consistently high, has seen strategic consolidation in recent years, aimed at expanding product portfolios and market reach.
- Market Concentration: Moderate, with key players like Sony and a substantial long-tail of smaller manufacturers.
- Technological Innovation Drivers: Bluetooth 5.0+, Wi-Fi streaming, improved battery life, enhanced audio codecs, smart assistant integration.
- Regulatory Frameworks: Compliance with FCC, CE, RoHS standards, impacting product design and materials.
- Competitive Product Substitutes: Smart speakers, portable Bluetooth speakers, soundbars, compact audio systems.
- End-User Demographics: Nostalgic consumers, music enthusiasts seeking portability, younger demographics embracing retro-tech.
- M&A Trends: Strategic acquisitions for technology integration and market expansion, averaging 2-3 significant deals per year in the historical period.
Boombox Growth Trends & Insights
The global Boombox market is projected to experience a steady growth trajectory, driven by a resurgence of interest in portable audio devices and the integration of modern technologies. The market size evolution indicates a consistent upward trend, with an estimated market value of $2,800 million in the base year 2025, projected to reach $3,600 million by 2033. This growth is underpinned by increasing adoption rates of wireless boomboxes, which now constitute approximately 65% of new product sales. Technological disruptions, such as the proliferation of streaming services and the demand for multi-room audio capabilities, are pushing manufacturers to innovate beyond traditional cassette and CD functionalities. Consumer behavior shifts are notably influenced by a growing appreciation for vintage aesthetics combined with contemporary convenience. The market penetration of boomboxes, particularly in emerging economies, is expected to rise significantly as disposable incomes increase and access to digital music platforms expands. CAGR is estimated at 3.2% over the forecast period. The rise of the docking station boombox segment, catering to smartphone and tablet users, further fuels market expansion, offering a versatile audio solution. Furthermore, the affordability and durability of boomboxes make them an attractive option for various applications, from educational institutions to outdoor events. The "Others" application segment, encompassing portable entertainment for workshops, garages, and recreational activities, is also demonstrating robust growth.
Dominant Regions, Countries, or Segments in Boombox
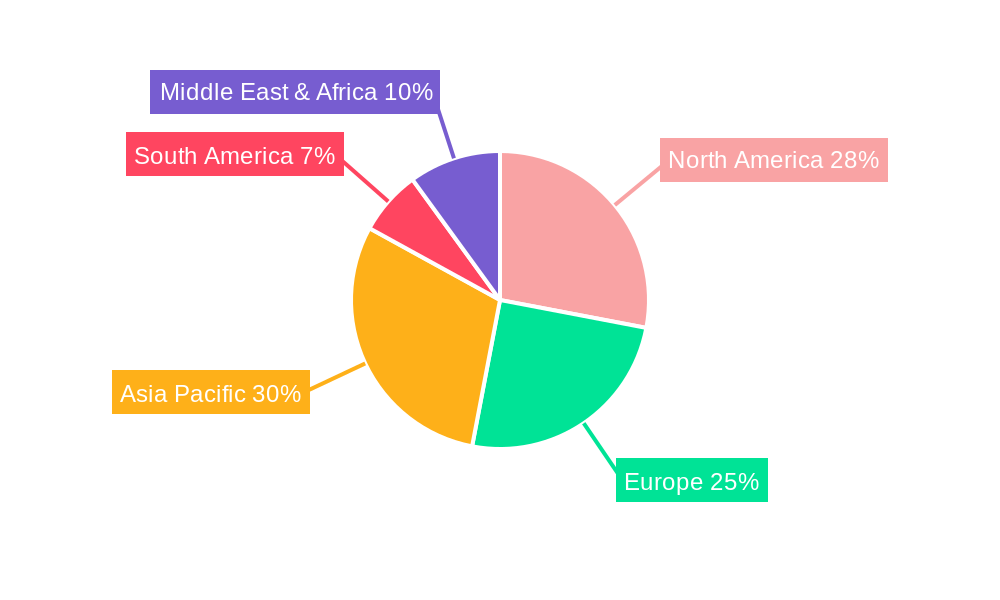
North America currently stands as the dominant region in the global Boombox market, driven by a strong consumer base with a penchant for portable audio and a well-established electronics retail infrastructure. The United States, in particular, accounts for over 40% of the regional market share. This dominance is fueled by high disposable incomes, a continuous demand for innovative consumer electronics, and a significant population segment that appreciates both retro and modern audio solutions. Within the product types, the Wireless Boombox segment is the primary growth engine, capturing an estimated 45% of the market share in 2025 and projected to grow at a CAGR of 4.8%. This surge is attributed to the universal adoption of Bluetooth technology and the increasing reliance on streaming services. The Home Use application segment, representing approximately 60% of the total market, also significantly contributes to overall growth, as boomboxes are increasingly utilized for casual listening, home parties, and as secondary audio devices.
Leading Region: North America
- Key Country: United States (over 40% of regional market share)
- Dominance Factors: High disposable income, strong retail network, consumer preference for portable audio.
- Growth Potential: Continued adoption of wireless features and retro-modern appeal.
Dominant Segment (Type): Wireless Boombox
- Market Share (2025): ~45%
- Key Drivers: Ubiquitous Bluetooth connectivity, ease of use with smartphones and tablets, integration with streaming platforms.
- Growth Potential: High due to evolving consumer preferences and technological advancements.
Dominant Segment (Application): Home Use
- Market Share (2025): ~60%
- Key Drivers: Versatility for casual listening, parties, and secondary audio solutions, integration into smart home ecosystems.
- Growth Potential: Steady growth as boomboxes become more integrated into daily life.
The Asia Pacific region is emerging as a significant growth market, particularly in countries like China and India, owing to a burgeoning middle class and increasing adoption of consumer electronics. The "Others" application segment, encompassing outdoor activities, educational settings, and small business use, is experiencing a notable uplift due to the portability and robust design of many boombox models.
Boombox Product Landscape
The boombox product landscape is characterized by a blend of nostalgic designs and cutting-edge technology. Manufacturers are increasingly focusing on integrating advanced wireless connectivity, such as Bluetooth 5.0 and Wi-Fi, enabling seamless streaming from smartphones, tablets, and smart devices. High-fidelity audio drivers and enhanced bass response are key performance metrics, ensuring a rich listening experience. Innovations include multi-room audio capabilities, voice assistant integration, and extended battery life, catering to diverse consumer needs. The market also sees a resurgence of retro-styled boomboxes with modern features, appealing to a demographic seeking a blend of vintage aesthetics and contemporary functionality. Unique selling propositions often revolve around durability, portability, and the ability to play multiple audio formats, including digital files and physical media.
Key Drivers, Barriers & Challenges in Boombox
Key Drivers:
- Nostalgia and Retro Appeal: A significant segment of consumers are drawn to the classic design and feel of boomboxes, driving demand for retro-inspired models.
- Portability and Versatility: Boomboxes offer a convenient, all-in-one audio solution that can be easily moved and used in various settings, from home to outdoor gatherings.
- Technological Integration: The incorporation of Bluetooth, Wi-Fi, and enhanced audio features makes boomboxes more attractive to modern consumers seeking convenience and quality.
- Affordability: Compared to sophisticated sound systems, boomboxes often represent a more budget-friendly audio option.
Barriers & Challenges:
- Competition from Smart Speakers: The dominance of smart speakers with voice control and advanced AI features presents a significant competitive challenge.
- Perceived Obsolescence: Some consumers may view traditional boombox features (like cassette players) as outdated.
- Supply Chain Disruptions: Global supply chain volatility can impact the availability and cost of components, affecting production and pricing.
- Limited Innovation in Core Functionality: Beyond connectivity, fundamental innovation in audio fidelity or unique playback capabilities has been slow for some segments, potentially limiting appeal to audiophiles.
- Regulatory Compliance: Meeting evolving environmental and safety regulations in different global markets can add complexity and cost to manufacturing.
Emerging Opportunities in Boombox
Emerging opportunities in the boombox market lie in the intersection of retro aesthetics and smart technology. The development of "smart retro" boomboxes, featuring modern app control, voice assistant compatibility, and seamless integration with smart home ecosystems, presents a significant untapped market. Furthermore, the growing demand for portable audio solutions in outdoor recreational settings and for small businesses (e.g., cafes, workshops) creates avenues for ruggedized, weather-resistant boombox models with extended battery life and enhanced connectivity options. The rise of niche audio formats and the continued popularity of vinyl records could also inspire boomboxes with integrated turntable connectivity or specialized digital playback for these formats.
Growth Accelerators in the Boombox Industry
Growth accelerators for the boombox industry are multifaceted. Technological breakthroughs in battery efficiency and wireless audio transmission are crucial for enhancing portability and user experience. Strategic partnerships between boombox manufacturers and streaming service providers can unlock bundled content and exclusive features, driving consumer adoption. Market expansion into developing economies, with tailored product offerings that balance affordability with desired features, represents a significant growth opportunity. Furthermore, focusing on sustainability in product design and manufacturing processes can attract environmentally conscious consumers and align with global trends.
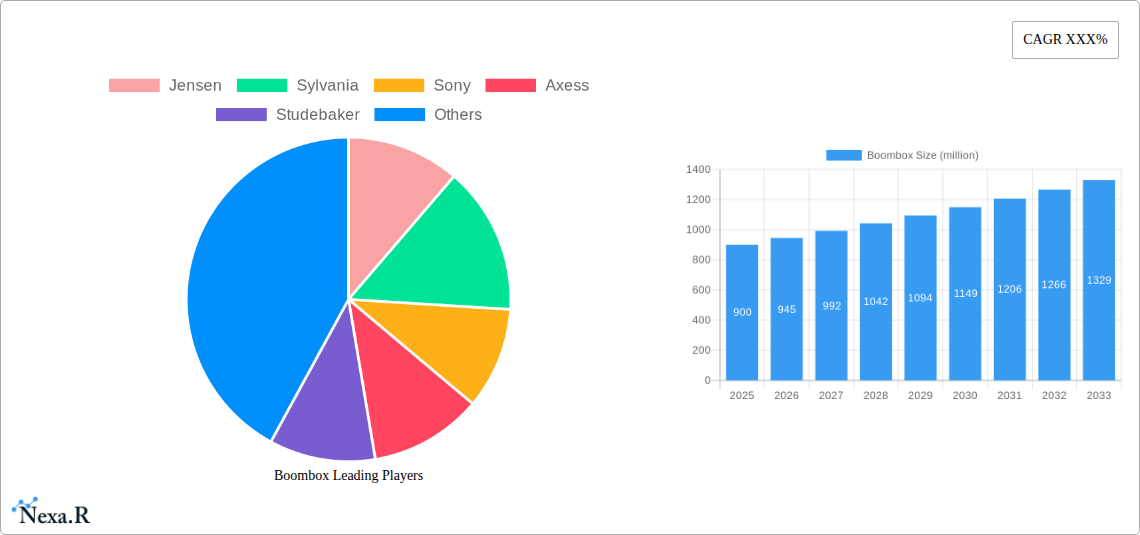
Key Players Shaping the Boombox Market
- Jensen
- Sylvania
- Sony
- Axess
- Studebaker
- QFX
- Tyler
Notable Milestones in Boombox Sector
- 2019: Launch of advanced Bluetooth 5.0 enabled boomboxes, significantly improving wireless connectivity and audio quality.
- 2020: Increased demand for portable audio solutions for home use and remote work, leading to a surge in sales of versatile boombox models.
- 2021: Introduction of boomboxes with integrated smart assistant capabilities, bridging the gap between traditional audio devices and smart home technology.
- 2022: Major manufacturers begin focusing on eco-friendly materials and sustainable production practices in response to growing consumer environmental consciousness.
- 2023: Resurgence of retro-styled boomboxes with modern features, appealing to both nostalgic consumers and younger demographics seeking unique aesthetics.
- 2024: Advancements in battery technology lead to boomboxes with significantly extended playback times, enhancing their portability and outdoor usability.
In-Depth Boombox Market Outlook
The future of the boombox market is characterized by sustained growth, fueled by its unique position at the intersection of nostalgia and modern technology. The continuous integration of advanced wireless connectivity, smart features, and enhanced audio performance will solidify its relevance in the consumer electronics landscape. Emerging opportunities in niche applications and untapped markets, coupled with a focus on sustainable product development, will further accelerate growth. Strategic collaborations and targeted product innovation are poised to drive market expansion and ensure the boombox remains a vibrant and sought-after audio solution for a diverse consumer base.
Boombox Segmentation
-
1. Application
- 1.1. Home Use
- 1.2. Business Use
- 1.3. Others
-
2. Type
- 2.1. Cassette and CD Boombox
- 2.2. Docking Station Boombox
- 2.3. Wireless Boombox
- 2.4. Satellite Radio Boombox
Boombox Segmentation By Geography
-
1. North America
- 1.1. United States
- 1.2. Canada
- 1.3. Mexico
-
2. South America
- 2.1. Brazil
- 2.2. Argentina
- 2.3. Rest of South America
-
3. Europe
- 3.1. United Kingdom
- 3.2. Germany
- 3.3. France
- 3.4. Italy
- 3.5. Spain
- 3.6. Russia
- 3.7. Benelux
- 3.8. Nordics
- 3.9. Rest of Europe
-
4. Middle East & Africa
- 4.1. Turkey
- 4.2. Israel
- 4.3. GCC
- 4.4. North Africa
- 4.5. South Africa
- 4.6. Rest of Middle East & Africa
-
5. Asia Pacific
- 5.1. China
- 5.2. India
- 5.3. Japan
- 5.4. South Korea
- 5.5. ASEAN
- 5.6. Oceania
- 5.7. Rest of Asia Pacific
Boombox REPORT HIGHLIGHTS
| Aspects | Details |
|---|---|
| Study Period | 2019-2033 |
| Base Year | 2024 |
| Estimated Year | 2025 |
| Forecast Period | 2025-2033 |
| Historical Period | 2019-2024 |
| Growth Rate | CAGR of XXX% from 2019-2033 |
| Segmentation |
|
Table of Contents
- 1. Introduction
- 1.1. Research Scope
- 1.2. Market Segmentation
- 1.3. Research Methodology
- 1.4. Definitions and Assumptions
- 2. Executive Summary
- 2.1. Introduction
- 3. Market Dynamics
- 3.1. Introduction
- 3.2. Market Drivers
- 3.3. Market Restrains
- 3.4. Market Trends
- 4. Market Factor Analysis
- 4.1. Porters Five Forces
- 4.2. Supply/Value Chain
- 4.3. PESTEL analysis
- 4.4. Market Entropy
- 4.5. Patent/Trademark Analysis
- 5. Global Boombox Analysis, Insights and Forecast, 2019-2031
- 5.1. Market Analysis, Insights and Forecast - by Application
- 5.1.1. Home Use
- 5.1.2. Business Use
- 5.1.3. Others
- 5.2. Market Analysis, Insights and Forecast - by Type
- 5.2.1. Cassette and CD Boombox
- 5.2.2. Docking Station Boombox
- 5.2.3. Wireless Boombox
- 5.2.4. Satellite Radio Boombox
- 5.3. Market Analysis, Insights and Forecast - by Region
- 5.3.1. North America
- 5.3.2. South America
- 5.3.3. Europe
- 5.3.4. Middle East & Africa
- 5.3.5. Asia Pacific
- 5.1. Market Analysis, Insights and Forecast - by Application
- 6. North America Boombox Analysis, Insights and Forecast, 2019-2031
- 6.1. Market Analysis, Insights and Forecast - by Application
- 6.1.1. Home Use
- 6.1.2. Business Use
- 6.1.3. Others
- 6.2. Market Analysis, Insights and Forecast - by Type
- 6.2.1. Cassette and CD Boombox
- 6.2.2. Docking Station Boombox
- 6.2.3. Wireless Boombox
- 6.2.4. Satellite Radio Boombox
- 6.1. Market Analysis, Insights and Forecast - by Application
- 7. South America Boombox Analysis, Insights and Forecast, 2019-2031
- 7.1. Market Analysis, Insights and Forecast - by Application
- 7.1.1. Home Use
- 7.1.2. Business Use
- 7.1.3. Others
- 7.2. Market Analysis, Insights and Forecast - by Type
- 7.2.1. Cassette and CD Boombox
- 7.2.2. Docking Station Boombox
- 7.2.3. Wireless Boombox
- 7.2.4. Satellite Radio Boombox
- 7.1. Market Analysis, Insights and Forecast - by Application
- 8. Europe Boombox Analysis, Insights and Forecast, 2019-2031
- 8.1. Market Analysis, Insights and Forecast - by Application
- 8.1.1. Home Use
- 8.1.2. Business Use
- 8.1.3. Others
- 8.2. Market Analysis, Insights and Forecast - by Type
- 8.2.1. Cassette and CD Boombox
- 8.2.2. Docking Station Boombox
- 8.2.3. Wireless Boombox
- 8.2.4. Satellite Radio Boombox
- 8.1. Market Analysis, Insights and Forecast - by Application
- 9. Middle East & Africa Boombox Analysis, Insights and Forecast, 2019-2031
- 9.1. Market Analysis, Insights and Forecast - by Application
- 9.1.1. Home Use
- 9.1.2. Business Use
- 9.1.3. Others
- 9.2. Market Analysis, Insights and Forecast - by Type
- 9.2.1. Cassette and CD Boombox
- 9.2.2. Docking Station Boombox
- 9.2.3. Wireless Boombox
- 9.2.4. Satellite Radio Boombox
- 9.1. Market Analysis, Insights and Forecast - by Application
- 10. Asia Pacific Boombox Analysis, Insights and Forecast, 2019-2031
- 10.1. Market Analysis, Insights and Forecast - by Application
- 10.1.1. Home Use
- 10.1.2. Business Use
- 10.1.3. Others
- 10.2. Market Analysis, Insights and Forecast - by Type
- 10.2.1. Cassette and CD Boombox
- 10.2.2. Docking Station Boombox
- 10.2.3. Wireless Boombox
- 10.2.4. Satellite Radio Boombox
- 10.1. Market Analysis, Insights and Forecast - by Application
- 11. Competitive Analysis
- 11.1. Global Market Share Analysis 2024
- 11.2. Company Profiles
- 11.2.1 Jensen
- 11.2.1.1. Overview
- 11.2.1.2. Products
- 11.2.1.3. SWOT Analysis
- 11.2.1.4. Recent Developments
- 11.2.1.5. Financials (Based on Availability)
- 11.2.2 Sylvania
- 11.2.2.1. Overview
- 11.2.2.2. Products
- 11.2.2.3. SWOT Analysis
- 11.2.2.4. Recent Developments
- 11.2.2.5. Financials (Based on Availability)
- 11.2.3 Sony
- 11.2.3.1. Overview
- 11.2.3.2. Products
- 11.2.3.3. SWOT Analysis
- 11.2.3.4. Recent Developments
- 11.2.3.5. Financials (Based on Availability)
- 11.2.4 Axess
- 11.2.4.1. Overview
- 11.2.4.2. Products
- 11.2.4.3. SWOT Analysis
- 11.2.4.4. Recent Developments
- 11.2.4.5. Financials (Based on Availability)
- 11.2.5 Studebaker
- 11.2.5.1. Overview
- 11.2.5.2. Products
- 11.2.5.3. SWOT Analysis
- 11.2.5.4. Recent Developments
- 11.2.5.5. Financials (Based on Availability)
- 11.2.6 QFX
- 11.2.6.1. Overview
- 11.2.6.2. Products
- 11.2.6.3. SWOT Analysis
- 11.2.6.4. Recent Developments
- 11.2.6.5. Financials (Based on Availability)
- 11.2.7 Tyler
- 11.2.7.1. Overview
- 11.2.7.2. Products
- 11.2.7.3. SWOT Analysis
- 11.2.7.4. Recent Developments
- 11.2.7.5. Financials (Based on Availability)
- 11.2.1 Jensen
List of Figures
- Figure 1: Global Boombox Revenue Breakdown (million, %) by Region 2024 & 2032
- Figure 2: Global Boombox Volume Breakdown (K, %) by Region 2024 & 2032
- Figure 3: North America Boombox Revenue (million), by Application 2024 & 2032
- Figure 4: North America Boombox Volume (K), by Application 2024 & 2032
- Figure 5: North America Boombox Revenue Share (%), by Application 2024 & 2032
- Figure 6: North America Boombox Volume Share (%), by Application 2024 & 2032
- Figure 7: North America Boombox Revenue (million), by Type 2024 & 2032
- Figure 8: North America Boombox Volume (K), by Type 2024 & 2032
- Figure 9: North America Boombox Revenue Share (%), by Type 2024 & 2032
- Figure 10: North America Boombox Volume Share (%), by Type 2024 & 2032
- Figure 11: North America Boombox Revenue (million), by Country 2024 & 2032
- Figure 12: North America Boombox Volume (K), by Country 2024 & 2032
- Figure 13: North America Boombox Revenue Share (%), by Country 2024 & 2032
- Figure 14: North America Boombox Volume Share (%), by Country 2024 & 2032
- Figure 15: South America Boombox Revenue (million), by Application 2024 & 2032
- Figure 16: South America Boombox Volume (K), by Application 2024 & 2032
- Figure 17: South America Boombox Revenue Share (%), by Application 2024 & 2032
- Figure 18: South America Boombox Volume Share (%), by Application 2024 & 2032
- Figure 19: South America Boombox Revenue (million), by Type 2024 & 2032
- Figure 20: South America Boombox Volume (K), by Type 2024 & 2032
- Figure 21: South America Boombox Revenue Share (%), by Type 2024 & 2032
- Figure 22: South America Boombox Volume Share (%), by Type 2024 & 2032
- Figure 23: South America Boombox Revenue (million), by Country 2024 & 2032
- Figure 24: South America Boombox Volume (K), by Country 2024 & 2032
- Figure 25: South America Boombox Revenue Share (%), by Country 2024 & 2032
- Figure 26: South America Boombox Volume Share (%), by Country 2024 & 2032
- Figure 27: Europe Boombox Revenue (million), by Application 2024 & 2032
- Figure 28: Europe Boombox Volume (K), by Application 2024 & 2032
- Figure 29: Europe Boombox Revenue Share (%), by Application 2024 & 2032
- Figure 30: Europe Boombox Volume Share (%), by Application 2024 & 2032
- Figure 31: Europe Boombox Revenue (million), by Type 2024 & 2032
- Figure 32: Europe Boombox Volume (K), by Type 2024 & 2032
- Figure 33: Europe Boombox Revenue Share (%), by Type 2024 & 2032
- Figure 34: Europe Boombox Volume Share (%), by Type 2024 & 2032
- Figure 35: Europe Boombox Revenue (million), by Country 2024 & 2032
- Figure 36: Europe Boombox Volume (K), by Country 2024 & 2032
- Figure 37: Europe Boombox Revenue Share (%), by Country 2024 & 2032
- Figure 38: Europe Boombox Volume Share (%), by Country 2024 & 2032
- Figure 39: Middle East & Africa Boombox Revenue (million), by Application 2024 & 2032
- Figure 40: Middle East & Africa Boombox Volume (K), by Application 2024 & 2032
- Figure 41: Middle East & Africa Boombox Revenue Share (%), by Application 2024 & 2032
- Figure 42: Middle East & Africa Boombox Volume Share (%), by Application 2024 & 2032
- Figure 43: Middle East & Africa Boombox Revenue (million), by Type 2024 & 2032
- Figure 44: Middle East & Africa Boombox Volume (K), by Type 2024 & 2032
- Figure 45: Middle East & Africa Boombox Revenue Share (%), by Type 2024 & 2032
- Figure 46: Middle East & Africa Boombox Volume Share (%), by Type 2024 & 2032
- Figure 47: Middle East & Africa Boombox Revenue (million), by Country 2024 & 2032
- Figure 48: Middle East & Africa Boombox Volume (K), by Country 2024 & 2032
- Figure 49: Middle East & Africa Boombox Revenue Share (%), by Country 2024 & 2032
- Figure 50: Middle East & Africa Boombox Volume Share (%), by Country 2024 & 2032
- Figure 51: Asia Pacific Boombox Revenue (million), by Application 2024 & 2032
- Figure 52: Asia Pacific Boombox Volume (K), by Application 2024 & 2032
- Figure 53: Asia Pacific Boombox Revenue Share (%), by Application 2024 & 2032
- Figure 54: Asia Pacific Boombox Volume Share (%), by Application 2024 & 2032
- Figure 55: Asia Pacific Boombox Revenue (million), by Type 2024 & 2032
- Figure 56: Asia Pacific Boombox Volume (K), by Type 2024 & 2032
- Figure 57: Asia Pacific Boombox Revenue Share (%), by Type 2024 & 2032
- Figure 58: Asia Pacific Boombox Volume Share (%), by Type 2024 & 2032
- Figure 59: Asia Pacific Boombox Revenue (million), by Country 2024 & 2032
- Figure 60: Asia Pacific Boombox Volume (K), by Country 2024 & 2032
- Figure 61: Asia Pacific Boombox Revenue Share (%), by Country 2024 & 2032
- Figure 62: Asia Pacific Boombox Volume Share (%), by Country 2024 & 2032
List of Tables
- Table 1: Global Boombox Revenue million Forecast, by Region 2019 & 2032
- Table 2: Global Boombox Volume K Forecast, by Region 2019 & 2032
- Table 3: Global Boombox Revenue million Forecast, by Application 2019 & 2032
- Table 4: Global Boombox Volume K Forecast, by Application 2019 & 2032
- Table 5: Global Boombox Revenue million Forecast, by Type 2019 & 2032
- Table 6: Global Boombox Volume K Forecast, by Type 2019 & 2032
- Table 7: Global Boombox Revenue million Forecast, by Region 2019 & 2032
- Table 8: Global Boombox Volume K Forecast, by Region 2019 & 2032
- Table 9: Global Boombox Revenue million Forecast, by Application 2019 & 2032
- Table 10: Global Boombox Volume K Forecast, by Application 2019 & 2032
- Table 11: Global Boombox Revenue million Forecast, by Type 2019 & 2032
- Table 12: Global Boombox Volume K Forecast, by Type 2019 & 2032
- Table 13: Global Boombox Revenue million Forecast, by Country 2019 & 2032
- Table 14: Global Boombox Volume K Forecast, by Country 2019 & 2032
- Table 15: United States Boombox Revenue (million) Forecast, by Application 2019 & 2032
- Table 16: United States Boombox Volume (K) Forecast, by Application 2019 & 2032
- Table 17: Canada Boombox Revenue (million) Forecast, by Application 2019 & 2032
- Table 18: Canada Boombox Volume (K) Forecast, by Application 2019 & 2032
- Table 19: Mexico Boombox Revenue (million) Forecast, by Application 2019 & 2032
- Table 20: Mexico Boombox Volume (K) Forecast, by Application 2019 & 2032
- Table 21: Global Boombox Revenue million Forecast, by Application 2019 & 2032
- Table 22: Global Boombox Volume K Forecast, by Application 2019 & 2032
- Table 23: Global Boombox Revenue million Forecast, by Type 2019 & 2032
- Table 24: Global Boombox Volume K Forecast, by Type 2019 & 2032
- Table 25: Global Boombox Revenue million Forecast, by Country 2019 & 2032
- Table 26: Global Boombox Volume K Forecast, by Country 2019 & 2032
- Table 27: Brazil Boombox Revenue (million) Forecast, by Application 2019 & 2032
- Table 28: Brazil Boombox Volume (K) Forecast, by Application 2019 & 2032
- Table 29: Argentina Boombox Revenue (million) Forecast, by Application 2019 & 2032
- Table 30: Argentina Boombox Volume (K) Forecast, by Application 2019 & 2032
- Table 31: Rest of South America Boombox Revenue (million) Forecast, by Application 2019 & 2032
- Table 32: Rest of South America Boombox Volume (K) Forecast, by Application 2019 & 2032
- Table 33: Global Boombox Revenue million Forecast, by Application 2019 & 2032
- Table 34: Global Boombox Volume K Forecast, by Application 2019 & 2032
- Table 35: Global Boombox Revenue million Forecast, by Type 2019 & 2032
- Table 36: Global Boombox Volume K Forecast, by Type 2019 & 2032
- Table 37: Global Boombox Revenue million Forecast, by Country 2019 & 2032
- Table 38: Global Boombox Volume K Forecast, by Country 2019 & 2032
- Table 39: United Kingdom Boombox Revenue (million) Forecast, by Application 2019 & 2032
- Table 40: United Kingdom Boombox Volume (K) Forecast, by Application 2019 & 2032
- Table 41: Germany Boombox Revenue (million) Forecast, by Application 2019 & 2032
- Table 42: Germany Boombox Volume (K) Forecast, by Application 2019 & 2032
- Table 43: France Boombox Revenue (million) Forecast, by Application 2019 & 2032
- Table 44: France Boombox Volume (K) Forecast, by Application 2019 & 2032
- Table 45: Italy Boombox Revenue (million) Forecast, by Application 2019 & 2032
- Table 46: Italy Boombox Volume (K) Forecast, by Application 2019 & 2032
- Table 47: Spain Boombox Revenue (million) Forecast, by Application 2019 & 2032
- Table 48: Spain Boombox Volume (K) Forecast, by Application 2019 & 2032
- Table 49: Russia Boombox Revenue (million) Forecast, by Application 2019 & 2032
- Table 50: Russia Boombox Volume (K) Forecast, by Application 2019 & 2032
- Table 51: Benelux Boombox Revenue (million) Forecast, by Application 2019 & 2032
- Table 52: Benelux Boombox Volume (K) Forecast, by Application 2019 & 2032
- Table 53: Nordics Boombox Revenue (million) Forecast, by Application 2019 & 2032
- Table 54: Nordics Boombox Volume (K) Forecast, by Application 2019 & 2032
- Table 55: Rest of Europe Boombox Revenue (million) Forecast, by Application 2019 & 2032
- Table 56: Rest of Europe Boombox Volume (K) Forecast, by Application 2019 & 2032
- Table 57: Global Boombox Revenue million Forecast, by Application 2019 & 2032
- Table 58: Global Boombox Volume K Forecast, by Application 2019 & 2032
- Table 59: Global Boombox Revenue million Forecast, by Type 2019 & 2032
- Table 60: Global Boombox Volume K Forecast, by Type 2019 & 2032
- Table 61: Global Boombox Revenue million Forecast, by Country 2019 & 2032
- Table 62: Global Boombox Volume K Forecast, by Country 2019 & 2032
- Table 63: Turkey Boombox Revenue (million) Forecast, by Application 2019 & 2032
- Table 64: Turkey Boombox Volume (K) Forecast, by Application 2019 & 2032
- Table 65: Israel Boombox Revenue (million) Forecast, by Application 2019 & 2032
- Table 66: Israel Boombox Volume (K) Forecast, by Application 2019 & 2032
- Table 67: GCC Boombox Revenue (million) Forecast, by Application 2019 & 2032
- Table 68: GCC Boombox Volume (K) Forecast, by Application 2019 & 2032
- Table 69: North Africa Boombox Revenue (million) Forecast, by Application 2019 & 2032
- Table 70: North Africa Boombox Volume (K) Forecast, by Application 2019 & 2032
- Table 71: South Africa Boombox Revenue (million) Forecast, by Application 2019 & 2032
- Table 72: South Africa Boombox Volume (K) Forecast, by Application 2019 & 2032
- Table 73: Rest of Middle East & Africa Boombox Revenue (million) Forecast, by Application 2019 & 2032
- Table 74: Rest of Middle East & Africa Boombox Volume (K) Forecast, by Application 2019 & 2032
- Table 75: Global Boombox Revenue million Forecast, by Application 2019 & 2032
- Table 76: Global Boombox Volume K Forecast, by Application 2019 & 2032
- Table 77: Global Boombox Revenue million Forecast, by Type 2019 & 2032
- Table 78: Global Boombox Volume K Forecast, by Type 2019 & 2032
- Table 79: Global Boombox Revenue million Forecast, by Country 2019 & 2032
- Table 80: Global Boombox Volume K Forecast, by Country 2019 & 2032
- Table 81: China Boombox Revenue (million) Forecast, by Application 2019 & 2032
- Table 82: China Boombox Volume (K) Forecast, by Application 2019 & 2032
- Table 83: India Boombox Revenue (million) Forecast, by Application 2019 & 2032
- Table 84: India Boombox Volume (K) Forecast, by Application 2019 & 2032
- Table 85: Japan Boombox Revenue (million) Forecast, by Application 2019 & 2032
- Table 86: Japan Boombox Volume (K) Forecast, by Application 2019 & 2032
- Table 87: South Korea Boombox Revenue (million) Forecast, by Application 2019 & 2032
- Table 88: South Korea Boombox Volume (K) Forecast, by Application 2019 & 2032
- Table 89: ASEAN Boombox Revenue (million) Forecast, by Application 2019 & 2032
- Table 90: ASEAN Boombox Volume (K) Forecast, by Application 2019 & 2032
- Table 91: Oceania Boombox Revenue (million) Forecast, by Application 2019 & 2032
- Table 92: Oceania Boombox Volume (K) Forecast, by Application 2019 & 2032
- Table 93: Rest of Asia Pacific Boombox Revenue (million) Forecast, by Application 2019 & 2032
- Table 94: Rest of Asia Pacific Boombox Volume (K) Forecast, by Application 2019 & 2032
Frequently Asked Questions
1. What is the projected Compound Annual Growth Rate (CAGR) of the Boombox?
The projected CAGR is approximately XXX%.
2. Which companies are prominent players in the Boombox?
Key companies in the market include Jensen, Sylvania, Sony, Axess, Studebaker, QFX, Tyler.
3. What are the main segments of the Boombox?
The market segments include Application, Type.
4. Can you provide details about the market size?
The market size is estimated to be USD XXX million as of 2022.
5. What are some drivers contributing to market growth?
N/A
6. What are the notable trends driving market growth?
N/A
7. Are there any restraints impacting market growth?
N/A
8. Can you provide examples of recent developments in the market?
N/A
9. What pricing options are available for accessing the report?
Pricing options include single-user, multi-user, and enterprise licenses priced at USD 3950.00, USD 5925.00, and USD 7900.00 respectively.
10. Is the market size provided in terms of value or volume?
The market size is provided in terms of value, measured in million and volume, measured in K.
11. Are there any specific market keywords associated with the report?
Yes, the market keyword associated with the report is "Boombox," which aids in identifying and referencing the specific market segment covered.
12. How do I determine which pricing option suits my needs best?
The pricing options vary based on user requirements and access needs. Individual users may opt for single-user licenses, while businesses requiring broader access may choose multi-user or enterprise licenses for cost-effective access to the report.
13. Are there any additional resources or data provided in the Boombox report?
While the report offers comprehensive insights, it's advisable to review the specific contents or supplementary materials provided to ascertain if additional resources or data are available.
14. How can I stay updated on further developments or reports in the Boombox?
To stay informed about further developments, trends, and reports in the Boombox, consider subscribing to industry newsletters, following relevant companies and organizations, or regularly checking reputable industry news sources and publications.
Methodology
Step 1 - Identification of Relevant Samples Size from Population Database


Step 2 - Approaches for Defining Global Market Size (Value, Volume* & Price*)

Note*: In applicable scenarios
Step 3 - Data Sources
Primary Research
- Web Analytics
- Survey Reports
- Research Institute
- Latest Research Reports
- Opinion Leaders
Secondary Research
- Annual Reports
- White Paper
- Latest Press Release
- Industry Association
- Paid Database
- Investor Presentations

Step 4 - Data Triangulation
Involves using different sources of information in order to increase the validity of a study
These sources are likely to be stakeholders in a program - participants, other researchers, program staff, other community members, and so on.
Then we put all data in single framework & apply various statistical tools to find out the dynamic on the market.
During the analysis stage, feedback from the stakeholder groups would be compared to determine areas of agreement as well as areas of divergence
