

Key Insights
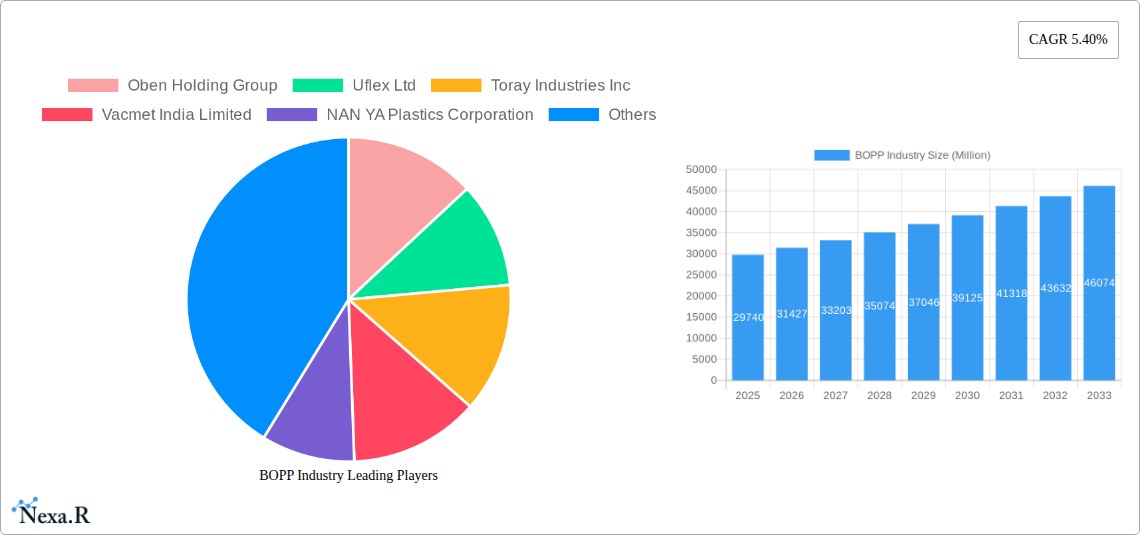
The global Biaxially Oriented Polypropylene (BOPP) film market, valued at $29.74 billion in 2025, is projected to experience robust growth, driven by a Compound Annual Growth Rate (CAGR) of 5.40% from 2025 to 2033. This expansion is fueled by several key factors. The increasing demand for flexible packaging in the food and beverage industry, particularly for convenience foods and ready-to-eat meals, significantly contributes to market growth. Furthermore, the pharmaceutical and medical sectors' reliance on BOPP films for drug packaging and medical device protection drives demand. The industrial sector's use of BOPP for labels, tapes, and other applications further bolsters market expansion. Growth is also stimulated by advancements in BOPP film technology, leading to enhanced barrier properties, improved printability, and greater durability. While raw material price fluctuations and environmental concerns related to plastic waste pose challenges, the overall market outlook remains positive, driven by ongoing innovation and the expanding applications of BOPP films across diverse industries.
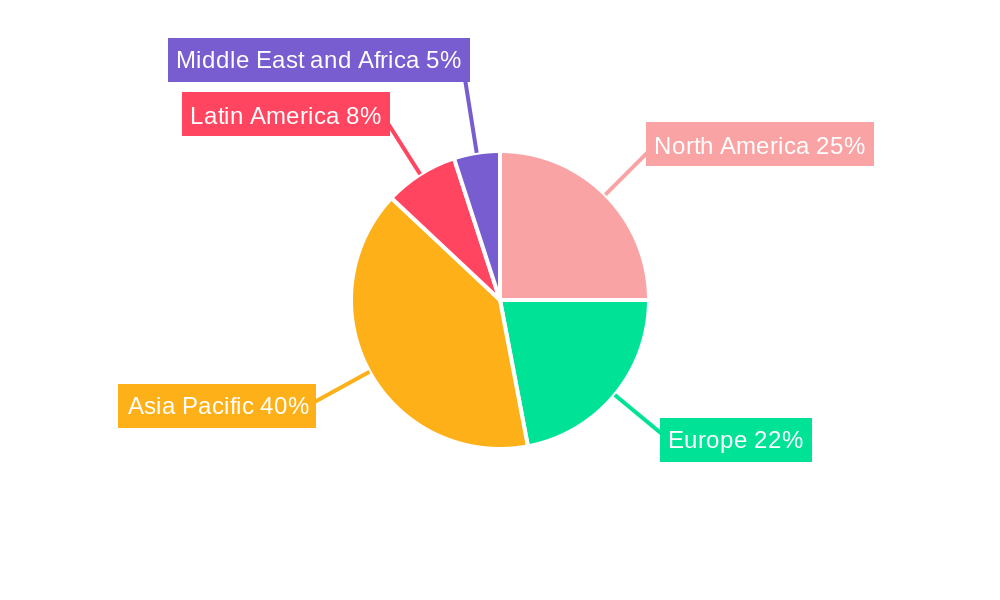
The market segmentation reveals a diverse landscape. Food and beverage applications currently hold the largest market share, owing to the high volume of packaged goods. The pharmaceutical and medical sector shows strong growth potential due to increasing regulatory requirements for sterile packaging. The industrial segment, though less dominant, offers a steady stream of demand for specialized BOPP films. Geographic distribution shows North America and Europe as mature markets, while the Asia-Pacific region exhibits significant growth potential, fueled by expanding manufacturing and rising consumer demand. Key players in the market, including Oben Holding Group, Uflex Ltd, and Toray Industries Inc., are actively involved in innovation and capacity expansion to meet the burgeoning demand. Strategic partnerships and mergers and acquisitions are anticipated to shape the competitive landscape in the coming years, further driving market consolidation and innovation.
This comprehensive report provides an in-depth analysis of the Biaxially Oriented Polypropylene (BOPP) film industry, encompassing market dynamics, growth trends, competitive landscape, and future outlook. The report covers the period from 2019 to 2033, with 2025 as the base year and a forecast period of 2025-2033. The study analyzes key segments including Food, Beverage, Pharmaceutical and Medical, Industrial, and Other End-user Verticals, providing valuable insights for industry professionals, investors, and strategic decision-makers. The report offers detailed profiles of leading companies such as Oben Holding Group, Uflex Ltd, Toray Industries Inc, and more, enabling a thorough understanding of the competitive dynamics within this rapidly evolving market.
BOPP Industry Market Dynamics & Structure
The BOPP film industry is characterized by moderate concentration, with a few major players dominating the global market. Technological innovation, particularly in film properties and processing techniques, is a key driver, alongside evolving regulatory frameworks concerning packaging sustainability. The industry faces competition from alternative packaging materials, but BOPP's versatility and cost-effectiveness maintain its strong market position. M&A activity has been moderate, driven by expansion strategies and efforts to secure market share.
- Market Concentration: The top 5 players hold approximately xx% of the global market share (2024).
- Technological Innovation: Focus on improved barrier properties, enhanced printability, and sustainable solutions.
- Regulatory Landscape: Increasing regulations on plastic waste management impact BOPP film production and application.
- Competitive Substitutes: Paper, aluminum foil, and other polymer films pose competitive challenges.
- End-User Demographics: Growing demand from the food and beverage industry, driven by increased packaged food consumption.
- M&A Trends: xx M&A deals recorded between 2019 and 2024, primarily focused on expanding geographical reach and product portfolios.
BOPP Industry Growth Trends & Insights
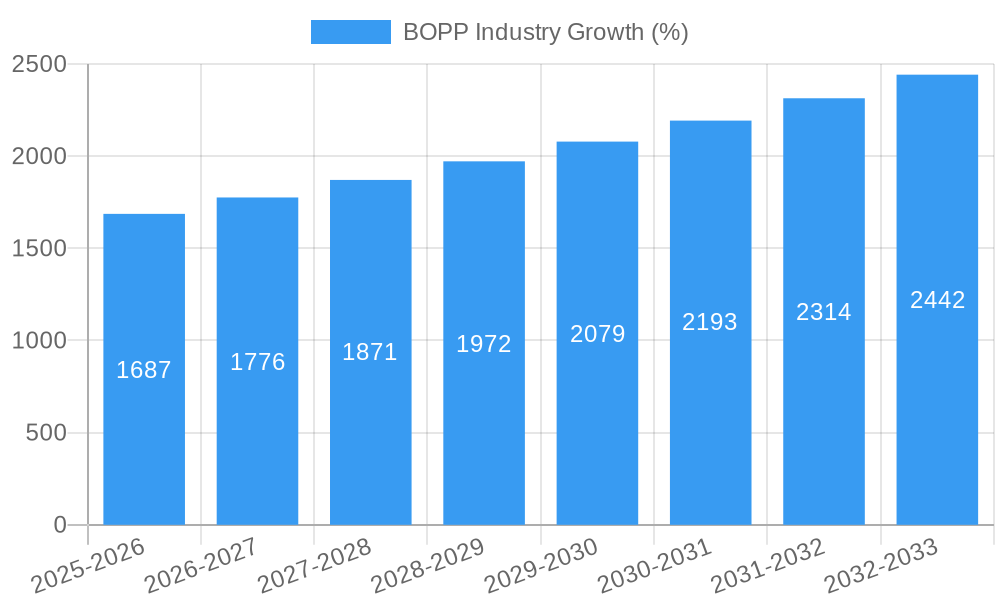
The BOPP film market experienced robust growth during the historical period (2019-2024), driven by the rising demand for flexible packaging across various end-use sectors. The market size is projected to reach xx million units by 2025 and is expected to exhibit a CAGR of xx% during the forecast period (2025-2033). This growth is attributed to factors such as increasing disposable incomes, changing consumer preferences towards convenient packaging, and technological advancements that enhance BOPP film properties. Adoption rates are highest in regions with well-established food and beverage processing industries. Technological disruptions, such as the development of biodegradable BOPP films, are expected to reshape the market landscape in the coming years. Consumer behavior shifts towards sustainable and eco-friendly packaging solutions will also influence the growth trajectory.
Dominant Regions, Countries, or Segments in BOPP Industry
The Asia-Pacific region dominates the global BOPP film market, driven by rapid economic growth, expanding food and beverage industries, and increasing industrial activity. China and India are major contributors to this regional dominance. Within the end-user verticals, the food and beverage sector accounts for the largest market share, followed by the pharmaceutical and medical sector.
- Key Drivers in Asia-Pacific: Rapid industrialization, rising disposable incomes, and growing population.
- Dominance Factors: Established manufacturing base, cost-competitive production, and high demand from key end-user industries.
- Growth Potential: Expanding middle class and increasing urbanization in developing economies of the region.
- Food & Beverage Segment: Largest market share due to widespread use of BOPP films in packaging various food and beverage products.
- Pharmaceutical & Medical Segment: Strong growth driven by the demand for safe and hygienic packaging of medicines and medical supplies.
BOPP Industry Product Landscape
BOPP films are available in various grades, differing in thickness, clarity, barrier properties, and printability. Recent innovations focus on enhancing barrier properties against moisture and oxygen, improving printability for high-quality graphics, and developing sustainable and recyclable BOPP films. These improvements cater to the growing demand for high-performance packaging in diverse applications. Unique selling propositions include superior clarity, excellent printability, and cost-effectiveness compared to alternative materials.
Key Drivers, Barriers & Challenges in BOPP Industry
Key Drivers: Rising demand for flexible packaging, expanding food and beverage industries globally, increasing disposable incomes leading to higher consumption of packaged goods, and technological advancements leading to improved film properties.
Challenges: Fluctuations in raw material prices (propylene), intense competition from substitute materials, environmental concerns related to plastic waste, stringent regulations on plastic packaging, and supply chain disruptions. The impact of these challenges is estimated to reduce market growth by approximately xx% in the next 5 years.
Emerging Opportunities in BOPP Industry
Emerging opportunities lie in the development of biodegradable and compostable BOPP films to address growing environmental concerns. Expanding into niche applications, such as medical packaging and specialty labels, also presents significant growth potential. Furthermore, tapping into emerging markets in Africa and Latin America can unlock significant growth opportunities for BOPP film manufacturers.
Growth Accelerators in the BOPP Industry Industry
Technological advancements in film properties (improved barrier, printability, and sustainability), strategic partnerships to expand distribution networks and secure raw material supplies, and market expansion into new geographic regions are key growth accelerators. The development of innovative applications, such as flexible electronics and advanced packaging solutions, will further fuel long-term growth.
Key Players Shaping the BOPP Industry Market
- Oben Holding Group
- Uflex Ltd
- Toray Industries Inc
- Vacmet India Limited
- NAN YA Plastics Corporation
- Biofilm SA
- Altopro SA de C
- SRF Limited
- Trefan Group
- Polyplex Corporation Ltd
- Tatrafan SRO
- Taghleef Industries LLC
- Jindal Poly Film
Notable Milestones in BOPP Industry Sector
- December 2023: Cosmo Films launched Metalised Electrical grade BOPP films for Capacitor applications, expanding into high-growth electronics sectors.
- August 2022: SRF Limited announced a project to establish a second BOPP film line and metallizer in Indore, India, significantly increasing production capacity.
In-Depth BOPP Industry Market Outlook
The BOPP film market is poised for continued growth, driven by sustained demand from key end-user sectors and ongoing innovations in film technology. Strategic investments in sustainable solutions and expansion into emerging markets will be crucial for capturing the significant future market potential. The focus on developing high-performance, eco-friendly BOPP films will be a key differentiator for market success.
BOPP Industry Segmentation
-
1. End-user Vertical
- 1.1. Food
- 1.2. Beverage
- 1.3. Pharmaceutical and Medical
- 1.4. Industrial
- 1.5. Other End-user Verticals
BOPP Industry Segmentation By Geography
-
1. North America
- 1.1. United States
- 1.2. Canada
-
2. Europe
- 2.1. United Kingdom
- 2.2. Germany
- 2.3. France
- 2.4. Italy
- 2.5. Spain
- 2.6. Rest of Europe
-
3. Asia Pacific
- 3.1. China
- 3.2. Japan
- 3.3. India
- 3.4. Australia
- 3.5. Rest of Asia Pacific
-
4. Latin America
- 4.1. Brazil
- 4.2. Argentina
- 4.3. Mexico
- 4.4. Rest of Latin America
-
5. Middle East and Africa
- 5.1. Saudi Arabia
- 5.2. South Africa
- 5.3. Egypt
- 5.4. Rest of Middle East and Africa
BOPP Industry REPORT HIGHLIGHTS
| Aspects | Details |
|---|---|
| Study Period | 2019-2033 |
| Base Year | 2024 |
| Estimated Year | 2025 |
| Forecast Period | 2025-2033 |
| Historical Period | 2019-2024 |
| Growth Rate | CAGR of 5.40% from 2019-2033 |
| Segmentation |
|
Table of Contents
- 1. Introduction
- 1.1. Research Scope
- 1.2. Market Segmentation
- 1.3. Research Methodology
- 1.4. Definitions and Assumptions
- 2. Executive Summary
- 2.1. Introduction
- 3. Market Dynamics
- 3.1. Introduction
- 3.2. Market Drivers
- 3.2.1. Growing Demand For Packaged Food; Environmental Regulation Paving Way for Flexible Packaging Requirements (over Rigid Packaging Materials); Steady Rise in Demand from Emerging Regions
- 3.3. Market Restrains
- 3.3.1. Fluctuations in the Price of Raw Materials
- 3.4. Market Trends
- 3.4.1. Beverage Vertical is Expected to Drive the Market Growth
- 4. Market Factor Analysis
- 4.1. Porters Five Forces
- 4.2. Supply/Value Chain
- 4.3. PESTEL analysis
- 4.4. Market Entropy
- 4.5. Patent/Trademark Analysis
- 5. Global BOPP Industry Analysis, Insights and Forecast, 2019-2031
- 5.1. Market Analysis, Insights and Forecast - by End-user Vertical
- 5.1.1. Food
- 5.1.2. Beverage
- 5.1.3. Pharmaceutical and Medical
- 5.1.4. Industrial
- 5.1.5. Other End-user Verticals
- 5.2. Market Analysis, Insights and Forecast - by Region
- 5.2.1. North America
- 5.2.2. Europe
- 5.2.3. Asia Pacific
- 5.2.4. Latin America
- 5.2.5. Middle East and Africa
- 5.1. Market Analysis, Insights and Forecast - by End-user Vertical
- 6. North America BOPP Industry Analysis, Insights and Forecast, 2019-2031
- 6.1. Market Analysis, Insights and Forecast - by End-user Vertical
- 6.1.1. Food
- 6.1.2. Beverage
- 6.1.3. Pharmaceutical and Medical
- 6.1.4. Industrial
- 6.1.5. Other End-user Verticals
- 6.1. Market Analysis, Insights and Forecast - by End-user Vertical
- 7. Europe BOPP Industry Analysis, Insights and Forecast, 2019-2031
- 7.1. Market Analysis, Insights and Forecast - by End-user Vertical
- 7.1.1. Food
- 7.1.2. Beverage
- 7.1.3. Pharmaceutical and Medical
- 7.1.4. Industrial
- 7.1.5. Other End-user Verticals
- 7.1. Market Analysis, Insights and Forecast - by End-user Vertical
- 8. Asia Pacific BOPP Industry Analysis, Insights and Forecast, 2019-2031
- 8.1. Market Analysis, Insights and Forecast - by End-user Vertical
- 8.1.1. Food
- 8.1.2. Beverage
- 8.1.3. Pharmaceutical and Medical
- 8.1.4. Industrial
- 8.1.5. Other End-user Verticals
- 8.1. Market Analysis, Insights and Forecast - by End-user Vertical
- 9. Latin America BOPP Industry Analysis, Insights and Forecast, 2019-2031
- 9.1. Market Analysis, Insights and Forecast - by End-user Vertical
- 9.1.1. Food
- 9.1.2. Beverage
- 9.1.3. Pharmaceutical and Medical
- 9.1.4. Industrial
- 9.1.5. Other End-user Verticals
- 9.1. Market Analysis, Insights and Forecast - by End-user Vertical
- 10. Middle East and Africa BOPP Industry Analysis, Insights and Forecast, 2019-2031
- 10.1. Market Analysis, Insights and Forecast - by End-user Vertical
- 10.1.1. Food
- 10.1.2. Beverage
- 10.1.3. Pharmaceutical and Medical
- 10.1.4. Industrial
- 10.1.5. Other End-user Verticals
- 10.1. Market Analysis, Insights and Forecast - by End-user Vertical
- 11. North America BOPP Industry Analysis, Insights and Forecast, 2019-2031
- 11.1. Market Analysis, Insights and Forecast - By Country/Sub-region
- 11.1.1 United States
- 11.1.2 Canada
- 12. Europe BOPP Industry Analysis, Insights and Forecast, 2019-2031
- 12.1. Market Analysis, Insights and Forecast - By Country/Sub-region
- 12.1.1 United Kingdom
- 12.1.2 Germany
- 12.1.3 France
- 12.1.4 Italy
- 12.1.5 Spain
- 12.1.6 Rest of Europe
- 13. Asia Pacific BOPP Industry Analysis, Insights and Forecast, 2019-2031
- 13.1. Market Analysis, Insights and Forecast - By Country/Sub-region
- 13.1.1 China
- 13.1.2 Japan
- 13.1.3 India
- 13.1.4 Australia
- 13.1.5 Rest of Asia Pacific
- 14. Latin America BOPP Industry Analysis, Insights and Forecast, 2019-2031
- 14.1. Market Analysis, Insights and Forecast - By Country/Sub-region
- 14.1.1 Brazil
- 14.1.2 Argentina
- 14.1.3 Mexico
- 14.1.4 Rest of Latin America
- 15. Middle East and Africa BOPP Industry Analysis, Insights and Forecast, 2019-2031
- 15.1. Market Analysis, Insights and Forecast - By Country/Sub-region
- 15.1.1 Saudi Arabia
- 15.1.2 South Africa
- 15.1.3 Egypt
- 15.1.4 Rest of Middle East and Africa
- 16. Competitive Analysis
- 16.1. Global Market Share Analysis 2024
- 16.2. Company Profiles
- 16.2.1 Oben Holding Group
- 16.2.1.1. Overview
- 16.2.1.2. Products
- 16.2.1.3. SWOT Analysis
- 16.2.1.4. Recent Developments
- 16.2.1.5. Financials (Based on Availability)
- 16.2.2 Uflex Ltd
- 16.2.2.1. Overview
- 16.2.2.2. Products
- 16.2.2.3. SWOT Analysis
- 16.2.2.4. Recent Developments
- 16.2.2.5. Financials (Based on Availability)
- 16.2.3 Toray Industries Inc
- 16.2.3.1. Overview
- 16.2.3.2. Products
- 16.2.3.3. SWOT Analysis
- 16.2.3.4. Recent Developments
- 16.2.3.5. Financials (Based on Availability)
- 16.2.4 Vacmet India Limited
- 16.2.4.1. Overview
- 16.2.4.2. Products
- 16.2.4.3. SWOT Analysis
- 16.2.4.4. Recent Developments
- 16.2.4.5. Financials (Based on Availability)
- 16.2.5 NAN YA Plastics Corporation
- 16.2.5.1. Overview
- 16.2.5.2. Products
- 16.2.5.3. SWOT Analysis
- 16.2.5.4. Recent Developments
- 16.2.5.5. Financials (Based on Availability)
- 16.2.6 Biofilm SA
- 16.2.6.1. Overview
- 16.2.6.2. Products
- 16.2.6.3. SWOT Analysis
- 16.2.6.4. Recent Developments
- 16.2.6.5. Financials (Based on Availability)
- 16.2.7 Altopro SA de C
- 16.2.7.1. Overview
- 16.2.7.2. Products
- 16.2.7.3. SWOT Analysis
- 16.2.7.4. Recent Developments
- 16.2.7.5. Financials (Based on Availability)
- 16.2.8 SRF Limited
- 16.2.8.1. Overview
- 16.2.8.2. Products
- 16.2.8.3. SWOT Analysis
- 16.2.8.4. Recent Developments
- 16.2.8.5. Financials (Based on Availability)
- 16.2.9 Trefan Group
- 16.2.9.1. Overview
- 16.2.9.2. Products
- 16.2.9.3. SWOT Analysis
- 16.2.9.4. Recent Developments
- 16.2.9.5. Financials (Based on Availability)
- 16.2.10 Polyplex Corporation Ltd
- 16.2.10.1. Overview
- 16.2.10.2. Products
- 16.2.10.3. SWOT Analysis
- 16.2.10.4. Recent Developments
- 16.2.10.5. Financials (Based on Availability)
- 16.2.11 Tatrafan SRO
- 16.2.11.1. Overview
- 16.2.11.2. Products
- 16.2.11.3. SWOT Analysis
- 16.2.11.4. Recent Developments
- 16.2.11.5. Financials (Based on Availability)
- 16.2.12 Taghleef Industries LLC
- 16.2.12.1. Overview
- 16.2.12.2. Products
- 16.2.12.3. SWOT Analysis
- 16.2.12.4. Recent Developments
- 16.2.12.5. Financials (Based on Availability)
- 16.2.13 Jindal Poly Film
- 16.2.13.1. Overview
- 16.2.13.2. Products
- 16.2.13.3. SWOT Analysis
- 16.2.13.4. Recent Developments
- 16.2.13.5. Financials (Based on Availability)
- 16.2.1 Oben Holding Group
List of Figures
- Figure 1: Global BOPP Industry Revenue Breakdown (Million, %) by Region 2024 & 2032
- Figure 2: North America BOPP Industry Revenue (Million), by Country 2024 & 2032
- Figure 3: North America BOPP Industry Revenue Share (%), by Country 2024 & 2032
- Figure 4: Europe BOPP Industry Revenue (Million), by Country 2024 & 2032
- Figure 5: Europe BOPP Industry Revenue Share (%), by Country 2024 & 2032
- Figure 6: Asia Pacific BOPP Industry Revenue (Million), by Country 2024 & 2032
- Figure 7: Asia Pacific BOPP Industry Revenue Share (%), by Country 2024 & 2032
- Figure 8: Latin America BOPP Industry Revenue (Million), by Country 2024 & 2032
- Figure 9: Latin America BOPP Industry Revenue Share (%), by Country 2024 & 2032
- Figure 10: Middle East and Africa BOPP Industry Revenue (Million), by Country 2024 & 2032
- Figure 11: Middle East and Africa BOPP Industry Revenue Share (%), by Country 2024 & 2032
- Figure 12: North America BOPP Industry Revenue (Million), by End-user Vertical 2024 & 2032
- Figure 13: North America BOPP Industry Revenue Share (%), by End-user Vertical 2024 & 2032
- Figure 14: North America BOPP Industry Revenue (Million), by Country 2024 & 2032
- Figure 15: North America BOPP Industry Revenue Share (%), by Country 2024 & 2032
- Figure 16: Europe BOPP Industry Revenue (Million), by End-user Vertical 2024 & 2032
- Figure 17: Europe BOPP Industry Revenue Share (%), by End-user Vertical 2024 & 2032
- Figure 18: Europe BOPP Industry Revenue (Million), by Country 2024 & 2032
- Figure 19: Europe BOPP Industry Revenue Share (%), by Country 2024 & 2032
- Figure 20: Asia Pacific BOPP Industry Revenue (Million), by End-user Vertical 2024 & 2032
- Figure 21: Asia Pacific BOPP Industry Revenue Share (%), by End-user Vertical 2024 & 2032
- Figure 22: Asia Pacific BOPP Industry Revenue (Million), by Country 2024 & 2032
- Figure 23: Asia Pacific BOPP Industry Revenue Share (%), by Country 2024 & 2032
- Figure 24: Latin America BOPP Industry Revenue (Million), by End-user Vertical 2024 & 2032
- Figure 25: Latin America BOPP Industry Revenue Share (%), by End-user Vertical 2024 & 2032
- Figure 26: Latin America BOPP Industry Revenue (Million), by Country 2024 & 2032
- Figure 27: Latin America BOPP Industry Revenue Share (%), by Country 2024 & 2032
- Figure 28: Middle East and Africa BOPP Industry Revenue (Million), by End-user Vertical 2024 & 2032
- Figure 29: Middle East and Africa BOPP Industry Revenue Share (%), by End-user Vertical 2024 & 2032
- Figure 30: Middle East and Africa BOPP Industry Revenue (Million), by Country 2024 & 2032
- Figure 31: Middle East and Africa BOPP Industry Revenue Share (%), by Country 2024 & 2032
List of Tables
- Table 1: Global BOPP Industry Revenue Million Forecast, by Region 2019 & 2032
- Table 2: Global BOPP Industry Revenue Million Forecast, by End-user Vertical 2019 & 2032
- Table 3: Global BOPP Industry Revenue Million Forecast, by Region 2019 & 2032
- Table 4: Global BOPP Industry Revenue Million Forecast, by Country 2019 & 2032
- Table 5: United States BOPP Industry Revenue (Million) Forecast, by Application 2019 & 2032
- Table 6: Canada BOPP Industry Revenue (Million) Forecast, by Application 2019 & 2032
- Table 7: Global BOPP Industry Revenue Million Forecast, by Country 2019 & 2032
- Table 8: United Kingdom BOPP Industry Revenue (Million) Forecast, by Application 2019 & 2032
- Table 9: Germany BOPP Industry Revenue (Million) Forecast, by Application 2019 & 2032
- Table 10: France BOPP Industry Revenue (Million) Forecast, by Application 2019 & 2032
- Table 11: Italy BOPP Industry Revenue (Million) Forecast, by Application 2019 & 2032
- Table 12: Spain BOPP Industry Revenue (Million) Forecast, by Application 2019 & 2032
- Table 13: Rest of Europe BOPP Industry Revenue (Million) Forecast, by Application 2019 & 2032
- Table 14: Global BOPP Industry Revenue Million Forecast, by Country 2019 & 2032
- Table 15: China BOPP Industry Revenue (Million) Forecast, by Application 2019 & 2032
- Table 16: Japan BOPP Industry Revenue (Million) Forecast, by Application 2019 & 2032
- Table 17: India BOPP Industry Revenue (Million) Forecast, by Application 2019 & 2032
- Table 18: Australia BOPP Industry Revenue (Million) Forecast, by Application 2019 & 2032
- Table 19: Rest of Asia Pacific BOPP Industry Revenue (Million) Forecast, by Application 2019 & 2032
- Table 20: Global BOPP Industry Revenue Million Forecast, by Country 2019 & 2032
- Table 21: Brazil BOPP Industry Revenue (Million) Forecast, by Application 2019 & 2032
- Table 22: Argentina BOPP Industry Revenue (Million) Forecast, by Application 2019 & 2032
- Table 23: Mexico BOPP Industry Revenue (Million) Forecast, by Application 2019 & 2032
- Table 24: Rest of Latin America BOPP Industry Revenue (Million) Forecast, by Application 2019 & 2032
- Table 25: Global BOPP Industry Revenue Million Forecast, by Country 2019 & 2032
- Table 26: Saudi Arabia BOPP Industry Revenue (Million) Forecast, by Application 2019 & 2032
- Table 27: South Africa BOPP Industry Revenue (Million) Forecast, by Application 2019 & 2032
- Table 28: Egypt BOPP Industry Revenue (Million) Forecast, by Application 2019 & 2032
- Table 29: Rest of Middle East and Africa BOPP Industry Revenue (Million) Forecast, by Application 2019 & 2032
- Table 30: Global BOPP Industry Revenue Million Forecast, by End-user Vertical 2019 & 2032
- Table 31: Global BOPP Industry Revenue Million Forecast, by Country 2019 & 2032
- Table 32: United States BOPP Industry Revenue (Million) Forecast, by Application 2019 & 2032
- Table 33: Canada BOPP Industry Revenue (Million) Forecast, by Application 2019 & 2032
- Table 34: Global BOPP Industry Revenue Million Forecast, by End-user Vertical 2019 & 2032
- Table 35: Global BOPP Industry Revenue Million Forecast, by Country 2019 & 2032
- Table 36: United Kingdom BOPP Industry Revenue (Million) Forecast, by Application 2019 & 2032
- Table 37: Germany BOPP Industry Revenue (Million) Forecast, by Application 2019 & 2032
- Table 38: France BOPP Industry Revenue (Million) Forecast, by Application 2019 & 2032
- Table 39: Italy BOPP Industry Revenue (Million) Forecast, by Application 2019 & 2032
- Table 40: Spain BOPP Industry Revenue (Million) Forecast, by Application 2019 & 2032
- Table 41: Rest of Europe BOPP Industry Revenue (Million) Forecast, by Application 2019 & 2032
- Table 42: Global BOPP Industry Revenue Million Forecast, by End-user Vertical 2019 & 2032
- Table 43: Global BOPP Industry Revenue Million Forecast, by Country 2019 & 2032
- Table 44: China BOPP Industry Revenue (Million) Forecast, by Application 2019 & 2032
- Table 45: Japan BOPP Industry Revenue (Million) Forecast, by Application 2019 & 2032
- Table 46: India BOPP Industry Revenue (Million) Forecast, by Application 2019 & 2032
- Table 47: Australia BOPP Industry Revenue (Million) Forecast, by Application 2019 & 2032
- Table 48: Rest of Asia Pacific BOPP Industry Revenue (Million) Forecast, by Application 2019 & 2032
- Table 49: Global BOPP Industry Revenue Million Forecast, by End-user Vertical 2019 & 2032
- Table 50: Global BOPP Industry Revenue Million Forecast, by Country 2019 & 2032
- Table 51: Brazil BOPP Industry Revenue (Million) Forecast, by Application 2019 & 2032
- Table 52: Argentina BOPP Industry Revenue (Million) Forecast, by Application 2019 & 2032
- Table 53: Mexico BOPP Industry Revenue (Million) Forecast, by Application 2019 & 2032
- Table 54: Rest of Latin America BOPP Industry Revenue (Million) Forecast, by Application 2019 & 2032
- Table 55: Global BOPP Industry Revenue Million Forecast, by End-user Vertical 2019 & 2032
- Table 56: Global BOPP Industry Revenue Million Forecast, by Country 2019 & 2032
- Table 57: Saudi Arabia BOPP Industry Revenue (Million) Forecast, by Application 2019 & 2032
- Table 58: South Africa BOPP Industry Revenue (Million) Forecast, by Application 2019 & 2032
- Table 59: Egypt BOPP Industry Revenue (Million) Forecast, by Application 2019 & 2032
- Table 60: Rest of Middle East and Africa BOPP Industry Revenue (Million) Forecast, by Application 2019 & 2032
Frequently Asked Questions
1. What is the projected Compound Annual Growth Rate (CAGR) of the BOPP Industry?
The projected CAGR is approximately 5.40%.
2. Which companies are prominent players in the BOPP Industry?
Key companies in the market include Oben Holding Group, Uflex Ltd, Toray Industries Inc, Vacmet India Limited, NAN YA Plastics Corporation, Biofilm SA, Altopro SA de C, SRF Limited, Trefan Group, Polyplex Corporation Ltd, Tatrafan SRO, Taghleef Industries LLC, Jindal Poly Film.
3. What are the main segments of the BOPP Industry?
The market segments include End-user Vertical.
4. Can you provide details about the market size?
The market size is estimated to be USD 29.74 Million as of 2022.
5. What are some drivers contributing to market growth?
Growing Demand For Packaged Food; Environmental Regulation Paving Way for Flexible Packaging Requirements (over Rigid Packaging Materials); Steady Rise in Demand from Emerging Regions.
6. What are the notable trends driving market growth?
Beverage Vertical is Expected to Drive the Market Growth.
7. Are there any restraints impacting market growth?
Fluctuations in the Price of Raw Materials.
8. Can you provide examples of recent developments in the market?
December 2023 - Cosmo Films, one of the global leaders in specialty films for packaging, labeling, synthetic paper, and lamination applications, launched Metalised Electrical grade BOPP films for Capacitor application. These Films are used for Capacitor manufacturing of various types of AC and DC Capacitors. These Capacitors have diverse applications ranging from Electronics appliances, Industrial applications, Power Electronics, Automobile, Electric Vehicles, Renewable Power systems, etc.
9. What pricing options are available for accessing the report?
Pricing options include single-user, multi-user, and enterprise licenses priced at USD 4750, USD 5250, and USD 8750 respectively.
10. Is the market size provided in terms of value or volume?
The market size is provided in terms of value, measured in Million.
11. Are there any specific market keywords associated with the report?
Yes, the market keyword associated with the report is "BOPP Industry," which aids in identifying and referencing the specific market segment covered.
12. How do I determine which pricing option suits my needs best?
The pricing options vary based on user requirements and access needs. Individual users may opt for single-user licenses, while businesses requiring broader access may choose multi-user or enterprise licenses for cost-effective access to the report.
13. Are there any additional resources or data provided in the BOPP Industry report?
While the report offers comprehensive insights, it's advisable to review the specific contents or supplementary materials provided to ascertain if additional resources or data are available.
14. How can I stay updated on further developments or reports in the BOPP Industry?
To stay informed about further developments, trends, and reports in the BOPP Industry, consider subscribing to industry newsletters, following relevant companies and organizations, or regularly checking reputable industry news sources and publications.
Methodology
Step 1 - Identification of Relevant Samples Size from Population Database


Step 2 - Approaches for Defining Global Market Size (Value, Volume* & Price*)

Note*: In applicable scenarios
Step 3 - Data Sources
Primary Research
- Web Analytics
- Survey Reports
- Research Institute
- Latest Research Reports
- Opinion Leaders
Secondary Research
- Annual Reports
- White Paper
- Latest Press Release
- Industry Association
- Paid Database
- Investor Presentations

Step 4 - Data Triangulation
Involves using different sources of information in order to increase the validity of a study
These sources are likely to be stakeholders in a program - participants, other researchers, program staff, other community members, and so on.
Then we put all data in single framework & apply various statistical tools to find out the dynamic on the market.
During the analysis stage, feedback from the stakeholder groups would be compared to determine areas of agreement as well as areas of divergence
