

Key Insights
The global Clean Room System Integration market is experiencing robust expansion, projected to reach a significant market size of approximately USD 18,500 million by 2025, with a compelling Compound Annual Growth Rate (CAGR) of around 7.5% anticipated through 2033. This growth is primarily propelled by the escalating demand for stringent contamination control in highly sensitive industries. The Semiconductor Industry stands out as a major driver, where the miniaturization of components and the complexity of manufacturing processes necessitate ultra-clean environments to prevent defects and ensure product reliability. Similarly, the Precision Manufacturing Industry, encompassing aerospace, electronics, and advanced materials, relies heavily on cleanroom technology for producing high-tolerance parts free from particulate contamination. Furthermore, the burgeoning Medical and Pharmaceutical Industries are crucial growth engines, driven by the development of sterile pharmaceuticals, advanced medical devices, and biopharmaceuticals, all of which require meticulously controlled environments to ensure patient safety and product efficacy. Emerging applications in research and development across various scientific disciplines also contribute to this upward trajectory.
The market is segmented into Industrial-Grade Clean Rooms and Biological-Grade Clean Rooms, catering to distinct contamination control requirements. Industrial-grade solutions are essential for industries where particulate matter can compromise product quality, while biological-grade cleanrooms are paramount for sterile environments in healthcare and life sciences. Key trends shaping the market include the increasing adoption of modular and prefabricated cleanroom solutions for faster deployment and cost-efficiency, the integration of advanced automation and IoT for real-time environmental monitoring and control, and the development of energy-efficient cleanroom designs to reduce operational costs and environmental impact. However, the market faces certain restraints, such as the high initial investment costs associated with constructing and maintaining sophisticated cleanroom systems and the stringent regulatory compliance requirements that can prolong project timelines. Despite these challenges, the continuous technological advancements and the unwavering commitment to product quality and safety across critical industries ensure a positive and sustained growth outlook for the cleanroom system integration market.
Comprehensive Report on Clean Room System Integration Market
This report provides an in-depth analysis of the global Clean Room System Integration market, offering critical insights for stakeholders across the semiconductor, precision manufacturing, medical, and pharmaceutical industries. With a detailed study period from 2019 to 2033, including a base year of 2025 and a forecast period of 2025–2033, this report offers a robust understanding of market dynamics, growth trends, and future opportunities.
Clean Room System Integration Market Dynamics & Structure
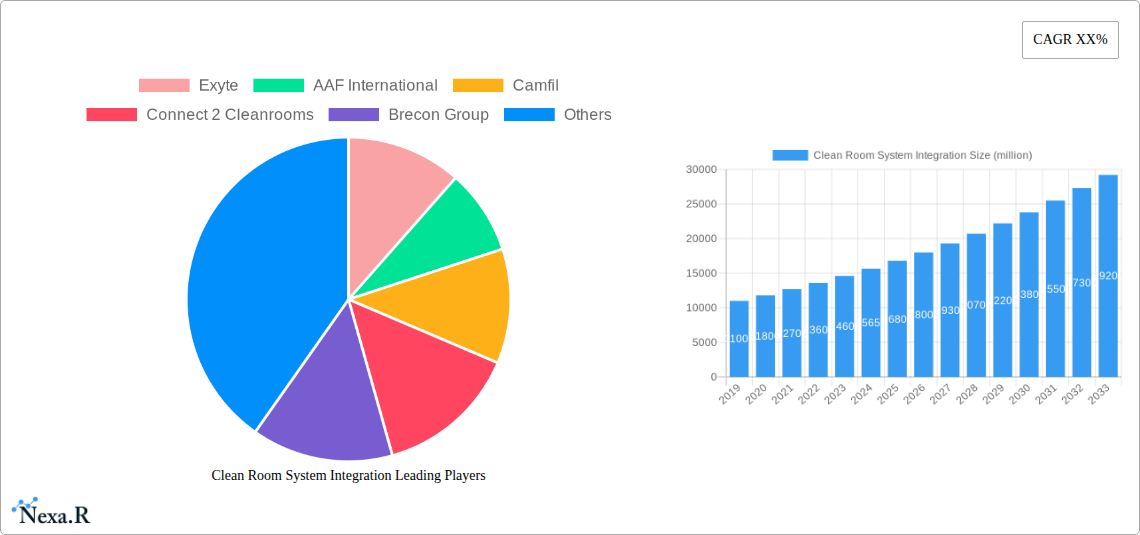
The Clean Room System Integration market exhibits a moderately consolidated structure, with a few leading global players and a significant number of regional and specialized integrators. Technological innovation is a primary driver, fueled by the increasing demand for ultra-clean environments in advanced manufacturing and life sciences. Regulatory frameworks, such as ISO 14644 standards and GMP guidelines, are crucial in dictating system design and validation, thereby shaping market entry and operational requirements.
- Market Concentration: Characterized by a mix of large-scale global providers and agile niche players, leading to a competitive yet evolving landscape.
- Technological Innovation: Driven by advancements in HVAC systems, filtration technologies (HEPA, ULPA), material science for cleanroom construction, and smart monitoring systems.
- Regulatory Frameworks: Stringent compliance requirements from bodies like FDA, EMA, and ISO dictate the need for sophisticated and validated cleanroom solutions.
- Competitive Product Substitutes: While direct substitutes are limited, advancements in sterile manufacturing techniques and localized contamination control can present indirect competition.
- End-User Demographics: Primarily consists of companies in the semiconductor (US$ 350 million in 2025), pharmaceutical (US$ 280 million in 2025), medical device (US$ 210 million in 2025), and advanced manufacturing sectors.
- M&A Trends: A steady stream of mergers and acquisitions is observed as larger players aim to expand their geographical reach, technological capabilities, and service portfolios. The historical M&A deal volume for the period 2019-2024 is estimated at 35 deals.
Clean Room System Integration Growth Trends & Insights
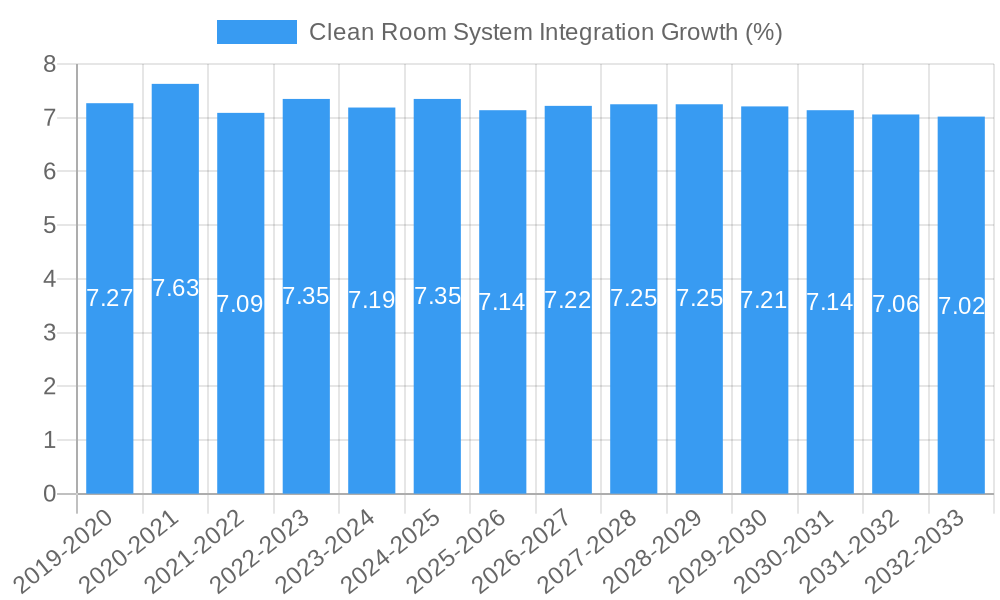
The global Clean Room System Integration market is poised for substantial growth, driven by a confluence of technological advancements, expanding applications, and increasing industry demand for contaminant-free environments. The market is projected to witness a Compound Annual Growth Rate (CAGR) of approximately 7.5% over the forecast period (2025–2033). This robust expansion is underpinned by escalating investments in cutting-edge industries that necessitate stringent environmental controls.
The adoption rates for advanced cleanroom solutions are steadily increasing across all major application segments. The Semiconductor Industry remains a significant contributor, with its insatiable demand for micro-fabrication processes requiring the highest levels of particle control. Similarly, the Pharmaceutical and Food Industry is witnessing augmented adoption due to evolving regulatory mandates for product safety and efficacy, alongside the growth of biologics and specialized food production. The Medical Industry also presents a fertile ground for growth, propelled by the development of advanced medical devices, implants, and sterile drug formulations.
Technological disruptions are playing a pivotal role in reshaping the market. Innovations in modular cleanroom construction, smart sensor technology for real-time monitoring, energy-efficient HVAC systems, and advanced filtration media are enabling more cost-effective, adaptable, and efficient cleanroom solutions. Furthermore, the growing emphasis on sustainability is driving the development of greener cleanroom technologies, incorporating energy recovery systems and eco-friendly materials.
Consumer behavior shifts are also influencing the market. End-users are increasingly seeking integrated solutions that encompass design, installation, validation, and ongoing maintenance, rather than piecemeal services. This trend favors system integrators capable of delivering end-to-end project management and lifecycle support. The market penetration of advanced cleanroom integration services is expected to rise as more companies recognize the critical role of controlled environments in ensuring product quality, reducing failure rates, and maintaining compliance. The estimated market size for clean room system integration in 2025 is US$ 1,250 million.
Dominant Regions, Countries, or Segments in Clean Room System Integration
The Semiconductor Industry stands out as the most dominant segment driving growth in the global Clean Room System Integration market. This dominance is a direct consequence of the inherent and escalating requirements for ultra-high purity environments in semiconductor manufacturing processes, from wafer fabrication to assembly and testing. The relentless pursuit of smaller, more powerful microchips demands increasingly sophisticated and reliable cleanroom systems to prevent even the slightest contamination. The market share of the Semiconductor Industry within clean room system integration is estimated at 38% in 2025, with a projected market value of US$ 475 million.
The Industrial-Grade Clean Room type is also a significant contributor to market dominance, particularly within the manufacturing and electronics sectors. These systems are engineered for high-volume production environments where stringent particle control is essential for product yield and quality. Their widespread application in manufacturing hubs fuels consistent demand for integration services. The market share of Industrial-Grade Clean Rooms is estimated at 55% in 2025, with a projected market value of US$ 687.5 million.
Key Drivers for Semiconductor Industry Dominance:
- Technological Advancements: Continuous innovation in chip design (e.g., sub-10nm nodes) necessitates increasingly stringent cleanroom standards.
- Global Expansion of Manufacturing: The global expansion of semiconductor fabrication plants, particularly in Asia, fuels demand for new cleanroom constructions and upgrades.
- High-Value Production: The extremely high value of semiconductor output makes contamination prevention a critical factor in ensuring profitability.
- Government Investments: Significant government initiatives and incentives in various regions to boost domestic semiconductor manufacturing capabilities.
Key Drivers for Industrial-Grade Clean Room Dominance:
- Broad Applicability: Used across a wide array of industries including electronics, automotive, aerospace, and advanced materials.
- Scalability and Cost-Effectiveness: Offers robust contamination control solutions that can be scaled to meet diverse production volumes and budgets.
- Reliability and Durability: Designed for continuous operation in demanding manufacturing environments.
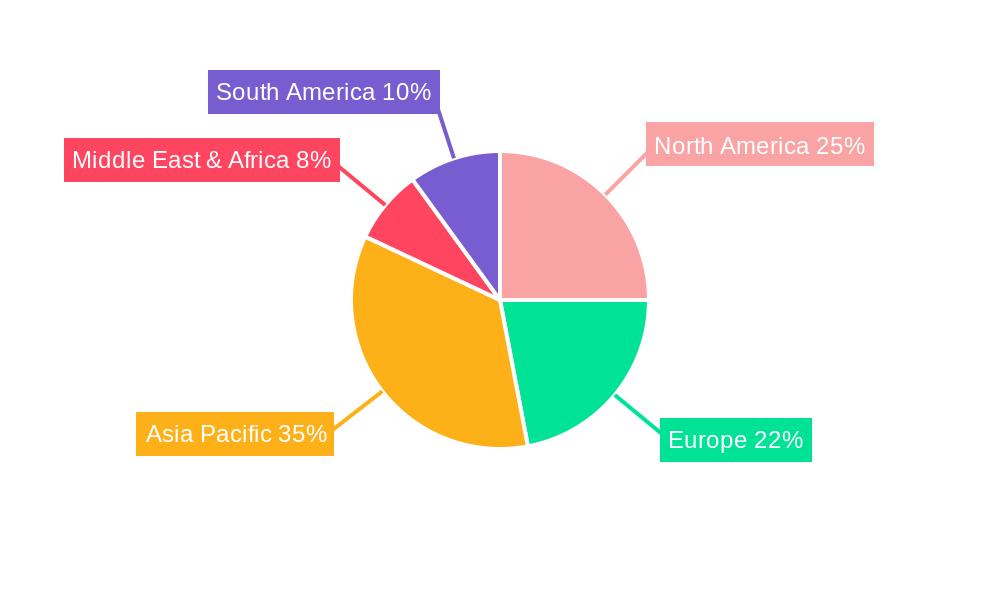
Geographically, Asia Pacific is emerging as a powerhouse in the clean room system integration market, driven by its significant role in global manufacturing, particularly in electronics and semiconductors. Countries like China, South Korea, Taiwan, and Singapore are experiencing substantial investments in advanced manufacturing facilities, consequently boosting the demand for sophisticated cleanroom solutions.
Clean Room System Integration Product Landscape
The clean room system integration product landscape is characterized by a comprehensive suite of technologies designed to achieve and maintain controlled environments. Innovations are constantly emerging, focusing on enhanced filtration efficiency, advanced air handling units (AHUs), intelligent monitoring systems, and modular construction materials. Performance metrics are crucial, with key parameters including particle count per unit volume (e.g., ISO Class 1 to Class 9), air change rates, differential pressure, temperature, and humidity control. Unique selling propositions often lie in the integration of smart technologies for predictive maintenance, energy optimization, and seamless data logging for regulatory compliance.
Key Drivers, Barriers & Challenges in Clean Room System Integration
The Clean Room System Integration market is propelled by several key drivers. The escalating demand for high-purity environments in critical industries like semiconductor manufacturing, pharmaceuticals, and biotechnology is paramount. Rapid technological advancements in these sectors necessitate increasingly stringent contamination control measures. Furthermore, evolving global regulatory frameworks and quality standards, such as GMP and ISO certifications, are compelling businesses to invest in advanced cleanroom solutions. Economic growth in emerging markets, coupled with government initiatives to foster domestic advanced manufacturing, also acts as a significant growth accelerator.
- Technological: Demand for ultra-clean environments, smart monitoring, energy efficiency.
- Economic: Growth in end-user industries, government incentives for manufacturing.
- Policy-Driven: Stricter regulatory compliance and quality standards.
However, the market faces several challenges and restraints. The high upfront cost associated with designing and implementing sophisticated cleanroom systems can be a significant barrier, especially for small and medium-sized enterprises. Project timelines can also be lengthy and complex, requiring meticulous planning and execution. Supply chain disruptions, particularly for specialized components and materials, can lead to project delays and increased costs. Intense competition among system integrators, often leading to price pressures, also poses a challenge.
- Supply Chain Issues: Procurement delays for specialized equipment and materials.
- Regulatory Hurdles: Navigating diverse and evolving international compliance standards.
- Competitive Pressures: Intense competition leading to margin erosion.
- High Capital Investment: Significant upfront costs for advanced cleanroom solutions.
Emerging Opportunities in Clean Room System Integration
Emerging opportunities in the Clean Room System Integration market are largely driven by innovation and the expansion of new application areas. The growing field of advanced therapeutics, including cell and gene therapy, presents a significant untapped market requiring highly specialized and sterile environments. Furthermore, the increasing focus on sustainability is creating demand for energy-efficient cleanroom designs and the use of recycled or eco-friendly materials, opening avenues for green cleanroom technologies. The integration of IoT and AI for predictive maintenance and process optimization within cleanrooms offers substantial opportunities for service providers to offer value-added solutions beyond initial installation.
Growth Accelerators in the Clean Room System Integration Industry
Several factors are acting as catalysts for long-term growth in the Clean Room System Integration industry. Technological breakthroughs in filtration media, HVAC efficiency, and smart sensing are continuously improving the performance and cost-effectiveness of cleanroom systems. Strategic partnerships between cleanroom integrators, equipment manufacturers, and end-users are fostering collaborative innovation and ensuring that solutions meet evolving industry needs. Market expansion strategies, including a focus on emerging economies and the development of standardized modular solutions, are broadening the accessibility of advanced cleanroom technologies. The increasing adoption of Industry 4.0 principles within cleanroom operations, leading to greater automation and data integration, will further propel growth.
Key Players Shaping the Clean Room System Integration Market
- Exyte
- AAF International
- Camfil
- Connect 2 Cleanrooms
- Brecon Group
- Asgard Cleanroom Solutions
- Clean Rooms West, Inc.
- CEEDI
- EDRI
- CEFOC
- CESE2
- Acter Group
- L&K Engineering (Suzhou) Co.
- BOTH Engineering Technology
- UIS Company
Notable Milestones in Clean Room System Integration Sector
- 2019: Increased adoption of modular cleanroom technologies for faster deployment.
- 2020: Enhanced focus on remote monitoring and validation due to global health events.
- 2021: Advancements in HEPA and ULPA filter technology offering higher efficiency and longer lifespan.
- 2022: Greater integration of IoT sensors for real-time environmental data tracking and analysis.
- 2023: Growing demand for energy-efficient HVAC systems in cleanroom designs.
- 2024: Emergence of AI-driven predictive maintenance solutions for cleanroom infrastructure.
In-Depth Clean Room System Integration Market Outlook
The future outlook for the Clean Room System Integration market is exceptionally bright, driven by sustained demand from core industries and the emergence of new high-growth sectors. Growth accelerators such as technological innovation in filtration and automation, coupled with strategic partnerships for end-to-end solutions, will continue to propel the market forward. The increasing emphasis on product quality, regulatory compliance, and operational efficiency across the semiconductor, medical, and pharmaceutical industries ensures a consistent need for advanced cleanroom systems. Emerging opportunities in areas like cell and gene therapy and the demand for sustainable cleanroom designs will further diversify and expand the market's reach, positioning it for robust and continuous expansion.
Clean Room System Integration Segmentation
-
1. Application
- 1.1. Semiconductor Industry
- 1.2. Precision Manufacturing Industry
- 1.3. Medical Industry
- 1.4. Pharmaceutical and Food Industry
- 1.5. Others
-
2. Types
- 2.1. Industrial-Grade Clean Room
- 2.2. Biologica-Gradel Clean Room
Clean Room System Integration Segmentation By Geography
-
1. North America
- 1.1. United States
- 1.2. Canada
- 1.3. Mexico
-
2. South America
- 2.1. Brazil
- 2.2. Argentina
- 2.3. Rest of South America
-
3. Europe
- 3.1. United Kingdom
- 3.2. Germany
- 3.3. France
- 3.4. Italy
- 3.5. Spain
- 3.6. Russia
- 3.7. Benelux
- 3.8. Nordics
- 3.9. Rest of Europe
-
4. Middle East & Africa
- 4.1. Turkey
- 4.2. Israel
- 4.3. GCC
- 4.4. North Africa
- 4.5. South Africa
- 4.6. Rest of Middle East & Africa
-
5. Asia Pacific
- 5.1. China
- 5.2. India
- 5.3. Japan
- 5.4. South Korea
- 5.5. ASEAN
- 5.6. Oceania
- 5.7. Rest of Asia Pacific
Clean Room System Integration REPORT HIGHLIGHTS
| Aspects | Details |
|---|---|
| Study Period | 2019-2033 |
| Base Year | 2024 |
| Estimated Year | 2025 |
| Forecast Period | 2025-2033 |
| Historical Period | 2019-2024 |
| Growth Rate | CAGR of XX% from 2019-2033 |
| Segmentation |
|
Table of Contents
- 1. Introduction
- 1.1. Research Scope
- 1.2. Market Segmentation
- 1.3. Research Methodology
- 1.4. Definitions and Assumptions
- 2. Executive Summary
- 2.1. Introduction
- 3. Market Dynamics
- 3.1. Introduction
- 3.2. Market Drivers
- 3.3. Market Restrains
- 3.4. Market Trends
- 4. Market Factor Analysis
- 4.1. Porters Five Forces
- 4.2. Supply/Value Chain
- 4.3. PESTEL analysis
- 4.4. Market Entropy
- 4.5. Patent/Trademark Analysis
- 5. Global Clean Room System Integration Analysis, Insights and Forecast, 2019-2031
- 5.1. Market Analysis, Insights and Forecast - by Application
- 5.1.1. Semiconductor Industry
- 5.1.2. Precision Manufacturing Industry
- 5.1.3. Medical Industry
- 5.1.4. Pharmaceutical and Food Industry
- 5.1.5. Others
- 5.2. Market Analysis, Insights and Forecast - by Types
- 5.2.1. Industrial-Grade Clean Room
- 5.2.2. Biologica-Gradel Clean Room
- 5.3. Market Analysis, Insights and Forecast - by Region
- 5.3.1. North America
- 5.3.2. South America
- 5.3.3. Europe
- 5.3.4. Middle East & Africa
- 5.3.5. Asia Pacific
- 5.1. Market Analysis, Insights and Forecast - by Application
- 6. North America Clean Room System Integration Analysis, Insights and Forecast, 2019-2031
- 6.1. Market Analysis, Insights and Forecast - by Application
- 6.1.1. Semiconductor Industry
- 6.1.2. Precision Manufacturing Industry
- 6.1.3. Medical Industry
- 6.1.4. Pharmaceutical and Food Industry
- 6.1.5. Others
- 6.2. Market Analysis, Insights and Forecast - by Types
- 6.2.1. Industrial-Grade Clean Room
- 6.2.2. Biologica-Gradel Clean Room
- 6.1. Market Analysis, Insights and Forecast - by Application
- 7. South America Clean Room System Integration Analysis, Insights and Forecast, 2019-2031
- 7.1. Market Analysis, Insights and Forecast - by Application
- 7.1.1. Semiconductor Industry
- 7.1.2. Precision Manufacturing Industry
- 7.1.3. Medical Industry
- 7.1.4. Pharmaceutical and Food Industry
- 7.1.5. Others
- 7.2. Market Analysis, Insights and Forecast - by Types
- 7.2.1. Industrial-Grade Clean Room
- 7.2.2. Biologica-Gradel Clean Room
- 7.1. Market Analysis, Insights and Forecast - by Application
- 8. Europe Clean Room System Integration Analysis, Insights and Forecast, 2019-2031
- 8.1. Market Analysis, Insights and Forecast - by Application
- 8.1.1. Semiconductor Industry
- 8.1.2. Precision Manufacturing Industry
- 8.1.3. Medical Industry
- 8.1.4. Pharmaceutical and Food Industry
- 8.1.5. Others
- 8.2. Market Analysis, Insights and Forecast - by Types
- 8.2.1. Industrial-Grade Clean Room
- 8.2.2. Biologica-Gradel Clean Room
- 8.1. Market Analysis, Insights and Forecast - by Application
- 9. Middle East & Africa Clean Room System Integration Analysis, Insights and Forecast, 2019-2031
- 9.1. Market Analysis, Insights and Forecast - by Application
- 9.1.1. Semiconductor Industry
- 9.1.2. Precision Manufacturing Industry
- 9.1.3. Medical Industry
- 9.1.4. Pharmaceutical and Food Industry
- 9.1.5. Others
- 9.2. Market Analysis, Insights and Forecast - by Types
- 9.2.1. Industrial-Grade Clean Room
- 9.2.2. Biologica-Gradel Clean Room
- 9.1. Market Analysis, Insights and Forecast - by Application
- 10. Asia Pacific Clean Room System Integration Analysis, Insights and Forecast, 2019-2031
- 10.1. Market Analysis, Insights and Forecast - by Application
- 10.1.1. Semiconductor Industry
- 10.1.2. Precision Manufacturing Industry
- 10.1.3. Medical Industry
- 10.1.4. Pharmaceutical and Food Industry
- 10.1.5. Others
- 10.2. Market Analysis, Insights and Forecast - by Types
- 10.2.1. Industrial-Grade Clean Room
- 10.2.2. Biologica-Gradel Clean Room
- 10.1. Market Analysis, Insights and Forecast - by Application
- 11. Competitive Analysis
- 11.1. Global Market Share Analysis 2024
- 11.2. Company Profiles
- 11.2.1 Exyte
- 11.2.1.1. Overview
- 11.2.1.2. Products
- 11.2.1.3. SWOT Analysis
- 11.2.1.4. Recent Developments
- 11.2.1.5. Financials (Based on Availability)
- 11.2.2 AAF International
- 11.2.2.1. Overview
- 11.2.2.2. Products
- 11.2.2.3. SWOT Analysis
- 11.2.2.4. Recent Developments
- 11.2.2.5. Financials (Based on Availability)
- 11.2.3 Camfil
- 11.2.3.1. Overview
- 11.2.3.2. Products
- 11.2.3.3. SWOT Analysis
- 11.2.3.4. Recent Developments
- 11.2.3.5. Financials (Based on Availability)
- 11.2.4 Connect 2 Cleanrooms
- 11.2.4.1. Overview
- 11.2.4.2. Products
- 11.2.4.3. SWOT Analysis
- 11.2.4.4. Recent Developments
- 11.2.4.5. Financials (Based on Availability)
- 11.2.5 Brecon Group
- 11.2.5.1. Overview
- 11.2.5.2. Products
- 11.2.5.3. SWOT Analysis
- 11.2.5.4. Recent Developments
- 11.2.5.5. Financials (Based on Availability)
- 11.2.6 Asgard Cleanroom Solutions
- 11.2.6.1. Overview
- 11.2.6.2. Products
- 11.2.6.3. SWOT Analysis
- 11.2.6.4. Recent Developments
- 11.2.6.5. Financials (Based on Availability)
- 11.2.7 Clean Rooms West
- 11.2.7.1. Overview
- 11.2.7.2. Products
- 11.2.7.3. SWOT Analysis
- 11.2.7.4. Recent Developments
- 11.2.7.5. Financials (Based on Availability)
- 11.2.8 Inc.
- 11.2.8.1. Overview
- 11.2.8.2. Products
- 11.2.8.3. SWOT Analysis
- 11.2.8.4. Recent Developments
- 11.2.8.5. Financials (Based on Availability)
- 11.2.9 CEEDI
- 11.2.9.1. Overview
- 11.2.9.2. Products
- 11.2.9.3. SWOT Analysis
- 11.2.9.4. Recent Developments
- 11.2.9.5. Financials (Based on Availability)
- 11.2.10 EDRI
- 11.2.10.1. Overview
- 11.2.10.2. Products
- 11.2.10.3. SWOT Analysis
- 11.2.10.4. Recent Developments
- 11.2.10.5. Financials (Based on Availability)
- 11.2.11 CEFOC
- 11.2.11.1. Overview
- 11.2.11.2. Products
- 11.2.11.3. SWOT Analysis
- 11.2.11.4. Recent Developments
- 11.2.11.5. Financials (Based on Availability)
- 11.2.12 CESE2
- 11.2.12.1. Overview
- 11.2.12.2. Products
- 11.2.12.3. SWOT Analysis
- 11.2.12.4. Recent Developments
- 11.2.12.5. Financials (Based on Availability)
- 11.2.13 Acter Group
- 11.2.13.1. Overview
- 11.2.13.2. Products
- 11.2.13.3. SWOT Analysis
- 11.2.13.4. Recent Developments
- 11.2.13.5. Financials (Based on Availability)
- 11.2.14 L&K Engineering (Suzhou) Co.
- 11.2.14.1. Overview
- 11.2.14.2. Products
- 11.2.14.3. SWOT Analysis
- 11.2.14.4. Recent Developments
- 11.2.14.5. Financials (Based on Availability)
- 11.2.15 BOTH Engineering Technology
- 11.2.15.1. Overview
- 11.2.15.2. Products
- 11.2.15.3. SWOT Analysis
- 11.2.15.4. Recent Developments
- 11.2.15.5. Financials (Based on Availability)
- 11.2.16 UIS Company
- 11.2.16.1. Overview
- 11.2.16.2. Products
- 11.2.16.3. SWOT Analysis
- 11.2.16.4. Recent Developments
- 11.2.16.5. Financials (Based on Availability)
- 11.2.1 Exyte
List of Figures
- Figure 1: Global Clean Room System Integration Revenue Breakdown (million, %) by Region 2024 & 2032
- Figure 2: North America Clean Room System Integration Revenue (million), by Application 2024 & 2032
- Figure 3: North America Clean Room System Integration Revenue Share (%), by Application 2024 & 2032
- Figure 4: North America Clean Room System Integration Revenue (million), by Types 2024 & 2032
- Figure 5: North America Clean Room System Integration Revenue Share (%), by Types 2024 & 2032
- Figure 6: North America Clean Room System Integration Revenue (million), by Country 2024 & 2032
- Figure 7: North America Clean Room System Integration Revenue Share (%), by Country 2024 & 2032
- Figure 8: South America Clean Room System Integration Revenue (million), by Application 2024 & 2032
- Figure 9: South America Clean Room System Integration Revenue Share (%), by Application 2024 & 2032
- Figure 10: South America Clean Room System Integration Revenue (million), by Types 2024 & 2032
- Figure 11: South America Clean Room System Integration Revenue Share (%), by Types 2024 & 2032
- Figure 12: South America Clean Room System Integration Revenue (million), by Country 2024 & 2032
- Figure 13: South America Clean Room System Integration Revenue Share (%), by Country 2024 & 2032
- Figure 14: Europe Clean Room System Integration Revenue (million), by Application 2024 & 2032
- Figure 15: Europe Clean Room System Integration Revenue Share (%), by Application 2024 & 2032
- Figure 16: Europe Clean Room System Integration Revenue (million), by Types 2024 & 2032
- Figure 17: Europe Clean Room System Integration Revenue Share (%), by Types 2024 & 2032
- Figure 18: Europe Clean Room System Integration Revenue (million), by Country 2024 & 2032
- Figure 19: Europe Clean Room System Integration Revenue Share (%), by Country 2024 & 2032
- Figure 20: Middle East & Africa Clean Room System Integration Revenue (million), by Application 2024 & 2032
- Figure 21: Middle East & Africa Clean Room System Integration Revenue Share (%), by Application 2024 & 2032
- Figure 22: Middle East & Africa Clean Room System Integration Revenue (million), by Types 2024 & 2032
- Figure 23: Middle East & Africa Clean Room System Integration Revenue Share (%), by Types 2024 & 2032
- Figure 24: Middle East & Africa Clean Room System Integration Revenue (million), by Country 2024 & 2032
- Figure 25: Middle East & Africa Clean Room System Integration Revenue Share (%), by Country 2024 & 2032
- Figure 26: Asia Pacific Clean Room System Integration Revenue (million), by Application 2024 & 2032
- Figure 27: Asia Pacific Clean Room System Integration Revenue Share (%), by Application 2024 & 2032
- Figure 28: Asia Pacific Clean Room System Integration Revenue (million), by Types 2024 & 2032
- Figure 29: Asia Pacific Clean Room System Integration Revenue Share (%), by Types 2024 & 2032
- Figure 30: Asia Pacific Clean Room System Integration Revenue (million), by Country 2024 & 2032
- Figure 31: Asia Pacific Clean Room System Integration Revenue Share (%), by Country 2024 & 2032
List of Tables
- Table 1: Global Clean Room System Integration Revenue million Forecast, by Region 2019 & 2032
- Table 2: Global Clean Room System Integration Revenue million Forecast, by Application 2019 & 2032
- Table 3: Global Clean Room System Integration Revenue million Forecast, by Types 2019 & 2032
- Table 4: Global Clean Room System Integration Revenue million Forecast, by Region 2019 & 2032
- Table 5: Global Clean Room System Integration Revenue million Forecast, by Application 2019 & 2032
- Table 6: Global Clean Room System Integration Revenue million Forecast, by Types 2019 & 2032
- Table 7: Global Clean Room System Integration Revenue million Forecast, by Country 2019 & 2032
- Table 8: United States Clean Room System Integration Revenue (million) Forecast, by Application 2019 & 2032
- Table 9: Canada Clean Room System Integration Revenue (million) Forecast, by Application 2019 & 2032
- Table 10: Mexico Clean Room System Integration Revenue (million) Forecast, by Application 2019 & 2032
- Table 11: Global Clean Room System Integration Revenue million Forecast, by Application 2019 & 2032
- Table 12: Global Clean Room System Integration Revenue million Forecast, by Types 2019 & 2032
- Table 13: Global Clean Room System Integration Revenue million Forecast, by Country 2019 & 2032
- Table 14: Brazil Clean Room System Integration Revenue (million) Forecast, by Application 2019 & 2032
- Table 15: Argentina Clean Room System Integration Revenue (million) Forecast, by Application 2019 & 2032
- Table 16: Rest of South America Clean Room System Integration Revenue (million) Forecast, by Application 2019 & 2032
- Table 17: Global Clean Room System Integration Revenue million Forecast, by Application 2019 & 2032
- Table 18: Global Clean Room System Integration Revenue million Forecast, by Types 2019 & 2032
- Table 19: Global Clean Room System Integration Revenue million Forecast, by Country 2019 & 2032
- Table 20: United Kingdom Clean Room System Integration Revenue (million) Forecast, by Application 2019 & 2032
- Table 21: Germany Clean Room System Integration Revenue (million) Forecast, by Application 2019 & 2032
- Table 22: France Clean Room System Integration Revenue (million) Forecast, by Application 2019 & 2032
- Table 23: Italy Clean Room System Integration Revenue (million) Forecast, by Application 2019 & 2032
- Table 24: Spain Clean Room System Integration Revenue (million) Forecast, by Application 2019 & 2032
- Table 25: Russia Clean Room System Integration Revenue (million) Forecast, by Application 2019 & 2032
- Table 26: Benelux Clean Room System Integration Revenue (million) Forecast, by Application 2019 & 2032
- Table 27: Nordics Clean Room System Integration Revenue (million) Forecast, by Application 2019 & 2032
- Table 28: Rest of Europe Clean Room System Integration Revenue (million) Forecast, by Application 2019 & 2032
- Table 29: Global Clean Room System Integration Revenue million Forecast, by Application 2019 & 2032
- Table 30: Global Clean Room System Integration Revenue million Forecast, by Types 2019 & 2032
- Table 31: Global Clean Room System Integration Revenue million Forecast, by Country 2019 & 2032
- Table 32: Turkey Clean Room System Integration Revenue (million) Forecast, by Application 2019 & 2032
- Table 33: Israel Clean Room System Integration Revenue (million) Forecast, by Application 2019 & 2032
- Table 34: GCC Clean Room System Integration Revenue (million) Forecast, by Application 2019 & 2032
- Table 35: North Africa Clean Room System Integration Revenue (million) Forecast, by Application 2019 & 2032
- Table 36: South Africa Clean Room System Integration Revenue (million) Forecast, by Application 2019 & 2032
- Table 37: Rest of Middle East & Africa Clean Room System Integration Revenue (million) Forecast, by Application 2019 & 2032
- Table 38: Global Clean Room System Integration Revenue million Forecast, by Application 2019 & 2032
- Table 39: Global Clean Room System Integration Revenue million Forecast, by Types 2019 & 2032
- Table 40: Global Clean Room System Integration Revenue million Forecast, by Country 2019 & 2032
- Table 41: China Clean Room System Integration Revenue (million) Forecast, by Application 2019 & 2032
- Table 42: India Clean Room System Integration Revenue (million) Forecast, by Application 2019 & 2032
- Table 43: Japan Clean Room System Integration Revenue (million) Forecast, by Application 2019 & 2032
- Table 44: South Korea Clean Room System Integration Revenue (million) Forecast, by Application 2019 & 2032
- Table 45: ASEAN Clean Room System Integration Revenue (million) Forecast, by Application 2019 & 2032
- Table 46: Oceania Clean Room System Integration Revenue (million) Forecast, by Application 2019 & 2032
- Table 47: Rest of Asia Pacific Clean Room System Integration Revenue (million) Forecast, by Application 2019 & 2032
Frequently Asked Questions
1. What is the projected Compound Annual Growth Rate (CAGR) of the Clean Room System Integration?
The projected CAGR is approximately XX%.
2. Which companies are prominent players in the Clean Room System Integration?
Key companies in the market include Exyte, AAF International, Camfil, Connect 2 Cleanrooms, Brecon Group, Asgard Cleanroom Solutions, Clean Rooms West, Inc., CEEDI, EDRI, CEFOC, CESE2, Acter Group, L&K Engineering (Suzhou) Co., BOTH Engineering Technology, UIS Company.
3. What are the main segments of the Clean Room System Integration?
The market segments include Application, Types.
4. Can you provide details about the market size?
The market size is estimated to be USD XXX million as of 2022.
5. What are some drivers contributing to market growth?
N/A
6. What are the notable trends driving market growth?
N/A
7. Are there any restraints impacting market growth?
N/A
8. Can you provide examples of recent developments in the market?
N/A
9. What pricing options are available for accessing the report?
Pricing options include single-user, multi-user, and enterprise licenses priced at USD 4900.00, USD 7350.00, and USD 9800.00 respectively.
10. Is the market size provided in terms of value or volume?
The market size is provided in terms of value, measured in million.
11. Are there any specific market keywords associated with the report?
Yes, the market keyword associated with the report is "Clean Room System Integration," which aids in identifying and referencing the specific market segment covered.
12. How do I determine which pricing option suits my needs best?
The pricing options vary based on user requirements and access needs. Individual users may opt for single-user licenses, while businesses requiring broader access may choose multi-user or enterprise licenses for cost-effective access to the report.
13. Are there any additional resources or data provided in the Clean Room System Integration report?
While the report offers comprehensive insights, it's advisable to review the specific contents or supplementary materials provided to ascertain if additional resources or data are available.
14. How can I stay updated on further developments or reports in the Clean Room System Integration?
To stay informed about further developments, trends, and reports in the Clean Room System Integration, consider subscribing to industry newsletters, following relevant companies and organizations, or regularly checking reputable industry news sources and publications.
Methodology
Step 1 - Identification of Relevant Samples Size from Population Database


Step 2 - Approaches for Defining Global Market Size (Value, Volume* & Price*)

Note*: In applicable scenarios
Step 3 - Data Sources
Primary Research
- Web Analytics
- Survey Reports
- Research Institute
- Latest Research Reports
- Opinion Leaders
Secondary Research
- Annual Reports
- White Paper
- Latest Press Release
- Industry Association
- Paid Database
- Investor Presentations

Step 4 - Data Triangulation
Involves using different sources of information in order to increase the validity of a study
These sources are likely to be stakeholders in a program - participants, other researchers, program staff, other community members, and so on.
Then we put all data in single framework & apply various statistical tools to find out the dynamic on the market.
During the analysis stage, feedback from the stakeholder groups would be compared to determine areas of agreement as well as areas of divergence
