

Key Insights
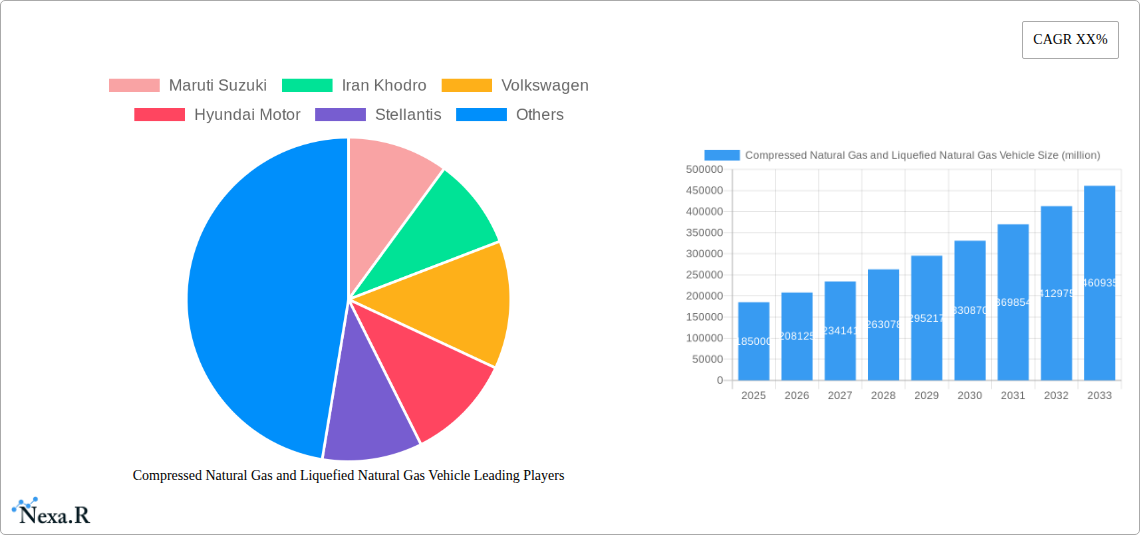
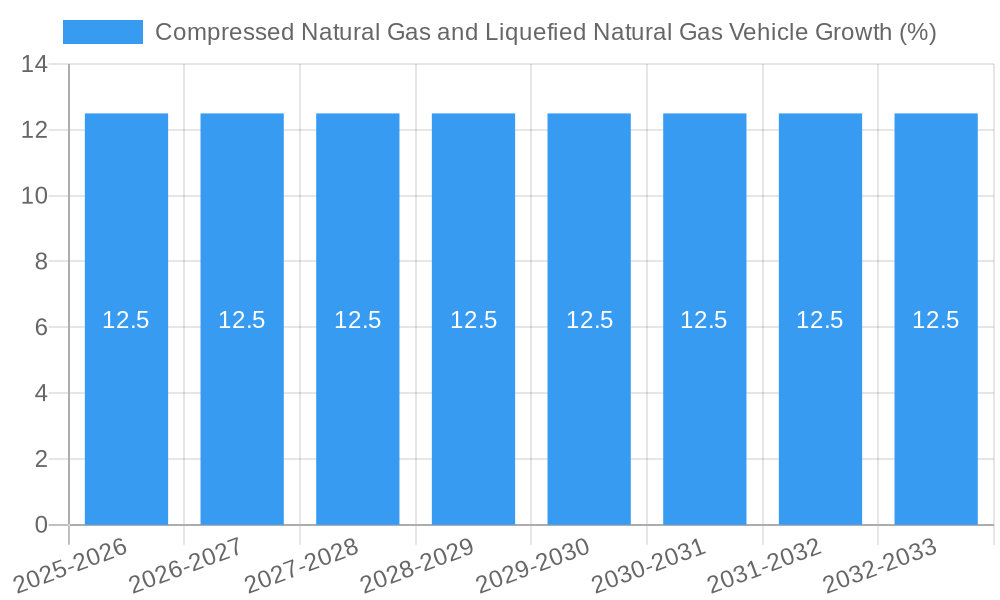
The global Compressed Natural Gas (CNG) and Liquefied Natural Gas (LNG) vehicle market is poised for significant expansion, projected to reach an estimated USD 185,000 million by 2025, with a robust Compound Annual Growth Rate (CAGR) of 12.5% during the forecast period of 2025-2033. This upward trajectory is primarily fueled by the increasing global emphasis on reducing vehicular emissions and the inherent cost-effectiveness of natural gas as a fuel compared to traditional petroleum products. Stringent environmental regulations worldwide are compelling manufacturers and fleet operators to adopt cleaner fuel alternatives, making CNG and LNG vehicles a highly attractive proposition. Furthermore, the growing government initiatives supporting the adoption of alternative fuel vehicles, including subsidies and infrastructure development for refueling stations, are acting as strong catalysts for market growth. The increasing volatility of crude oil prices also adds to the appeal of natural gas, offering greater fuel cost predictability and stability for end-users.
The market is segmented into Passenger Vehicles and Commercial Vehicles, with the latter expected to witness a more dominant share due to the substantial operational cost savings offered by CNG and LNG in high-mileage applications like trucking and public transportation. Within the types, both CNG and LNG segments are experiencing healthy growth, driven by their respective advantages. CNG offers a more widespread existing infrastructure, while LNG provides greater energy density and longer range, making it ideal for heavy-duty applications. Key players like Maruti Suzuki, Volkswagen, Hyundai Motor, and Volvo Truck are actively investing in research and development, expanding their portfolios of CNG and LNG-powered vehicles, and forging strategic partnerships to bolster their market presence. However, the market's growth could be tempered by the significant initial investment required for vehicle purchase and the ongoing need for widespread refueling infrastructure development, particularly in developing regions.
Compressed Natural Gas and Liquefied Natural Gas Vehicle Market: Comprehensive Growth Outlook (2019-2033)
This in-depth report provides a meticulous analysis of the global Compressed Natural Gas (CNG) and Liquefied Natural Gas (LNG) vehicle market. Examining the period from 2019 to 2033, with a base year of 2025, this study offers critical insights into market dynamics, growth trajectories, regional dominance, product innovations, and the strategic landscape. For industry professionals, policymakers, and investors seeking to understand the evolving clean energy transportation sector, this report is an indispensable resource. The analysis encompasses parent and child market segmentation, offering a granular view of opportunities across various applications and vehicle types.
Compressed Natural Gas and Liquefied Natural Gas Vehicle Market Dynamics & Structure
The Compressed Natural Gas (CNG) and Liquefied Natural Gas (LNG) vehicle market is characterized by a moderate to high degree of market concentration, driven by significant capital investment requirements for manufacturing and infrastructure development. Technological innovation is a key driver, with continuous advancements in engine efficiency, fuel storage systems, and refueling infrastructure aimed at improving performance, safety, and cost-effectiveness. Regulatory frameworks, particularly emission standards and government incentives for alternative fuels, play a pivotal role in shaping market adoption rates. Competitive product substitutes, such as electric vehicles (EVs) and hydrogen fuel cell vehicles, are becoming increasingly viable, posing a significant challenge to CNG and LNG market expansion. End-user demographics are diverse, ranging from large fleet operators in the commercial vehicle segment seeking lower operating costs and reduced emissions, to individual consumers in specific regions where natural gas is readily available and affordable. Mergers and acquisitions (M&A) trends are observed as major automotive manufacturers and energy companies consolidate their positions and expand their alternative fuel portfolios.
- Market Concentration: Dominated by a few key players, with significant investments required for R&D and manufacturing.
- Technological Innovation Drivers: Focus on improving fuel efficiency, reducing refueling times, enhancing safety features, and optimizing engine performance for CNG and LNG.
- Regulatory Frameworks: Emission reduction targets and government subsidies for alternative fuels are critical to market growth.
- Competitive Product Substitutes: Electric vehicles (EVs) and hydrogen fuel cell vehicles represent significant competition, necessitating ongoing innovation in CNG/LNG technology.
- End-User Demographics: Primarily commercial fleets (trucking, public transportation) seeking cost savings and emission compliance, with growing interest in passenger vehicles in specific markets.
- M&A Trends: Strategic acquisitions by established automotive players and energy companies to enhance their presence in the clean energy vehicle sector.
Compressed Natural Gas and Liquefied Natural Gas Vehicle Growth Trends & Insights
The global Compressed Natural Gas (CNG) and Liquefied Natural Gas (LNG) vehicle market is projected to experience a robust Compound Annual Growth Rate (CAGR) of approximately 7.5% during the forecast period of 2025–2033. The market size, estimated at $XX billion in the base year 2025, is expected to reach $XX billion by 2033, reflecting a significant expansion driven by a confluence of economic, environmental, and technological factors. Adoption rates are steadily increasing, particularly in regions with well-established natural gas infrastructure and supportive government policies. Technological disruptions are primarily focused on enhancing the efficiency and performance of internal combustion engines adapted for natural gas, alongside the development of more advanced and safer fuel storage solutions. Consumer behavior is shifting towards cleaner transportation options, with a growing awareness of the cost-effectiveness and reduced environmental impact of CNG and LNG vehicles compared to traditional fossil fuel counterparts. This evolution is further fueled by the increasing availability of diverse vehicle models, catering to both passenger and commercial applications. The market penetration of CNG and LNG vehicles, while varying by region, is on an upward trajectory as the benefits of natural gas as a cleaner and more affordable fuel become more apparent to end-users and fleet operators alike. This growth is underpinned by a strategic shift in the automotive industry towards diversifying fuel sources and reducing dependence on volatile fossil fuel markets. The projected market expansion signifies a growing confidence in natural gas as a viable transitional fuel and a significant contributor to decarbonization efforts in the transportation sector.
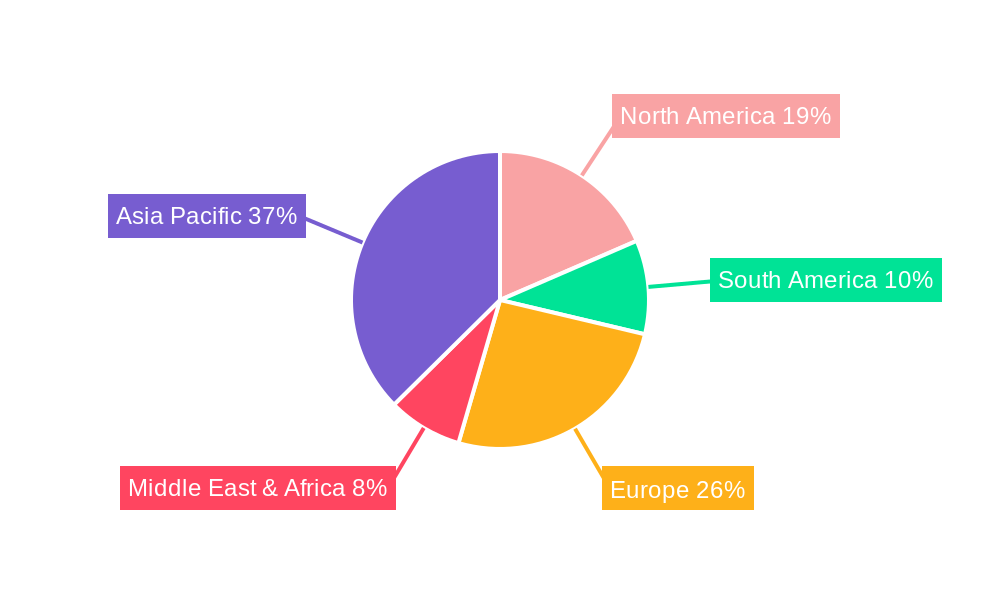
Dominant Regions, Countries, or Segments in Compressed Natural Gas and Liquefied Natural Gas Vehicle
The Commercial Vehicle segment, particularly LNG Vehicles in long-haul trucking, is poised to be the dominant growth driver for the Compressed Natural Gas and Liquefied Natural Gas vehicle market. This dominance is fueled by substantial economic advantages for fleet operators, driven by lower fuel costs per mile compared to diesel and gasoline, and extended operational range offered by LNG. Furthermore, increasingly stringent emission regulations worldwide, especially concerning particulate matter and nitrogen oxides (NOx) in heavy-duty transportation, make LNG an attractive compliance solution. Countries with robust natural gas production and distribution networks, such as the United States, Canada, China, and various nations in Europe, are at the forefront of this adoption.
- Dominant Segment: Commercial Vehicle (especially LNG Trucks for long-haul applications).
- Key Drivers:
- Economic Viability: Lower fuel costs per kilometer/mile for large fleets.
- Regulatory Compliance: Meeting stringent emission standards for heavy-duty vehicles.
- Infrastructure Availability: Presence of dedicated LNG refueling stations along major transport routes.
- Operational Efficiency: Longer range and faster refueling times compared to some alternative fuels.
- Key Drivers:
- Leading Regions/Countries:
- North America (USA, Canada): Strong natural gas reserves, government incentives, and expanding refueling infrastructure.
- Asia-Pacific (China): Government push for cleaner fuels, significant investment in CNG and LNG vehicle production and infrastructure.
- Europe: Stringent emission regulations, focus on decarbonization of road freight, and growing LNG refueling network.
- Growth Potential in Other Segments: While commercial vehicles lead, the Passenger Vehicle segment, particularly CNG variants, shows significant potential in emerging economies where fuel affordability is a primary concern and established CNG distribution networks exist. However, competition from electric passenger vehicles is a notable factor influencing growth here.
Compressed Natural Gas and Liquefied Natural Gas Vehicle Product Landscape
The Compressed Natural Gas (CNG) and Liquefied Natural Gas (LNG) vehicle product landscape is characterized by continuous innovation focused on enhancing fuel efficiency, safety, and operational performance. Key product developments include advanced engine technologies optimized for natural gas combustion, leading to reduced emissions and improved power output. Fuel storage systems are witnessing significant advancements, with lighter, more durable, and higher-capacity CNG tanks and cryogenic LNG tanks being developed to maximize vehicle range and payload capacity. Innovations in refueling technology are also crucial, aiming to reduce refueling times and increase accessibility. Manufacturers are increasingly offering a wider range of models, from light-duty passenger cars and vans to heavy-duty trucks and buses, equipped with sophisticated engine management systems and safety features tailored for gaseous fuels. The unique selling propositions of these vehicles lie in their lower operating costs, reduced greenhouse gas emissions, and cleaner tailpipe emissions compared to their gasoline and diesel counterparts.
Key Drivers, Barriers & Challenges in Compressed Natural Gas and Liquefied Natural Gas Vehicle
Key Drivers: The primary forces propelling the CNG and LNG vehicle market include the pursuit of lower operational costs for fleet operators, driven by the generally lower price of natural gas compared to gasoline and diesel. Stringent government regulations aimed at reducing vehicular emissions, particularly in urban areas and for heavy-duty applications, are a significant catalyst. Furthermore, the increasing availability of natural gas as a domestic fuel source in many countries enhances energy security and reduces reliance on volatile global oil markets. Technological advancements in engine efficiency and fuel storage further contribute to the appeal of these vehicles.
Key Barriers & Challenges: Despite the drivers, the market faces considerable challenges. The primary barrier is the underdeveloped refueling infrastructure, especially for LNG, which requires specialized and more expensive facilities. High upfront vehicle costs, often higher than comparable internal combustion engine vehicles, also deter adoption. The availability of competitive alternatives like electric vehicles, which benefit from rapid charging infrastructure development and increasing government support, poses a significant challenge. Fluctuations in natural gas prices, though generally lower, can also impact the economic attractiveness. Supply chain constraints for components and the availability of skilled technicians for maintenance and repair further add to the complexities.
Emerging Opportunities in Compressed Natural Gas and Liquefied Natural Gas Vehicle
Emerging opportunities in the Compressed Natural Gas (CNG) and Liquefied Natural Gas (LNG) vehicle sector are predominantly found in the expansion of refueling infrastructure, particularly in developing regions and along key freight corridors. The increasing focus on decarbonizing heavy-duty transportation presents a significant opportunity for LNG trucks, especially as governments implement stricter emissions standards. Furthermore, the development of bi-fuel and tri-fuel vehicle technologies, offering flexibility in fuel choice, can cater to a wider consumer base. Innovative applications in niche markets, such as refuse trucks, municipal buses, and agricultural machinery, also represent untapped potential. The growing consumer awareness and preference for sustainable transportation solutions, coupled with the potential for cost savings, are creating a fertile ground for market expansion.
Growth Accelerators in the Compressed Natural Gas and Liquefied Natural Gas Vehicle Industry
Long-term growth in the Compressed Natural Gas (CNG) and Liquefied Natural Gas (LNG) vehicle industry is being accelerated by several critical factors. Technological breakthroughs in engine design are enhancing fuel economy and power output, making natural gas vehicles more competitive. Strategic partnerships between automotive manufacturers, energy companies, and infrastructure providers are crucial for building out refueling networks and improving vehicle accessibility. Government policies that include purchase incentives, tax credits, and mandates for fleet conversion are significant growth accelerators. The increasing global commitment to reducing carbon emissions and improving air quality is creating a sustained demand for cleaner transportation alternatives, with CNG and LNG positioned as viable transitional solutions. Market expansion strategies that focus on educating consumers and fleet managers about the economic and environmental benefits of these vehicles are also vital.
Key Players Shaping the Compressed Natural Gas and Liquefied Natural Gas Vehicle Market
- Maruti Suzuki
- Iran Khodro
- Volkswagen
- Hyundai Motor
- Stellantis
- FAW Group
- Chang'an Automobile
- General Motors
- Honda
- Volvo Truck
- IVECO
- Scania
Notable Milestones in Compressed Natural Gas and Liquefied Natural Gas Vehicle Sector
- 2019: Increased government incentives in several Asian countries for the adoption of CNG vehicles, leading to a surge in sales.
- 2020: Major truck manufacturers, including Volvo Truck and Scania, announce expanded portfolios of LNG-powered heavy-duty trucks to meet stricter emission standards.
- 2021: Significant investment in LNG refueling infrastructure development along key European transport routes by energy conglomerates.
- 2022: Introduction of new, more fuel-efficient CNG engine technologies by leading automotive companies like Hyundai Motor, improving range and performance.
- 2023: Increased focus on developing lightweight and high-capacity CNG and LNG fuel tanks by component manufacturers, addressing payload and range limitations.
- 2024: Growing adoption of CNG and LNG vehicles by municipal public transport fleets in North America and Europe due to cost savings and emission benefits.
In-Depth Compressed Natural Gas and Liquefied Natural Gas Vehicle Market Outlook
The future market potential for Compressed Natural Gas (CNG) and Liquefied Natural Gas (LNG) vehicles remains substantial, driven by an ongoing global imperative to decarbonize transportation and reduce reliance on fossil fuels. Strategic opportunities lie in further expanding the refueling infrastructure, especially in emerging economies and for long-haul trucking routes, which will be critical for wider adoption. Continued technological advancements in engine efficiency, fuel storage, and alternative fuel compatibility, including the potential integration of renewable natural gas (biomethane), will enhance the competitiveness and sustainability credentials of these vehicles. Government support through consistent policy frameworks, incentives, and stricter emission regulations will be paramount in accelerating market growth. The evolving consumer and corporate demand for cleaner, cost-effective transportation solutions positions CNG and LNG vehicles as a significant component of the future mobility landscape, particularly in the commercial vehicle segment.
Compressed Natural Gas and Liquefied Natural Gas Vehicle Segmentation
-
1. Application
- 1.1. Passenger Vehicle
- 1.2. Commercial Vehicle
-
2. Types
- 2.1. CNG Vehicle
- 2.2. LNG Vehicle
Compressed Natural Gas and Liquefied Natural Gas Vehicle Segmentation By Geography
-
1. North America
- 1.1. United States
- 1.2. Canada
- 1.3. Mexico
-
2. South America
- 2.1. Brazil
- 2.2. Argentina
- 2.3. Rest of South America
-
3. Europe
- 3.1. United Kingdom
- 3.2. Germany
- 3.3. France
- 3.4. Italy
- 3.5. Spain
- 3.6. Russia
- 3.7. Benelux
- 3.8. Nordics
- 3.9. Rest of Europe
-
4. Middle East & Africa
- 4.1. Turkey
- 4.2. Israel
- 4.3. GCC
- 4.4. North Africa
- 4.5. South Africa
- 4.6. Rest of Middle East & Africa
-
5. Asia Pacific
- 5.1. China
- 5.2. India
- 5.3. Japan
- 5.4. South Korea
- 5.5. ASEAN
- 5.6. Oceania
- 5.7. Rest of Asia Pacific
Compressed Natural Gas and Liquefied Natural Gas Vehicle REPORT HIGHLIGHTS
| Aspects | Details |
|---|---|
| Study Period | 2019-2033 |
| Base Year | 2024 |
| Estimated Year | 2025 |
| Forecast Period | 2025-2033 |
| Historical Period | 2019-2024 |
| Growth Rate | CAGR of XX% from 2019-2033 |
| Segmentation |
|
Table of Contents
- 1. Introduction
- 1.1. Research Scope
- 1.2. Market Segmentation
- 1.3. Research Methodology
- 1.4. Definitions and Assumptions
- 2. Executive Summary
- 2.1. Introduction
- 3. Market Dynamics
- 3.1. Introduction
- 3.2. Market Drivers
- 3.3. Market Restrains
- 3.4. Market Trends
- 4. Market Factor Analysis
- 4.1. Porters Five Forces
- 4.2. Supply/Value Chain
- 4.3. PESTEL analysis
- 4.4. Market Entropy
- 4.5. Patent/Trademark Analysis
- 5. Global Compressed Natural Gas and Liquefied Natural Gas Vehicle Analysis, Insights and Forecast, 2019-2031
- 5.1. Market Analysis, Insights and Forecast - by Application
- 5.1.1. Passenger Vehicle
- 5.1.2. Commercial Vehicle
- 5.2. Market Analysis, Insights and Forecast - by Types
- 5.2.1. CNG Vehicle
- 5.2.2. LNG Vehicle
- 5.3. Market Analysis, Insights and Forecast - by Region
- 5.3.1. North America
- 5.3.2. South America
- 5.3.3. Europe
- 5.3.4. Middle East & Africa
- 5.3.5. Asia Pacific
- 5.1. Market Analysis, Insights and Forecast - by Application
- 6. North America Compressed Natural Gas and Liquefied Natural Gas Vehicle Analysis, Insights and Forecast, 2019-2031
- 6.1. Market Analysis, Insights and Forecast - by Application
- 6.1.1. Passenger Vehicle
- 6.1.2. Commercial Vehicle
- 6.2. Market Analysis, Insights and Forecast - by Types
- 6.2.1. CNG Vehicle
- 6.2.2. LNG Vehicle
- 6.1. Market Analysis, Insights and Forecast - by Application
- 7. South America Compressed Natural Gas and Liquefied Natural Gas Vehicle Analysis, Insights and Forecast, 2019-2031
- 7.1. Market Analysis, Insights and Forecast - by Application
- 7.1.1. Passenger Vehicle
- 7.1.2. Commercial Vehicle
- 7.2. Market Analysis, Insights and Forecast - by Types
- 7.2.1. CNG Vehicle
- 7.2.2. LNG Vehicle
- 7.1. Market Analysis, Insights and Forecast - by Application
- 8. Europe Compressed Natural Gas and Liquefied Natural Gas Vehicle Analysis, Insights and Forecast, 2019-2031
- 8.1. Market Analysis, Insights and Forecast - by Application
- 8.1.1. Passenger Vehicle
- 8.1.2. Commercial Vehicle
- 8.2. Market Analysis, Insights and Forecast - by Types
- 8.2.1. CNG Vehicle
- 8.2.2. LNG Vehicle
- 8.1. Market Analysis, Insights and Forecast - by Application
- 9. Middle East & Africa Compressed Natural Gas and Liquefied Natural Gas Vehicle Analysis, Insights and Forecast, 2019-2031
- 9.1. Market Analysis, Insights and Forecast - by Application
- 9.1.1. Passenger Vehicle
- 9.1.2. Commercial Vehicle
- 9.2. Market Analysis, Insights and Forecast - by Types
- 9.2.1. CNG Vehicle
- 9.2.2. LNG Vehicle
- 9.1. Market Analysis, Insights and Forecast - by Application
- 10. Asia Pacific Compressed Natural Gas and Liquefied Natural Gas Vehicle Analysis, Insights and Forecast, 2019-2031
- 10.1. Market Analysis, Insights and Forecast - by Application
- 10.1.1. Passenger Vehicle
- 10.1.2. Commercial Vehicle
- 10.2. Market Analysis, Insights and Forecast - by Types
- 10.2.1. CNG Vehicle
- 10.2.2. LNG Vehicle
- 10.1. Market Analysis, Insights and Forecast - by Application
- 11. Competitive Analysis
- 11.1. Global Market Share Analysis 2024
- 11.2. Company Profiles
- 11.2.1 Maruti Suzuki
- 11.2.1.1. Overview
- 11.2.1.2. Products
- 11.2.1.3. SWOT Analysis
- 11.2.1.4. Recent Developments
- 11.2.1.5. Financials (Based on Availability)
- 11.2.2 Iran Khodro
- 11.2.2.1. Overview
- 11.2.2.2. Products
- 11.2.2.3. SWOT Analysis
- 11.2.2.4. Recent Developments
- 11.2.2.5. Financials (Based on Availability)
- 11.2.3 Volkswagen
- 11.2.3.1. Overview
- 11.2.3.2. Products
- 11.2.3.3. SWOT Analysis
- 11.2.3.4. Recent Developments
- 11.2.3.5. Financials (Based on Availability)
- 11.2.4 Hyundai Motor
- 11.2.4.1. Overview
- 11.2.4.2. Products
- 11.2.4.3. SWOT Analysis
- 11.2.4.4. Recent Developments
- 11.2.4.5. Financials (Based on Availability)
- 11.2.5 Stellantis
- 11.2.5.1. Overview
- 11.2.5.2. Products
- 11.2.5.3. SWOT Analysis
- 11.2.5.4. Recent Developments
- 11.2.5.5. Financials (Based on Availability)
- 11.2.6 FAW Group
- 11.2.6.1. Overview
- 11.2.6.2. Products
- 11.2.6.3. SWOT Analysis
- 11.2.6.4. Recent Developments
- 11.2.6.5. Financials (Based on Availability)
- 11.2.7 Chang'an Automobile
- 11.2.7.1. Overview
- 11.2.7.2. Products
- 11.2.7.3. SWOT Analysis
- 11.2.7.4. Recent Developments
- 11.2.7.5. Financials (Based on Availability)
- 11.2.8 General Motors
- 11.2.8.1. Overview
- 11.2.8.2. Products
- 11.2.8.3. SWOT Analysis
- 11.2.8.4. Recent Developments
- 11.2.8.5. Financials (Based on Availability)
- 11.2.9 Honda
- 11.2.9.1. Overview
- 11.2.9.2. Products
- 11.2.9.3. SWOT Analysis
- 11.2.9.4. Recent Developments
- 11.2.9.5. Financials (Based on Availability)
- 11.2.10 Volvo Truck
- 11.2.10.1. Overview
- 11.2.10.2. Products
- 11.2.10.3. SWOT Analysis
- 11.2.10.4. Recent Developments
- 11.2.10.5. Financials (Based on Availability)
- 11.2.11 IVECO
- 11.2.11.1. Overview
- 11.2.11.2. Products
- 11.2.11.3. SWOT Analysis
- 11.2.11.4. Recent Developments
- 11.2.11.5. Financials (Based on Availability)
- 11.2.12 Scania
- 11.2.12.1. Overview
- 11.2.12.2. Products
- 11.2.12.3. SWOT Analysis
- 11.2.12.4. Recent Developments
- 11.2.12.5. Financials (Based on Availability)
- 11.2.1 Maruti Suzuki
List of Figures
- Figure 1: Global Compressed Natural Gas and Liquefied Natural Gas Vehicle Revenue Breakdown (million, %) by Region 2024 & 2032
- Figure 2: North America Compressed Natural Gas and Liquefied Natural Gas Vehicle Revenue (million), by Application 2024 & 2032
- Figure 3: North America Compressed Natural Gas and Liquefied Natural Gas Vehicle Revenue Share (%), by Application 2024 & 2032
- Figure 4: North America Compressed Natural Gas and Liquefied Natural Gas Vehicle Revenue (million), by Types 2024 & 2032
- Figure 5: North America Compressed Natural Gas and Liquefied Natural Gas Vehicle Revenue Share (%), by Types 2024 & 2032
- Figure 6: North America Compressed Natural Gas and Liquefied Natural Gas Vehicle Revenue (million), by Country 2024 & 2032
- Figure 7: North America Compressed Natural Gas and Liquefied Natural Gas Vehicle Revenue Share (%), by Country 2024 & 2032
- Figure 8: South America Compressed Natural Gas and Liquefied Natural Gas Vehicle Revenue (million), by Application 2024 & 2032
- Figure 9: South America Compressed Natural Gas and Liquefied Natural Gas Vehicle Revenue Share (%), by Application 2024 & 2032
- Figure 10: South America Compressed Natural Gas and Liquefied Natural Gas Vehicle Revenue (million), by Types 2024 & 2032
- Figure 11: South America Compressed Natural Gas and Liquefied Natural Gas Vehicle Revenue Share (%), by Types 2024 & 2032
- Figure 12: South America Compressed Natural Gas and Liquefied Natural Gas Vehicle Revenue (million), by Country 2024 & 2032
- Figure 13: South America Compressed Natural Gas and Liquefied Natural Gas Vehicle Revenue Share (%), by Country 2024 & 2032
- Figure 14: Europe Compressed Natural Gas and Liquefied Natural Gas Vehicle Revenue (million), by Application 2024 & 2032
- Figure 15: Europe Compressed Natural Gas and Liquefied Natural Gas Vehicle Revenue Share (%), by Application 2024 & 2032
- Figure 16: Europe Compressed Natural Gas and Liquefied Natural Gas Vehicle Revenue (million), by Types 2024 & 2032
- Figure 17: Europe Compressed Natural Gas and Liquefied Natural Gas Vehicle Revenue Share (%), by Types 2024 & 2032
- Figure 18: Europe Compressed Natural Gas and Liquefied Natural Gas Vehicle Revenue (million), by Country 2024 & 2032
- Figure 19: Europe Compressed Natural Gas and Liquefied Natural Gas Vehicle Revenue Share (%), by Country 2024 & 2032
- Figure 20: Middle East & Africa Compressed Natural Gas and Liquefied Natural Gas Vehicle Revenue (million), by Application 2024 & 2032
- Figure 21: Middle East & Africa Compressed Natural Gas and Liquefied Natural Gas Vehicle Revenue Share (%), by Application 2024 & 2032
- Figure 22: Middle East & Africa Compressed Natural Gas and Liquefied Natural Gas Vehicle Revenue (million), by Types 2024 & 2032
- Figure 23: Middle East & Africa Compressed Natural Gas and Liquefied Natural Gas Vehicle Revenue Share (%), by Types 2024 & 2032
- Figure 24: Middle East & Africa Compressed Natural Gas and Liquefied Natural Gas Vehicle Revenue (million), by Country 2024 & 2032
- Figure 25: Middle East & Africa Compressed Natural Gas and Liquefied Natural Gas Vehicle Revenue Share (%), by Country 2024 & 2032
- Figure 26: Asia Pacific Compressed Natural Gas and Liquefied Natural Gas Vehicle Revenue (million), by Application 2024 & 2032
- Figure 27: Asia Pacific Compressed Natural Gas and Liquefied Natural Gas Vehicle Revenue Share (%), by Application 2024 & 2032
- Figure 28: Asia Pacific Compressed Natural Gas and Liquefied Natural Gas Vehicle Revenue (million), by Types 2024 & 2032
- Figure 29: Asia Pacific Compressed Natural Gas and Liquefied Natural Gas Vehicle Revenue Share (%), by Types 2024 & 2032
- Figure 30: Asia Pacific Compressed Natural Gas and Liquefied Natural Gas Vehicle Revenue (million), by Country 2024 & 2032
- Figure 31: Asia Pacific Compressed Natural Gas and Liquefied Natural Gas Vehicle Revenue Share (%), by Country 2024 & 2032
List of Tables
- Table 1: Global Compressed Natural Gas and Liquefied Natural Gas Vehicle Revenue million Forecast, by Region 2019 & 2032
- Table 2: Global Compressed Natural Gas and Liquefied Natural Gas Vehicle Revenue million Forecast, by Application 2019 & 2032
- Table 3: Global Compressed Natural Gas and Liquefied Natural Gas Vehicle Revenue million Forecast, by Types 2019 & 2032
- Table 4: Global Compressed Natural Gas and Liquefied Natural Gas Vehicle Revenue million Forecast, by Region 2019 & 2032
- Table 5: Global Compressed Natural Gas and Liquefied Natural Gas Vehicle Revenue million Forecast, by Application 2019 & 2032
- Table 6: Global Compressed Natural Gas and Liquefied Natural Gas Vehicle Revenue million Forecast, by Types 2019 & 2032
- Table 7: Global Compressed Natural Gas and Liquefied Natural Gas Vehicle Revenue million Forecast, by Country 2019 & 2032
- Table 8: United States Compressed Natural Gas and Liquefied Natural Gas Vehicle Revenue (million) Forecast, by Application 2019 & 2032
- Table 9: Canada Compressed Natural Gas and Liquefied Natural Gas Vehicle Revenue (million) Forecast, by Application 2019 & 2032
- Table 10: Mexico Compressed Natural Gas and Liquefied Natural Gas Vehicle Revenue (million) Forecast, by Application 2019 & 2032
- Table 11: Global Compressed Natural Gas and Liquefied Natural Gas Vehicle Revenue million Forecast, by Application 2019 & 2032
- Table 12: Global Compressed Natural Gas and Liquefied Natural Gas Vehicle Revenue million Forecast, by Types 2019 & 2032
- Table 13: Global Compressed Natural Gas and Liquefied Natural Gas Vehicle Revenue million Forecast, by Country 2019 & 2032
- Table 14: Brazil Compressed Natural Gas and Liquefied Natural Gas Vehicle Revenue (million) Forecast, by Application 2019 & 2032
- Table 15: Argentina Compressed Natural Gas and Liquefied Natural Gas Vehicle Revenue (million) Forecast, by Application 2019 & 2032
- Table 16: Rest of South America Compressed Natural Gas and Liquefied Natural Gas Vehicle Revenue (million) Forecast, by Application 2019 & 2032
- Table 17: Global Compressed Natural Gas and Liquefied Natural Gas Vehicle Revenue million Forecast, by Application 2019 & 2032
- Table 18: Global Compressed Natural Gas and Liquefied Natural Gas Vehicle Revenue million Forecast, by Types 2019 & 2032
- Table 19: Global Compressed Natural Gas and Liquefied Natural Gas Vehicle Revenue million Forecast, by Country 2019 & 2032
- Table 20: United Kingdom Compressed Natural Gas and Liquefied Natural Gas Vehicle Revenue (million) Forecast, by Application 2019 & 2032
- Table 21: Germany Compressed Natural Gas and Liquefied Natural Gas Vehicle Revenue (million) Forecast, by Application 2019 & 2032
- Table 22: France Compressed Natural Gas and Liquefied Natural Gas Vehicle Revenue (million) Forecast, by Application 2019 & 2032
- Table 23: Italy Compressed Natural Gas and Liquefied Natural Gas Vehicle Revenue (million) Forecast, by Application 2019 & 2032
- Table 24: Spain Compressed Natural Gas and Liquefied Natural Gas Vehicle Revenue (million) Forecast, by Application 2019 & 2032
- Table 25: Russia Compressed Natural Gas and Liquefied Natural Gas Vehicle Revenue (million) Forecast, by Application 2019 & 2032
- Table 26: Benelux Compressed Natural Gas and Liquefied Natural Gas Vehicle Revenue (million) Forecast, by Application 2019 & 2032
- Table 27: Nordics Compressed Natural Gas and Liquefied Natural Gas Vehicle Revenue (million) Forecast, by Application 2019 & 2032
- Table 28: Rest of Europe Compressed Natural Gas and Liquefied Natural Gas Vehicle Revenue (million) Forecast, by Application 2019 & 2032
- Table 29: Global Compressed Natural Gas and Liquefied Natural Gas Vehicle Revenue million Forecast, by Application 2019 & 2032
- Table 30: Global Compressed Natural Gas and Liquefied Natural Gas Vehicle Revenue million Forecast, by Types 2019 & 2032
- Table 31: Global Compressed Natural Gas and Liquefied Natural Gas Vehicle Revenue million Forecast, by Country 2019 & 2032
- Table 32: Turkey Compressed Natural Gas and Liquefied Natural Gas Vehicle Revenue (million) Forecast, by Application 2019 & 2032
- Table 33: Israel Compressed Natural Gas and Liquefied Natural Gas Vehicle Revenue (million) Forecast, by Application 2019 & 2032
- Table 34: GCC Compressed Natural Gas and Liquefied Natural Gas Vehicle Revenue (million) Forecast, by Application 2019 & 2032
- Table 35: North Africa Compressed Natural Gas and Liquefied Natural Gas Vehicle Revenue (million) Forecast, by Application 2019 & 2032
- Table 36: South Africa Compressed Natural Gas and Liquefied Natural Gas Vehicle Revenue (million) Forecast, by Application 2019 & 2032
- Table 37: Rest of Middle East & Africa Compressed Natural Gas and Liquefied Natural Gas Vehicle Revenue (million) Forecast, by Application 2019 & 2032
- Table 38: Global Compressed Natural Gas and Liquefied Natural Gas Vehicle Revenue million Forecast, by Application 2019 & 2032
- Table 39: Global Compressed Natural Gas and Liquefied Natural Gas Vehicle Revenue million Forecast, by Types 2019 & 2032
- Table 40: Global Compressed Natural Gas and Liquefied Natural Gas Vehicle Revenue million Forecast, by Country 2019 & 2032
- Table 41: China Compressed Natural Gas and Liquefied Natural Gas Vehicle Revenue (million) Forecast, by Application 2019 & 2032
- Table 42: India Compressed Natural Gas and Liquefied Natural Gas Vehicle Revenue (million) Forecast, by Application 2019 & 2032
- Table 43: Japan Compressed Natural Gas and Liquefied Natural Gas Vehicle Revenue (million) Forecast, by Application 2019 & 2032
- Table 44: South Korea Compressed Natural Gas and Liquefied Natural Gas Vehicle Revenue (million) Forecast, by Application 2019 & 2032
- Table 45: ASEAN Compressed Natural Gas and Liquefied Natural Gas Vehicle Revenue (million) Forecast, by Application 2019 & 2032
- Table 46: Oceania Compressed Natural Gas and Liquefied Natural Gas Vehicle Revenue (million) Forecast, by Application 2019 & 2032
- Table 47: Rest of Asia Pacific Compressed Natural Gas and Liquefied Natural Gas Vehicle Revenue (million) Forecast, by Application 2019 & 2032
Frequently Asked Questions
1. What is the projected Compound Annual Growth Rate (CAGR) of the Compressed Natural Gas and Liquefied Natural Gas Vehicle?
The projected CAGR is approximately XX%.
2. Which companies are prominent players in the Compressed Natural Gas and Liquefied Natural Gas Vehicle?
Key companies in the market include Maruti Suzuki, Iran Khodro, Volkswagen, Hyundai Motor, Stellantis, FAW Group, Chang'an Automobile, General Motors, Honda, Volvo Truck, IVECO, Scania.
3. What are the main segments of the Compressed Natural Gas and Liquefied Natural Gas Vehicle?
The market segments include Application, Types.
4. Can you provide details about the market size?
The market size is estimated to be USD XXX million as of 2022.
5. What are some drivers contributing to market growth?
N/A
6. What are the notable trends driving market growth?
N/A
7. Are there any restraints impacting market growth?
N/A
8. Can you provide examples of recent developments in the market?
N/A
9. What pricing options are available for accessing the report?
Pricing options include single-user, multi-user, and enterprise licenses priced at USD 5600.00, USD 8400.00, and USD 11200.00 respectively.
10. Is the market size provided in terms of value or volume?
The market size is provided in terms of value, measured in million.
11. Are there any specific market keywords associated with the report?
Yes, the market keyword associated with the report is "Compressed Natural Gas and Liquefied Natural Gas Vehicle," which aids in identifying and referencing the specific market segment covered.
12. How do I determine which pricing option suits my needs best?
The pricing options vary based on user requirements and access needs. Individual users may opt for single-user licenses, while businesses requiring broader access may choose multi-user or enterprise licenses for cost-effective access to the report.
13. Are there any additional resources or data provided in the Compressed Natural Gas and Liquefied Natural Gas Vehicle report?
While the report offers comprehensive insights, it's advisable to review the specific contents or supplementary materials provided to ascertain if additional resources or data are available.
14. How can I stay updated on further developments or reports in the Compressed Natural Gas and Liquefied Natural Gas Vehicle?
To stay informed about further developments, trends, and reports in the Compressed Natural Gas and Liquefied Natural Gas Vehicle, consider subscribing to industry newsletters, following relevant companies and organizations, or regularly checking reputable industry news sources and publications.
Methodology
Step 1 - Identification of Relevant Samples Size from Population Database


Step 2 - Approaches for Defining Global Market Size (Value, Volume* & Price*)

Note*: In applicable scenarios
Step 3 - Data Sources
Primary Research
- Web Analytics
- Survey Reports
- Research Institute
- Latest Research Reports
- Opinion Leaders
Secondary Research
- Annual Reports
- White Paper
- Latest Press Release
- Industry Association
- Paid Database
- Investor Presentations

Step 4 - Data Triangulation
Involves using different sources of information in order to increase the validity of a study
These sources are likely to be stakeholders in a program - participants, other researchers, program staff, other community members, and so on.
Then we put all data in single framework & apply various statistical tools to find out the dynamic on the market.
During the analysis stage, feedback from the stakeholder groups would be compared to determine areas of agreement as well as areas of divergence
