

Key Insights
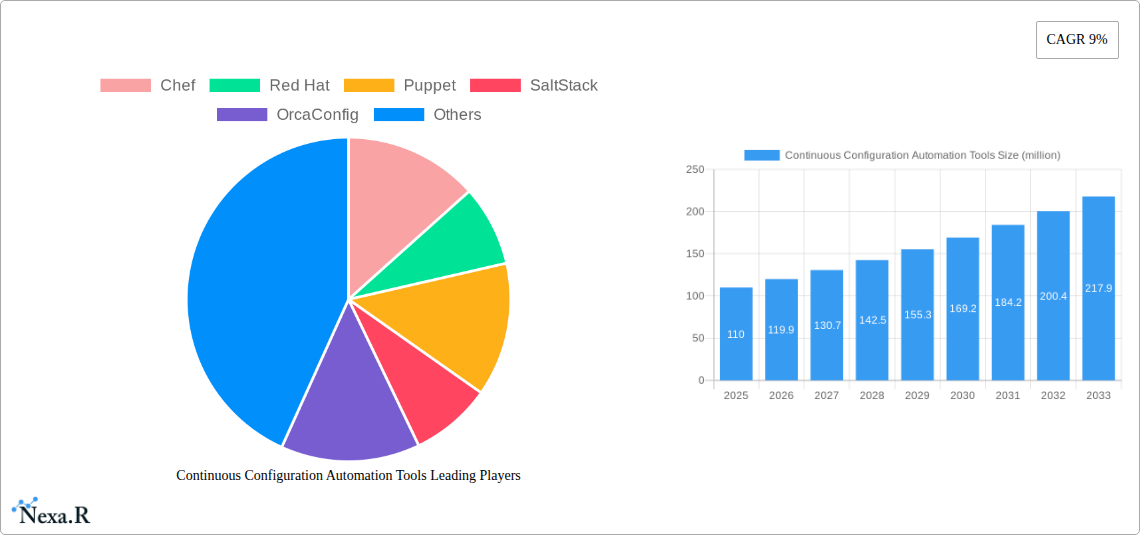
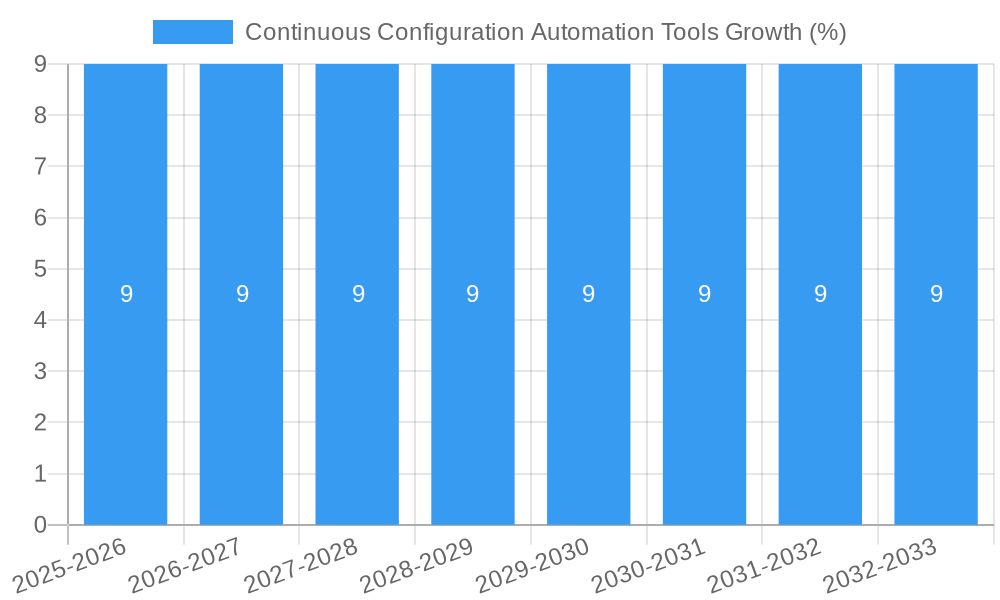
The global Continuous Configuration Automation Tools market is poised for robust growth, projected to reach approximately $110 million by 2025, with a significant Compound Annual Growth Rate (CAGR) of 9%. This expansion is primarily fueled by the escalating demand for enhanced operational efficiency, streamlined IT management, and the widespread adoption of cloud-native architectures and DevOps practices across organizations of all sizes. Large enterprises, in particular, are heavily investing in these solutions to automate complex deployment, configuration, and management tasks, thereby reducing manual errors, accelerating release cycles, and ensuring consistent environments. The increasing complexity of IT infrastructure, coupled with the growing need for agility and scalability, further propels the adoption of these tools. The market is characterized by a strong preference for cloud-based solutions due to their inherent flexibility, scalability, and cost-effectiveness, although web-based alternatives also hold a considerable share, catering to specific deployment needs.
Emerging trends such as the integration of Artificial Intelligence (AI) and Machine Learning (ML) for predictive automation and intelligent self-healing capabilities are expected to shape the future of this market. Furthermore, the increasing emphasis on security automation and compliance management within IT operations is driving the demand for sophisticated configuration automation tools. While the market is expanding, certain restraints, including the initial implementation costs and the need for skilled IT professionals to manage these advanced tools, may pose challenges. However, the overarching benefits of improved productivity, reduced downtime, and enhanced security are expected to outweigh these concerns, driving sustained market growth. Key players like Chef, Red Hat, Puppet, SaltStack, and OrcaConfig are continuously innovating to offer comprehensive solutions that address the evolving needs of the global IT landscape. The Asia Pacific region, driven by rapid digitalization and the burgeoning startup ecosystem, is anticipated to be a significant growth pocket in the coming years.
Continuous Configuration Automation Tools Market Dynamics & Structure
The continuous configuration automation tools market exhibits a moderately concentrated structure, with key players like Chef, Red Hat, Puppet, and SaltStack dominating market share. Technological innovation serves as a primary driver, fueled by the increasing demand for efficient DevOps practices, accelerated software delivery cycles, and enhanced IT operational resilience. Regulatory frameworks, particularly those pertaining to data security and compliance, indirectly influence the adoption of robust automation solutions, pushing organizations towards standardized and auditable configuration management. Competitive product substitutes include manual configuration processes, custom scripting, and less comprehensive automation solutions, but the clear advantages in scalability and error reduction offered by dedicated tools keep them in a strong position. End-user demographics span across Large Enterprises and Small to Medium-sized Enterprises (SMEs), with Large Enterprises often leading in adoption due to larger IT infrastructures and more complex deployment needs. Mergers and acquisition (M&A) trends are observed as established players seek to broaden their portfolios, acquire innovative technologies, and expand their market reach. For instance, recent acquisitions in the infrastructure-as-code and cloud-native automation space are reshaping the competitive landscape. Innovation barriers primarily lie in the complexity of integration with legacy systems and the need for specialized skill sets among IT professionals. The market is projected to see substantial growth driven by cloud adoption and the imperative for continuous integration and continuous delivery (CI/CD) pipelines.
- Market Concentration: Moderately concentrated, with a few dominant players.
- Technological Innovation Drivers: DevOps adoption, CI/CD pipelines, cloud-native architectures.
- Regulatory Frameworks: Data security, compliance mandates, industry-specific regulations.
- Competitive Product Substitutes: Manual configuration, custom scripting, basic automation scripts.
- End-User Demographics: Large Enterprises (primary adopters), SMEs (growing adoption).
- M&A Trends: Strategic acquisitions for technology integration and market expansion.
- Innovation Barriers: Legacy system integration, skilled workforce availability.
Continuous Configuration Automation Tools Growth Trends & Insights
The continuous configuration automation tools market is poised for significant expansion, driven by an accelerating digital transformation across industries. The global market size for continuous configuration automation tools is projected to reach an estimated $7,500 million by 2025, exhibiting a robust Compound Annual Growth Rate (CAGR) of 18.5% during the forecast period of 2025–2033. This remarkable growth trajectory is underpinned by the pervasive adoption of cloud-based infrastructure and microservices architectures, which necessitate sophisticated automation for efficient management and deployment. Organizations are increasingly recognizing the indispensable role of these tools in streamlining IT operations, reducing human error, and accelerating software release cycles, thereby enhancing overall business agility. The historical period from 2019–2024 witnessed a steady climb in adoption as companies began to mature their DevOps practices. The base year of 2025 marks a pivotal point where adoption becomes a strategic imperative rather than a mere operational enhancement.
Technological disruptions, such as the rise of containerization technologies like Kubernetes and the evolution of infrastructure-as-code (IaC) principles, are profoundly shaping the market. Tools that seamlessly integrate with these emerging technologies are experiencing heightened demand. Consumer behavior shifts are also playing a crucial role, with IT decision-makers prioritizing solutions that offer flexibility, scalability, and cost-effectiveness. The move from on-premises solutions to cloud-based and web-based platforms further exemplifies this shift, providing greater accessibility and reducing the burden of infrastructure management. Market penetration is deepening across various industry verticals, including BFSI, healthcare, retail, and technology, as organizations across the board strive for greater operational efficiency and competitive advantage. The continuous evolution of open-source and commercial offerings, coupled with increasing awareness of the benefits of automation, will continue to fuel adoption rates throughout the forecast period. The market penetration is expected to exceed 60% of organizations by the end of the forecast period.
- Market Size Evolution: Projected to reach $7,500 million by 2025, with sustained growth.
- CAGR: 18.5% from 2025–2033, indicating strong growth momentum.
- Adoption Rates: Steadily increasing, driven by digital transformation and DevOps maturity.
- Technological Disruptions: Kubernetes, IaC, containerization are key enablers.
- Consumer Behavior Shifts: Prioritization of flexible, scalable, and cost-effective solutions.
- Market Penetration: Deepening across all industry verticals, projected to exceed 60%.
Dominant Regions, Countries, or Segments in Continuous Configuration Automation Tools
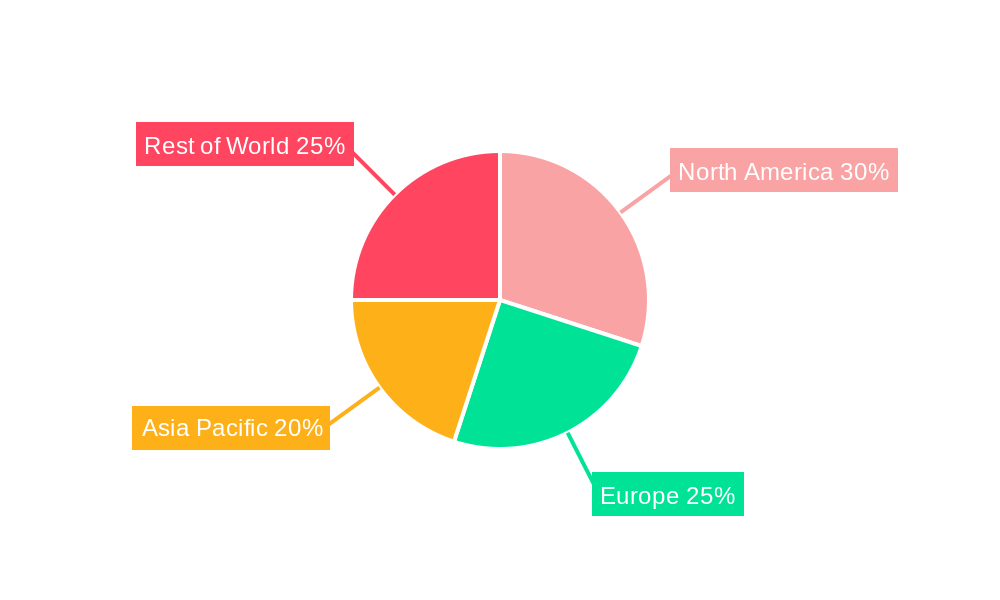
North America, particularly the United States, stands as the dominant region in the continuous configuration automation tools market. This leadership is propelled by several interconnected factors, including a mature technological ecosystem, a high concentration of early adopters of DevOps and cloud technologies, and significant investment in research and development. The presence of major technology companies and a strong startup culture fosters rapid innovation and adoption of cutting-edge automation solutions. Furthermore, stringent data security and compliance regulations in the US mandate robust configuration management practices, driving the demand for advanced tools. The extensive adoption of cloud-based solutions by Large Enterprises in North America, seeking to manage complex, distributed IT environments, is a significant growth engine. The market share of North America in the global continuous configuration automation tools market is estimated to be around 40% in 2025.
The segment of Large Enterprises represents the largest and most influential consumer base, accounting for approximately 65% of the total market revenue in 2025. These organizations leverage continuous configuration automation for managing vast and intricate IT infrastructures, ensuring consistent deployments across hybrid and multi-cloud environments, and enhancing the efficiency of their DevOps teams. The increasing complexity of enterprise IT landscapes, coupled with the imperative to innovate rapidly, makes comprehensive automation solutions indispensable.
Within the types of solutions, Cloud Based configuration automation tools are witnessing the most substantial growth and market penetration, capturing an estimated 70% of the market share in 2025. This dominance is attributed to the pervasive migration of workloads to cloud platforms, where dynamic scaling and rapid provisioning are paramount. Cloud-based solutions offer inherent scalability, flexibility, and easier integration with other cloud services, aligning perfectly with the agile methodologies adopted by modern enterprises.
- Dominant Region: North America (primarily the United States).
- Key Drivers in North America: Mature tech ecosystem, early DevOps adoption, significant R&D investment, stringent regulations.
- Dominant Segment (Application): Large Enterprises (estimated 65% market share in 2025).
- Growth Potential in Large Enterprises: Driven by infrastructure complexity and need for rapid innovation.
- Dominant Segment (Type): Cloud Based (estimated 70% market share in 2025).
- Growth Potential in Cloud Based: Aligned with widespread cloud migration and scalability needs.
Continuous Configuration Automation Tools Product Landscape
The product landscape for continuous configuration automation tools is characterized by rapid innovation and a focus on interoperability and ease of use. Leading solutions such as Chef, Red Hat Ansible Automation Platform, Puppet Enterprise, and SaltStack offer comprehensive capabilities for defining, deploying, and managing infrastructure and applications consistently across diverse environments. Key product innovations include advancements in agentless architectures, enhanced security features like secrets management and policy enforcement, and tighter integrations with cloud platforms (AWS, Azure, GCP), container orchestrators (Kubernetes), and CI/CD pipelines. Performance metrics are typically evaluated based on deployment speed, error rates, configuration drift detection, and the reduction in manual effort. Unique selling propositions often revolve around specific automation paradigms, such as declarative versus imperative configuration, support for a wide array of operating systems and middleware, and robust reporting and auditing capabilities. The trend towards "as-code" principles in infrastructure management is a significant driver of product development, enabling version control, collaboration, and automated testing of configurations.
Key Drivers, Barriers & Challenges in Continuous Configuration Automation Tools
The continuous configuration automation tools market is propelled by several key drivers. The escalating demand for faster software delivery cycles, fueled by the widespread adoption of DevOps and Agile methodologies, is a primary force. Organizations are compelled to automate repetitive tasks to achieve greater efficiency and reduce time-to-market for new features and applications. The increasing complexity of IT infrastructures, spanning hybrid and multi-cloud environments, necessitates sophisticated automation to ensure consistency and prevent configuration drift. Furthermore, the drive for cost optimization and resource efficiency pushes businesses towards automation to reduce manual labor and minimize errors that lead to costly downtime.
However, the market also faces significant barriers and challenges. The initial investment in licensing, implementation, and training can be substantial, posing a hurdle for SMEs. A shortage of skilled professionals with expertise in specific automation tools and Infrastructure as Code (IaC) remains a persistent challenge, impacting adoption rates and successful deployment. Integrating new automation tools with existing legacy systems and complex IT architectures can be a time-consuming and resource-intensive process. Moreover, the rapidly evolving nature of cloud technologies and containerization requires continuous adaptation and updates of automation tools, demanding ongoing investment and learning. Security concerns, particularly around granting broad access to automation tools, also present a challenge that requires robust policy enforcement and auditing capabilities, with a projected 15% impact on adoption timelines for highly regulated industries.
- Key Drivers: Faster software delivery, DevOps/Agile adoption, IT infrastructure complexity, cost optimization, resource efficiency.
- Barriers: High initial investment, shortage of skilled professionals, integration with legacy systems, rapid technological evolution, security concerns.
- Challenges: Complexity of hybrid/multi-cloud management, ensuring consistent security policies, ongoing training and skill development.
Emerging Opportunities in Continuous Configuration Automation Tools
Emerging opportunities in the continuous configuration automation tools market are abundant, driven by the evolving technological landscape and increasing business demands. The proliferation of edge computing and IoT devices presents a new frontier for configuration automation, requiring scalable solutions to manage and secure distributed endpoints. Serverless computing architectures also offer unique opportunities for automating the deployment and management of microservices and functions. The growing emphasis on AI/ML for intelligent automation and predictive maintenance within IT operations creates a demand for tools that can integrate with and leverage these advanced capabilities. Furthermore, the increasing focus on GitOps principles, which extend DevOps practices to infrastructure management using Git as the single source of truth, opens avenues for tools that natively support these workflows. Untapped markets in developing economies, where digital transformation is accelerating, represent significant growth potential.
Growth Accelerators in the Continuous Configuration Automation Industry
Several catalysts are accelerating the growth of the continuous configuration automation industry. Technological breakthroughs, such as advancements in AI-powered anomaly detection for configuration issues and more sophisticated policy-as-code frameworks, are enhancing the capabilities and appeal of these tools. Strategic partnerships between vendors and cloud providers, as well as complementary technology providers, are expanding the reach and integration capabilities of automation solutions, making them more accessible and powerful. Market expansion strategies, including increased focus on self-service automation platforms for developers and enhanced user interfaces, are broadening the user base beyond traditional IT operations teams. The growing recognition of automation as a critical component for business resilience and competitive advantage is also a significant growth accelerator.
Key Players Shaping the Continuous Configuration Automation Tools Market
- Chef
- Red Hat
- Puppet
- SaltStack
- OrcaConfig
Notable Milestones in Continuous Configuration Automation Tools Sector
- 2019: Release of significant updates to core platforms like Puppet Bolt for agentless orchestration, enhancing cross-platform compatibility.
- 2020: Increased adoption of Infrastructure as Code (IaC) principles became a mainstream practice, driving demand for tools that support it.
- 2021: Red Hat Ansible Automation Platform saw major enhancements in its cloud integration capabilities and enterprise security features.
- 2022: Growing interest in GitOps workflows led to the development and integration of tools that support declarative infrastructure management.
- 2023: Continued consolidation and strategic partnerships as companies aimed to offer end-to-end automation solutions.
- 2024: Increased focus on AI and machine learning integration for predictive analytics and intelligent automation within configuration management.
In-Depth Continuous Configuration Automation Tools Market Outlook
The future outlook for the continuous configuration automation tools market is exceptionally bright, driven by a confluence of ongoing digital transformation initiatives and the relentless pursuit of operational excellence by businesses worldwide. The market is expected to be further energized by innovations in AI-driven automation, enabling more proactive and intelligent management of complex IT environments. Strategic alliances and ecosystem development will continue to foster greater interoperability and deliver more comprehensive solutions, empowering organizations to achieve end-to-end automation across their entire software delivery lifecycle. As hybrid and multi-cloud adoption matures, the need for robust and flexible configuration automation will only intensify, creating sustained demand. The expanding reach into emerging economies and the growing adoption by SMEs are also significant indicators of future market expansion. This trajectory points towards a market that will not only grow in size but also in strategic importance for businesses aiming to remain agile, secure, and competitive in the digital age.
Continuous Configuration Automation Tools Segmentation
-
1. Application
- 1.1. Large Enterprises
- 1.2. SMEs
-
2. Types
- 2.1. Cloud Based
- 2.2. Web Based
Continuous Configuration Automation Tools Segmentation By Geography
-
1. North America
- 1.1. United States
- 1.2. Canada
- 1.3. Mexico
-
2. South America
- 2.1. Brazil
- 2.2. Argentina
- 2.3. Rest of South America
-
3. Europe
- 3.1. United Kingdom
- 3.2. Germany
- 3.3. France
- 3.4. Italy
- 3.5. Spain
- 3.6. Russia
- 3.7. Benelux
- 3.8. Nordics
- 3.9. Rest of Europe
-
4. Middle East & Africa
- 4.1. Turkey
- 4.2. Israel
- 4.3. GCC
- 4.4. North Africa
- 4.5. South Africa
- 4.6. Rest of Middle East & Africa
-
5. Asia Pacific
- 5.1. China
- 5.2. India
- 5.3. Japan
- 5.4. South Korea
- 5.5. ASEAN
- 5.6. Oceania
- 5.7. Rest of Asia Pacific
Continuous Configuration Automation Tools REPORT HIGHLIGHTS
| Aspects | Details |
|---|---|
| Study Period | 2019-2033 |
| Base Year | 2024 |
| Estimated Year | 2025 |
| Forecast Period | 2025-2033 |
| Historical Period | 2019-2024 |
| Growth Rate | CAGR of 9% from 2019-2033 |
| Segmentation |
|
Table of Contents
- 1. Introduction
- 1.1. Research Scope
- 1.2. Market Segmentation
- 1.3. Research Methodology
- 1.4. Definitions and Assumptions
- 2. Executive Summary
- 2.1. Introduction
- 3. Market Dynamics
- 3.1. Introduction
- 3.2. Market Drivers
- 3.3. Market Restrains
- 3.4. Market Trends
- 4. Market Factor Analysis
- 4.1. Porters Five Forces
- 4.2. Supply/Value Chain
- 4.3. PESTEL analysis
- 4.4. Market Entropy
- 4.5. Patent/Trademark Analysis
- 5. Global Continuous Configuration Automation Tools Analysis, Insights and Forecast, 2019-2031
- 5.1. Market Analysis, Insights and Forecast - by Application
- 5.1.1. Large Enterprises
- 5.1.2. SMEs
- 5.2. Market Analysis, Insights and Forecast - by Types
- 5.2.1. Cloud Based
- 5.2.2. Web Based
- 5.3. Market Analysis, Insights and Forecast - by Region
- 5.3.1. North America
- 5.3.2. South America
- 5.3.3. Europe
- 5.3.4. Middle East & Africa
- 5.3.5. Asia Pacific
- 5.1. Market Analysis, Insights and Forecast - by Application
- 6. North America Continuous Configuration Automation Tools Analysis, Insights and Forecast, 2019-2031
- 6.1. Market Analysis, Insights and Forecast - by Application
- 6.1.1. Large Enterprises
- 6.1.2. SMEs
- 6.2. Market Analysis, Insights and Forecast - by Types
- 6.2.1. Cloud Based
- 6.2.2. Web Based
- 6.1. Market Analysis, Insights and Forecast - by Application
- 7. South America Continuous Configuration Automation Tools Analysis, Insights and Forecast, 2019-2031
- 7.1. Market Analysis, Insights and Forecast - by Application
- 7.1.1. Large Enterprises
- 7.1.2. SMEs
- 7.2. Market Analysis, Insights and Forecast - by Types
- 7.2.1. Cloud Based
- 7.2.2. Web Based
- 7.1. Market Analysis, Insights and Forecast - by Application
- 8. Europe Continuous Configuration Automation Tools Analysis, Insights and Forecast, 2019-2031
- 8.1. Market Analysis, Insights and Forecast - by Application
- 8.1.1. Large Enterprises
- 8.1.2. SMEs
- 8.2. Market Analysis, Insights and Forecast - by Types
- 8.2.1. Cloud Based
- 8.2.2. Web Based
- 8.1. Market Analysis, Insights and Forecast - by Application
- 9. Middle East & Africa Continuous Configuration Automation Tools Analysis, Insights and Forecast, 2019-2031
- 9.1. Market Analysis, Insights and Forecast - by Application
- 9.1.1. Large Enterprises
- 9.1.2. SMEs
- 9.2. Market Analysis, Insights and Forecast - by Types
- 9.2.1. Cloud Based
- 9.2.2. Web Based
- 9.1. Market Analysis, Insights and Forecast - by Application
- 10. Asia Pacific Continuous Configuration Automation Tools Analysis, Insights and Forecast, 2019-2031
- 10.1. Market Analysis, Insights and Forecast - by Application
- 10.1.1. Large Enterprises
- 10.1.2. SMEs
- 10.2. Market Analysis, Insights and Forecast - by Types
- 10.2.1. Cloud Based
- 10.2.2. Web Based
- 10.1. Market Analysis, Insights and Forecast - by Application
- 11. Competitive Analysis
- 11.1. Global Market Share Analysis 2024
- 11.2. Company Profiles
- 11.2.1 Chef
- 11.2.1.1. Overview
- 11.2.1.2. Products
- 11.2.1.3. SWOT Analysis
- 11.2.1.4. Recent Developments
- 11.2.1.5. Financials (Based on Availability)
- 11.2.2 Red Hat
- 11.2.2.1. Overview
- 11.2.2.2. Products
- 11.2.2.3. SWOT Analysis
- 11.2.2.4. Recent Developments
- 11.2.2.5. Financials (Based on Availability)
- 11.2.3 Puppet
- 11.2.3.1. Overview
- 11.2.3.2. Products
- 11.2.3.3. SWOT Analysis
- 11.2.3.4. Recent Developments
- 11.2.3.5. Financials (Based on Availability)
- 11.2.4 SaltStack
- 11.2.4.1. Overview
- 11.2.4.2. Products
- 11.2.4.3. SWOT Analysis
- 11.2.4.4. Recent Developments
- 11.2.4.5. Financials (Based on Availability)
- 11.2.5 OrcaConfig
- 11.2.5.1. Overview
- 11.2.5.2. Products
- 11.2.5.3. SWOT Analysis
- 11.2.5.4. Recent Developments
- 11.2.5.5. Financials (Based on Availability)
- 11.2.1 Chef
List of Figures
- Figure 1: Global Continuous Configuration Automation Tools Revenue Breakdown (million, %) by Region 2024 & 2032
- Figure 2: North America Continuous Configuration Automation Tools Revenue (million), by Application 2024 & 2032
- Figure 3: North America Continuous Configuration Automation Tools Revenue Share (%), by Application 2024 & 2032
- Figure 4: North America Continuous Configuration Automation Tools Revenue (million), by Types 2024 & 2032
- Figure 5: North America Continuous Configuration Automation Tools Revenue Share (%), by Types 2024 & 2032
- Figure 6: North America Continuous Configuration Automation Tools Revenue (million), by Country 2024 & 2032
- Figure 7: North America Continuous Configuration Automation Tools Revenue Share (%), by Country 2024 & 2032
- Figure 8: South America Continuous Configuration Automation Tools Revenue (million), by Application 2024 & 2032
- Figure 9: South America Continuous Configuration Automation Tools Revenue Share (%), by Application 2024 & 2032
- Figure 10: South America Continuous Configuration Automation Tools Revenue (million), by Types 2024 & 2032
- Figure 11: South America Continuous Configuration Automation Tools Revenue Share (%), by Types 2024 & 2032
- Figure 12: South America Continuous Configuration Automation Tools Revenue (million), by Country 2024 & 2032
- Figure 13: South America Continuous Configuration Automation Tools Revenue Share (%), by Country 2024 & 2032
- Figure 14: Europe Continuous Configuration Automation Tools Revenue (million), by Application 2024 & 2032
- Figure 15: Europe Continuous Configuration Automation Tools Revenue Share (%), by Application 2024 & 2032
- Figure 16: Europe Continuous Configuration Automation Tools Revenue (million), by Types 2024 & 2032
- Figure 17: Europe Continuous Configuration Automation Tools Revenue Share (%), by Types 2024 & 2032
- Figure 18: Europe Continuous Configuration Automation Tools Revenue (million), by Country 2024 & 2032
- Figure 19: Europe Continuous Configuration Automation Tools Revenue Share (%), by Country 2024 & 2032
- Figure 20: Middle East & Africa Continuous Configuration Automation Tools Revenue (million), by Application 2024 & 2032
- Figure 21: Middle East & Africa Continuous Configuration Automation Tools Revenue Share (%), by Application 2024 & 2032
- Figure 22: Middle East & Africa Continuous Configuration Automation Tools Revenue (million), by Types 2024 & 2032
- Figure 23: Middle East & Africa Continuous Configuration Automation Tools Revenue Share (%), by Types 2024 & 2032
- Figure 24: Middle East & Africa Continuous Configuration Automation Tools Revenue (million), by Country 2024 & 2032
- Figure 25: Middle East & Africa Continuous Configuration Automation Tools Revenue Share (%), by Country 2024 & 2032
- Figure 26: Asia Pacific Continuous Configuration Automation Tools Revenue (million), by Application 2024 & 2032
- Figure 27: Asia Pacific Continuous Configuration Automation Tools Revenue Share (%), by Application 2024 & 2032
- Figure 28: Asia Pacific Continuous Configuration Automation Tools Revenue (million), by Types 2024 & 2032
- Figure 29: Asia Pacific Continuous Configuration Automation Tools Revenue Share (%), by Types 2024 & 2032
- Figure 30: Asia Pacific Continuous Configuration Automation Tools Revenue (million), by Country 2024 & 2032
- Figure 31: Asia Pacific Continuous Configuration Automation Tools Revenue Share (%), by Country 2024 & 2032
List of Tables
- Table 1: Global Continuous Configuration Automation Tools Revenue million Forecast, by Region 2019 & 2032
- Table 2: Global Continuous Configuration Automation Tools Revenue million Forecast, by Application 2019 & 2032
- Table 3: Global Continuous Configuration Automation Tools Revenue million Forecast, by Types 2019 & 2032
- Table 4: Global Continuous Configuration Automation Tools Revenue million Forecast, by Region 2019 & 2032
- Table 5: Global Continuous Configuration Automation Tools Revenue million Forecast, by Application 2019 & 2032
- Table 6: Global Continuous Configuration Automation Tools Revenue million Forecast, by Types 2019 & 2032
- Table 7: Global Continuous Configuration Automation Tools Revenue million Forecast, by Country 2019 & 2032
- Table 8: United States Continuous Configuration Automation Tools Revenue (million) Forecast, by Application 2019 & 2032
- Table 9: Canada Continuous Configuration Automation Tools Revenue (million) Forecast, by Application 2019 & 2032
- Table 10: Mexico Continuous Configuration Automation Tools Revenue (million) Forecast, by Application 2019 & 2032
- Table 11: Global Continuous Configuration Automation Tools Revenue million Forecast, by Application 2019 & 2032
- Table 12: Global Continuous Configuration Automation Tools Revenue million Forecast, by Types 2019 & 2032
- Table 13: Global Continuous Configuration Automation Tools Revenue million Forecast, by Country 2019 & 2032
- Table 14: Brazil Continuous Configuration Automation Tools Revenue (million) Forecast, by Application 2019 & 2032
- Table 15: Argentina Continuous Configuration Automation Tools Revenue (million) Forecast, by Application 2019 & 2032
- Table 16: Rest of South America Continuous Configuration Automation Tools Revenue (million) Forecast, by Application 2019 & 2032
- Table 17: Global Continuous Configuration Automation Tools Revenue million Forecast, by Application 2019 & 2032
- Table 18: Global Continuous Configuration Automation Tools Revenue million Forecast, by Types 2019 & 2032
- Table 19: Global Continuous Configuration Automation Tools Revenue million Forecast, by Country 2019 & 2032
- Table 20: United Kingdom Continuous Configuration Automation Tools Revenue (million) Forecast, by Application 2019 & 2032
- Table 21: Germany Continuous Configuration Automation Tools Revenue (million) Forecast, by Application 2019 & 2032
- Table 22: France Continuous Configuration Automation Tools Revenue (million) Forecast, by Application 2019 & 2032
- Table 23: Italy Continuous Configuration Automation Tools Revenue (million) Forecast, by Application 2019 & 2032
- Table 24: Spain Continuous Configuration Automation Tools Revenue (million) Forecast, by Application 2019 & 2032
- Table 25: Russia Continuous Configuration Automation Tools Revenue (million) Forecast, by Application 2019 & 2032
- Table 26: Benelux Continuous Configuration Automation Tools Revenue (million) Forecast, by Application 2019 & 2032
- Table 27: Nordics Continuous Configuration Automation Tools Revenue (million) Forecast, by Application 2019 & 2032
- Table 28: Rest of Europe Continuous Configuration Automation Tools Revenue (million) Forecast, by Application 2019 & 2032
- Table 29: Global Continuous Configuration Automation Tools Revenue million Forecast, by Application 2019 & 2032
- Table 30: Global Continuous Configuration Automation Tools Revenue million Forecast, by Types 2019 & 2032
- Table 31: Global Continuous Configuration Automation Tools Revenue million Forecast, by Country 2019 & 2032
- Table 32: Turkey Continuous Configuration Automation Tools Revenue (million) Forecast, by Application 2019 & 2032
- Table 33: Israel Continuous Configuration Automation Tools Revenue (million) Forecast, by Application 2019 & 2032
- Table 34: GCC Continuous Configuration Automation Tools Revenue (million) Forecast, by Application 2019 & 2032
- Table 35: North Africa Continuous Configuration Automation Tools Revenue (million) Forecast, by Application 2019 & 2032
- Table 36: South Africa Continuous Configuration Automation Tools Revenue (million) Forecast, by Application 2019 & 2032
- Table 37: Rest of Middle East & Africa Continuous Configuration Automation Tools Revenue (million) Forecast, by Application 2019 & 2032
- Table 38: Global Continuous Configuration Automation Tools Revenue million Forecast, by Application 2019 & 2032
- Table 39: Global Continuous Configuration Automation Tools Revenue million Forecast, by Types 2019 & 2032
- Table 40: Global Continuous Configuration Automation Tools Revenue million Forecast, by Country 2019 & 2032
- Table 41: China Continuous Configuration Automation Tools Revenue (million) Forecast, by Application 2019 & 2032
- Table 42: India Continuous Configuration Automation Tools Revenue (million) Forecast, by Application 2019 & 2032
- Table 43: Japan Continuous Configuration Automation Tools Revenue (million) Forecast, by Application 2019 & 2032
- Table 44: South Korea Continuous Configuration Automation Tools Revenue (million) Forecast, by Application 2019 & 2032
- Table 45: ASEAN Continuous Configuration Automation Tools Revenue (million) Forecast, by Application 2019 & 2032
- Table 46: Oceania Continuous Configuration Automation Tools Revenue (million) Forecast, by Application 2019 & 2032
- Table 47: Rest of Asia Pacific Continuous Configuration Automation Tools Revenue (million) Forecast, by Application 2019 & 2032
Frequently Asked Questions
1. What is the projected Compound Annual Growth Rate (CAGR) of the Continuous Configuration Automation Tools?
The projected CAGR is approximately 9%.
2. Which companies are prominent players in the Continuous Configuration Automation Tools?
Key companies in the market include Chef, Red Hat, Puppet, SaltStack, OrcaConfig.
3. What are the main segments of the Continuous Configuration Automation Tools?
The market segments include Application, Types.
4. Can you provide details about the market size?
The market size is estimated to be USD 110 million as of 2022.
5. What are some drivers contributing to market growth?
N/A
6. What are the notable trends driving market growth?
N/A
7. Are there any restraints impacting market growth?
N/A
8. Can you provide examples of recent developments in the market?
N/A
9. What pricing options are available for accessing the report?
Pricing options include single-user, multi-user, and enterprise licenses priced at USD 4900.00, USD 7350.00, and USD 9800.00 respectively.
10. Is the market size provided in terms of value or volume?
The market size is provided in terms of value, measured in million.
11. Are there any specific market keywords associated with the report?
Yes, the market keyword associated with the report is "Continuous Configuration Automation Tools," which aids in identifying and referencing the specific market segment covered.
12. How do I determine which pricing option suits my needs best?
The pricing options vary based on user requirements and access needs. Individual users may opt for single-user licenses, while businesses requiring broader access may choose multi-user or enterprise licenses for cost-effective access to the report.
13. Are there any additional resources or data provided in the Continuous Configuration Automation Tools report?
While the report offers comprehensive insights, it's advisable to review the specific contents or supplementary materials provided to ascertain if additional resources or data are available.
14. How can I stay updated on further developments or reports in the Continuous Configuration Automation Tools?
To stay informed about further developments, trends, and reports in the Continuous Configuration Automation Tools, consider subscribing to industry newsletters, following relevant companies and organizations, or regularly checking reputable industry news sources and publications.
Methodology
Step 1 - Identification of Relevant Samples Size from Population Database


Step 2 - Approaches for Defining Global Market Size (Value, Volume* & Price*)

Note*: In applicable scenarios
Step 3 - Data Sources
Primary Research
- Web Analytics
- Survey Reports
- Research Institute
- Latest Research Reports
- Opinion Leaders
Secondary Research
- Annual Reports
- White Paper
- Latest Press Release
- Industry Association
- Paid Database
- Investor Presentations

Step 4 - Data Triangulation
Involves using different sources of information in order to increase the validity of a study
These sources are likely to be stakeholders in a program - participants, other researchers, program staff, other community members, and so on.
Then we put all data in single framework & apply various statistical tools to find out the dynamic on the market.
During the analysis stage, feedback from the stakeholder groups would be compared to determine areas of agreement as well as areas of divergence
