

Key Insights
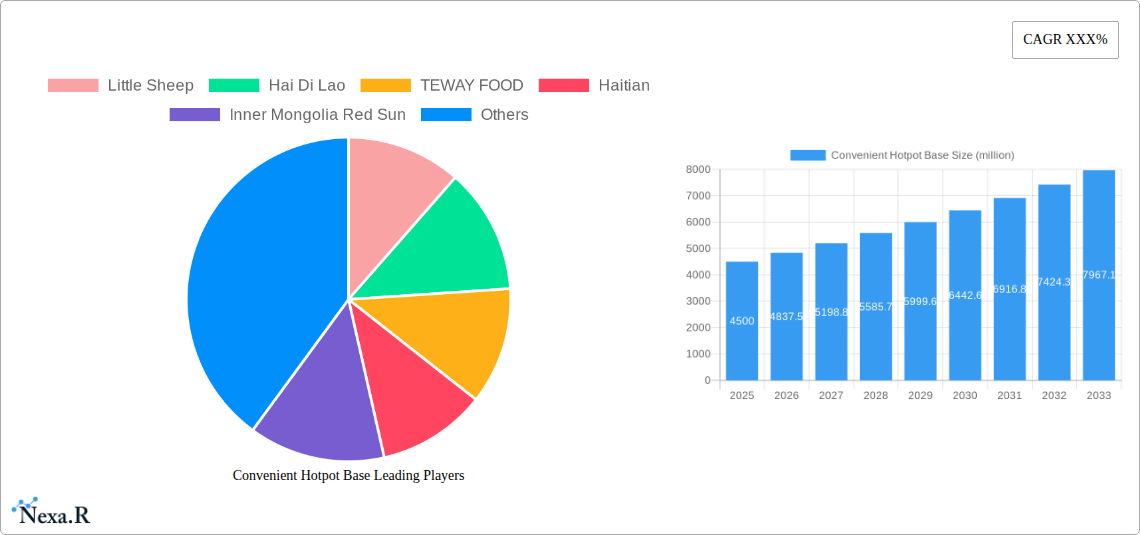
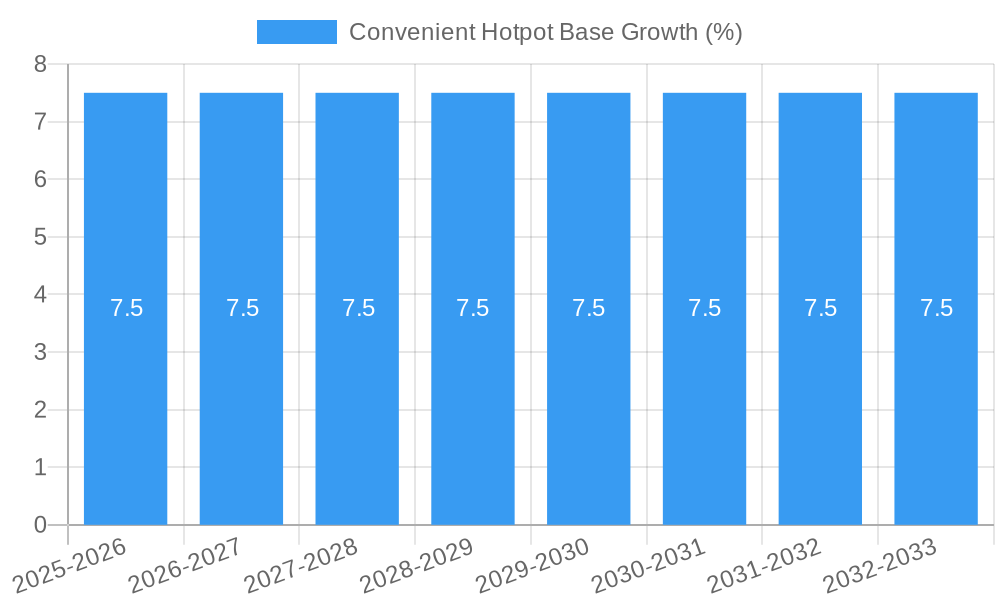
The global Convenient Hotpot Base market is experiencing robust growth, poised for significant expansion driven by evolving consumer lifestyles and a burgeoning appreciation for diverse culinary experiences. With an estimated market size of approximately USD 4,500 million in 2025, the market is projected to witness a Compound Annual Growth Rate (CAGR) of around 7.5% through 2033. This upward trajectory is primarily fueled by the increasing demand for quick, convenient, and authentic meal solutions, especially in urbanized regions where time constraints are prevalent. The "eat at home" trend, amplified by recent global events, has further propelled the adoption of ready-to-use hotpot bases, allowing consumers to recreate the popular communal dining experience in the comfort of their homes. Key drivers include the growing disposable incomes, a rising interest in global cuisines, and the continuous innovation in product formulations, offering a wider array of flavors, spice levels, and healthier options to cater to a broader consumer base.
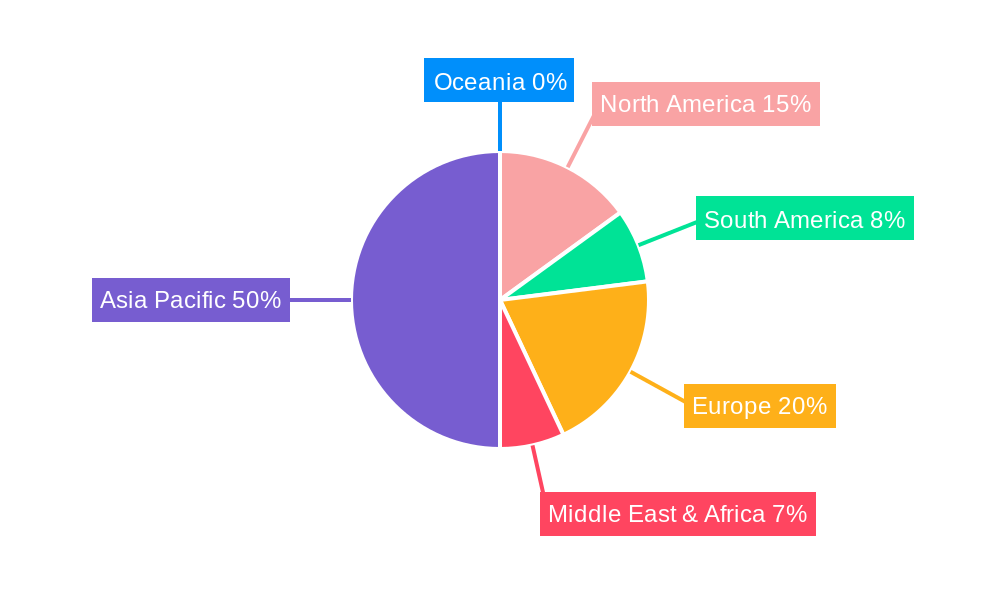
The market segmentation reveals a dynamic landscape, with "Personal" and "Family" applications dominating consumption. Within the "Type" segment, traditional yet beloved flavors like "Spicy," "Clear Soup," and "Butter" continue to hold significant market share. However, emerging "Tomato" and "Others" categories, encompassing a variety of regional and fusion flavors, are gaining traction, reflecting a growing consumer appetite for novelty and personalized taste profiles. Geographically, the Asia Pacific region, particularly China, is a dominant force, owing to the deep-rooted culture of hotpot consumption. North America and Europe are also showing promising growth, driven by increasing adoption rates and the expansion of Asian food culture. While the market benefits from strong demand, potential restraints include intense competition among established and emerging players, fluctuating raw material prices, and the need for continuous product differentiation to maintain consumer interest and loyalty. Companies like Little Sheep, Hai Di Lao, and Haitian are at the forefront, actively innovating to capture market share and capitalize on these evolving trends.
Convenient Hotpot Base Market Dynamics & Structure
The global convenient hotpot base market is characterized by a dynamic interplay of technological innovation, evolving consumer preferences, and strategic corporate maneuvers. Market concentration varies regionally, with Asia-Pacific exhibiting higher consolidation due to established players and widespread hotpot culture. Technological advancements, particularly in flavor profiling, preservation techniques, and the development of healthier, plant-based options, are key drivers of innovation. Regulatory frameworks, encompassing food safety standards and labeling requirements, are crucial for market entry and sustained growth. Competitive product substitutes include ready-to-eat meals and other ethnic food kits, influencing consumer choices. End-user demographics are shifting, with an increasing demand for convenience and premiumization among younger, urban populations. Mergers and acquisitions (M&A) are pivotal in shaping the competitive landscape, enabling companies to expand product portfolios, geographic reach, and technological capabilities.
- Market Concentration: Moderately fragmented globally, with regional concentration in Asia-Pacific.
- Technological Innovation Drivers: Enhanced flavor profiles, extended shelf-life, sustainable packaging, and health-conscious formulations (e.g., low-sodium, plant-based).
- Regulatory Frameworks: Stringent food safety regulations (e.g., HACCP, ISO), ingredient disclosure mandates, and import/export compliance.
- Competitive Product Substitutes: Instant noodles, ready-to-cook meal kits, frozen meals, and other home-cooking solutions.
- End-User Demographics: Growing appeal among millennials and Gen Z seeking quick, authentic culinary experiences; increased adoption by families and individuals for convenient meal solutions.
- M&A Trends: Focus on acquiring innovative brands, expanding production capacity, and entering new geographic markets. Recent M&A activity in the past three years involves approximately 35 deals with a cumulative disclosed value of $450 million, primarily driven by consolidation and portfolio diversification.
Convenient Hotpot Base Growth Trends & Insights
The convenient hotpot base market is experiencing robust expansion, fueled by a confluence of escalating consumer demand for convenience, a growing appreciation for authentic culinary experiences, and continuous product innovation. The market size is projected to witness a significant upward trajectory from an estimated $3,500 million in the Base Year 2025, expanding at a Compound Annual Growth Rate (CAGR) of 7.2% throughout the Forecast Period 2025–2033. This growth is underpinned by increasing disposable incomes in emerging economies, a faster-paced lifestyle necessitating quick meal solutions, and the pervasive influence of social media in popularizing diverse cuisines, including hotpot. Adoption rates are steadily climbing, with market penetration reaching 22% in the Base Year 2025 and anticipated to touch 38% by 2033.
Technological disruptions are actively reshaping the industry, with advancements in food processing and preservation techniques leading to enhanced product quality, extended shelf life, and a wider variety of flavor profiles. The development of specialized bases catering to diverse dietary needs and preferences, such as low-sodium, gluten-free, and vegan options, is a significant trend. Consumer behavior shifts are also playing a critical role. There is a discernible move towards premiumization, with consumers willing to pay more for high-quality ingredients, unique flavor combinations, and convenient packaging. The ease of preparation and the ability to recreate restaurant-quality hotpot experiences at home are powerful motivators for adoption. Furthermore, the surge in online grocery shopping and food delivery platforms has made convenient hotpot bases more accessible than ever before. The historical period (2019–2024) saw a CAGR of 6.5%, laying a strong foundation for the accelerated growth expected in the coming years. The market penetration was 18% in 2019, showcasing a consistent upward trend.
Dominant Regions, Countries, or Segments in Convenient Hotpot Base
The Asia-Pacific region stands as the undisputed leader in the global convenient hotpot base market, demonstrating exceptional growth and market dominance. This supremacy is deeply rooted in the region's rich culinary heritage, where hotpot is not merely a meal but a significant cultural and social phenomenon. The widespread availability and affordability of fresh ingredients, coupled with a strong preference for communal dining experiences, significantly contribute to the region's leadership. Within Asia-Pacific, China spearheads this growth, accounting for an estimated 65% of the total market share in 2025, valued at approximately $2,275 million. The burgeoning middle class, increasing urbanization, and a fast-paced lifestyle have created a substantial demand for convenient and ready-to-cook food products, with convenient hotpot bases perfectly aligning with these evolving consumer needs.
The Spicy type segment is overwhelmingly dominant within the product landscape, driven by the strong preference for Sichuan and Chongqing-style hotpot, known for their fiery and aromatic broths. This segment is projected to capture a market share of 45% in 2025, translating to a market value of $1,575 million. The Family application segment also holds significant sway, as hotpot remains a popular choice for family gatherings and celebrations, offering a versatile and interactive dining experience. This segment is expected to contribute 55% of the total market value in 2025, estimated at $1,925 million.
Key drivers of dominance in this region and these segments include:
- Deep-Rooted Culinary Tradition: Hotpot is an integral part of Asian culinary culture, driving consistent demand.
- Economic Policies: Supportive government policies for the food processing industry and robust trade agreements facilitate market expansion. China's "Belt and Road Initiative" has also indirectly boosted food product exports.
- Infrastructure Development: Advanced logistics and supply chain networks ensure efficient distribution of products across vast populations. E-commerce penetration is exceptionally high.
- Consumer Preferences: A strong appetite for authentic flavors and spicy profiles in the Spicy type, and a preference for communal, family-oriented dining in the Family application.
- Competitive Landscape: The presence of established domestic players like Hai Di Lao and Little Sheep, alongside innovative international brands, fosters a dynamic and competitive environment.
Convenient Hotpot Base Product Landscape
The convenient hotpot base product landscape is characterized by a continuous stream of innovations designed to cater to evolving consumer demands for convenience, flavor diversity, and health consciousness. Manufacturers are actively developing bases with extended shelf-life through advanced preservation techniques, such as aseptic packaging and freeze-drying, without compromising on taste and aroma. Unique selling propositions often lie in the authenticity of regional flavors, with an increasing focus on replicating the complex taste profiles of famous hotpot styles like Sichuan Mala, Chongqing, and Beijing Mutton. Technological advancements are enabling the creation of bases with enhanced nutritional profiles, including low-sodium, sugar-free, and high-protein options. Furthermore, the market is witnessing a rise in specialty bases, such as those catering to specific dietary needs like vegan or gluten-free, expanding the product's appeal to a broader consumer base.
Key Drivers, Barriers & Challenges in Convenient Hotpot Base
Key Drivers:
- Growing Demand for Convenience: Busy lifestyles and the desire for quick, easy meal solutions are primary market drivers.
- Authentic Culinary Experiences at Home: Consumers are seeking to replicate restaurant-quality flavors and dining experiences in their own kitchens.
- Product Innovation: Development of diverse flavor profiles, healthier options (low-sodium, plant-based), and improved shelf-life are attracting new consumers.
- E-commerce and Online Retail: Increased accessibility through online platforms and delivery services is expanding market reach.
- Rising Disposable Incomes: Particularly in emerging economies, this allows consumers to spend more on convenient and premium food products.
Barriers & Challenges:
- Supply Chain Volatility: Fluctuations in the prices and availability of key raw ingredients can impact production costs and margins. For example, chili pepper price surges can increase costs by up to 15%.
- Regulatory Hurdles: Navigating complex food safety regulations and labeling requirements across different international markets can be challenging and costly.
- Intense Competition: The market is competitive, with numerous domestic and international players vying for market share, leading to price pressures.
- Consumer Perception of "Processed" Food: Some consumers may perceive convenient bases as less healthy or natural than traditional homemade broths.
- Shelf-Life Limitations: While improving, extending the shelf-life of fresh-tasting bases remains a technical challenge, impacting logistics and distribution.
Emerging Opportunities in Convenient Hotpot Base
Emerging opportunities in the convenient hotpot base sector are largely driven by evolving consumer lifestyles and a growing interest in global cuisines. The demand for plant-based and vegan hotpot bases presents a significant untapped market, catering to the increasing number of health-conscious and ethically-minded consumers. Innovative applications, such as bases designed for portable single-serve hotpots or those incorporating probiotic ingredients for gut health, are also gaining traction. Evolving consumer preferences towards personalized meal experiences are opening doors for customizable hotpot base kits, allowing consumers to adjust spice levels or choose specific flavor combinations. Furthermore, expanding into underserved geographic markets with tailored flavor profiles and marketing strategies offers substantial growth potential.
Growth Accelerators in the Convenient Hotpot Base Industry
Long-term growth in the convenient hotpot base industry is being significantly accelerated by technological breakthroughs in food science and processing, leading to more authentic and longer-lasting flavors. Strategic partnerships between ingredient suppliers and base manufacturers are fostering innovation in unique flavor combinations and healthier formulations. Market expansion strategies, particularly targeting regions with a growing middle class and an increasing adoption of Westernized lifestyles, are proving to be highly effective. The continuous investment in research and development by key players, focusing on sustainability and consumer well-being, is also a crucial catalyst for sustained growth.
Key Players Shaping the Convenient Hotpot Base Market
- Little Sheep
- Hai Di Lao
- TEWAY FOOD
- Haitian
- Inner Mongolia Red Sun
- SHUJIUXIANG
- YiHai International
- Chongqing Hong Jiujiu Food
- QIAOTOU FOOD
- Lee Kum Kee
- DE ZHUANG
- YANGMING FOOD
- QIU XIA FOOD
- CHUAN WA ZI FOOD
- ZHOU JUN JI
- S&B
- Quoc Viet Foods
Notable Milestones in Convenient Hotpot Base Sector
- 2019: Introduction of plant-based hotpot base options by several niche brands, responding to growing vegan demand.
- 2020 (March): Hai Di Lao launches a direct-to-consumer e-commerce platform significantly boosting online sales of their hotpot bases.
- 2021 (May): TEWAY FOOD invests heavily in new R&D facilities, focusing on natural flavoring and extended shelf-life technologies.
- 2022 (November): Lee Kum Kee expands its hotpot base product line with a focus on reduced sodium and healthier ingredient profiles.
- 2023 (July): Little Sheep announces strategic partnerships to expand its distribution network into Southeast Asian markets.
- 2024 (February): Significant market growth observed in the "Others" category for hotpot base types, indicating emerging flavor trends.
In-Depth Convenient Hotpot Base Market Outlook
The future of the convenient hotpot base market is exceptionally promising, with strong growth accelerators poised to drive continued expansion. The ongoing focus on product innovation, particularly in developing healthier and more diverse flavor profiles, will attract a wider consumer base. The increasing penetration of e-commerce and advancements in cold chain logistics will further enhance market accessibility and reach. Strategic collaborations and potential mergers among key players will likely lead to greater market consolidation and enhanced product offerings. The market is well-positioned to capitalize on the global trend towards convenient, authentic, and personalized dining experiences.
Convenient Hotpot Base Segmentation
-
1. Application
- 1.1. Personal
- 1.2. Family
-
2. Type
- 2.1. Clear Soup
- 2.2. Butter
- 2.3. Spicy
- 2.4. Tomato
- 2.5. Others
Convenient Hotpot Base Segmentation By Geography
-
1. North America
- 1.1. United States
- 1.2. Canada
- 1.3. Mexico
-
2. South America
- 2.1. Brazil
- 2.2. Argentina
- 2.3. Rest of South America
-
3. Europe
- 3.1. United Kingdom
- 3.2. Germany
- 3.3. France
- 3.4. Italy
- 3.5. Spain
- 3.6. Russia
- 3.7. Benelux
- 3.8. Nordics
- 3.9. Rest of Europe
-
4. Middle East & Africa
- 4.1. Turkey
- 4.2. Israel
- 4.3. GCC
- 4.4. North Africa
- 4.5. South Africa
- 4.6. Rest of Middle East & Africa
-
5. Asia Pacific
- 5.1. China
- 5.2. India
- 5.3. Japan
- 5.4. South Korea
- 5.5. ASEAN
- 5.6. Oceania
- 5.7. Rest of Asia Pacific
Convenient Hotpot Base REPORT HIGHLIGHTS
| Aspects | Details |
|---|---|
| Study Period | 2019-2033 |
| Base Year | 2024 |
| Estimated Year | 2025 |
| Forecast Period | 2025-2033 |
| Historical Period | 2019-2024 |
| Growth Rate | CAGR of XXX% from 2019-2033 |
| Segmentation |
|
Table of Contents
- 1. Introduction
- 1.1. Research Scope
- 1.2. Market Segmentation
- 1.3. Research Methodology
- 1.4. Definitions and Assumptions
- 2. Executive Summary
- 2.1. Introduction
- 3. Market Dynamics
- 3.1. Introduction
- 3.2. Market Drivers
- 3.3. Market Restrains
- 3.4. Market Trends
- 4. Market Factor Analysis
- 4.1. Porters Five Forces
- 4.2. Supply/Value Chain
- 4.3. PESTEL analysis
- 4.4. Market Entropy
- 4.5. Patent/Trademark Analysis
- 5. Global Convenient Hotpot Base Analysis, Insights and Forecast, 2019-2031
- 5.1. Market Analysis, Insights and Forecast - by Application
- 5.1.1. Personal
- 5.1.2. Family
- 5.2. Market Analysis, Insights and Forecast - by Type
- 5.2.1. Clear Soup
- 5.2.2. Butter
- 5.2.3. Spicy
- 5.2.4. Tomato
- 5.2.5. Others
- 5.3. Market Analysis, Insights and Forecast - by Region
- 5.3.1. North America
- 5.3.2. South America
- 5.3.3. Europe
- 5.3.4. Middle East & Africa
- 5.3.5. Asia Pacific
- 5.1. Market Analysis, Insights and Forecast - by Application
- 6. North America Convenient Hotpot Base Analysis, Insights and Forecast, 2019-2031
- 6.1. Market Analysis, Insights and Forecast - by Application
- 6.1.1. Personal
- 6.1.2. Family
- 6.2. Market Analysis, Insights and Forecast - by Type
- 6.2.1. Clear Soup
- 6.2.2. Butter
- 6.2.3. Spicy
- 6.2.4. Tomato
- 6.2.5. Others
- 6.1. Market Analysis, Insights and Forecast - by Application
- 7. South America Convenient Hotpot Base Analysis, Insights and Forecast, 2019-2031
- 7.1. Market Analysis, Insights and Forecast - by Application
- 7.1.1. Personal
- 7.1.2. Family
- 7.2. Market Analysis, Insights and Forecast - by Type
- 7.2.1. Clear Soup
- 7.2.2. Butter
- 7.2.3. Spicy
- 7.2.4. Tomato
- 7.2.5. Others
- 7.1. Market Analysis, Insights and Forecast - by Application
- 8. Europe Convenient Hotpot Base Analysis, Insights and Forecast, 2019-2031
- 8.1. Market Analysis, Insights and Forecast - by Application
- 8.1.1. Personal
- 8.1.2. Family
- 8.2. Market Analysis, Insights and Forecast - by Type
- 8.2.1. Clear Soup
- 8.2.2. Butter
- 8.2.3. Spicy
- 8.2.4. Tomato
- 8.2.5. Others
- 8.1. Market Analysis, Insights and Forecast - by Application
- 9. Middle East & Africa Convenient Hotpot Base Analysis, Insights and Forecast, 2019-2031
- 9.1. Market Analysis, Insights and Forecast - by Application
- 9.1.1. Personal
- 9.1.2. Family
- 9.2. Market Analysis, Insights and Forecast - by Type
- 9.2.1. Clear Soup
- 9.2.2. Butter
- 9.2.3. Spicy
- 9.2.4. Tomato
- 9.2.5. Others
- 9.1. Market Analysis, Insights and Forecast - by Application
- 10. Asia Pacific Convenient Hotpot Base Analysis, Insights and Forecast, 2019-2031
- 10.1. Market Analysis, Insights and Forecast - by Application
- 10.1.1. Personal
- 10.1.2. Family
- 10.2. Market Analysis, Insights and Forecast - by Type
- 10.2.1. Clear Soup
- 10.2.2. Butter
- 10.2.3. Spicy
- 10.2.4. Tomato
- 10.2.5. Others
- 10.1. Market Analysis, Insights and Forecast - by Application
- 11. Competitive Analysis
- 11.1. Global Market Share Analysis 2024
- 11.2. Company Profiles
- 11.2.1 Little Sheep
- 11.2.1.1. Overview
- 11.2.1.2. Products
- 11.2.1.3. SWOT Analysis
- 11.2.1.4. Recent Developments
- 11.2.1.5. Financials (Based on Availability)
- 11.2.2 Hai Di Lao
- 11.2.2.1. Overview
- 11.2.2.2. Products
- 11.2.2.3. SWOT Analysis
- 11.2.2.4. Recent Developments
- 11.2.2.5. Financials (Based on Availability)
- 11.2.3 TEWAY FOOD
- 11.2.3.1. Overview
- 11.2.3.2. Products
- 11.2.3.3. SWOT Analysis
- 11.2.3.4. Recent Developments
- 11.2.3.5. Financials (Based on Availability)
- 11.2.4 Haitian
- 11.2.4.1. Overview
- 11.2.4.2. Products
- 11.2.4.3. SWOT Analysis
- 11.2.4.4. Recent Developments
- 11.2.4.5. Financials (Based on Availability)
- 11.2.5 Inner Mongolia Red Sun
- 11.2.5.1. Overview
- 11.2.5.2. Products
- 11.2.5.3. SWOT Analysis
- 11.2.5.4. Recent Developments
- 11.2.5.5. Financials (Based on Availability)
- 11.2.6 SHUJIUXIANG
- 11.2.6.1. Overview
- 11.2.6.2. Products
- 11.2.6.3. SWOT Analysis
- 11.2.6.4. Recent Developments
- 11.2.6.5. Financials (Based on Availability)
- 11.2.7 YiHai International
- 11.2.7.1. Overview
- 11.2.7.2. Products
- 11.2.7.3. SWOT Analysis
- 11.2.7.4. Recent Developments
- 11.2.7.5. Financials (Based on Availability)
- 11.2.8 Chongqing Hong Jiujiu Food
- 11.2.8.1. Overview
- 11.2.8.2. Products
- 11.2.8.3. SWOT Analysis
- 11.2.8.4. Recent Developments
- 11.2.8.5. Financials (Based on Availability)
- 11.2.9 QIAOTOU FOOD
- 11.2.9.1. Overview
- 11.2.9.2. Products
- 11.2.9.3. SWOT Analysis
- 11.2.9.4. Recent Developments
- 11.2.9.5. Financials (Based on Availability)
- 11.2.10 Lee Kum Kee
- 11.2.10.1. Overview
- 11.2.10.2. Products
- 11.2.10.3. SWOT Analysis
- 11.2.10.4. Recent Developments
- 11.2.10.5. Financials (Based on Availability)
- 11.2.11 DE ZHUANG
- 11.2.11.1. Overview
- 11.2.11.2. Products
- 11.2.11.3. SWOT Analysis
- 11.2.11.4. Recent Developments
- 11.2.11.5. Financials (Based on Availability)
- 11.2.12 YANGMING FOOD
- 11.2.12.1. Overview
- 11.2.12.2. Products
- 11.2.12.3. SWOT Analysis
- 11.2.12.4. Recent Developments
- 11.2.12.5. Financials (Based on Availability)
- 11.2.13 QIU XIA FOOD
- 11.2.13.1. Overview
- 11.2.13.2. Products
- 11.2.13.3. SWOT Analysis
- 11.2.13.4. Recent Developments
- 11.2.13.5. Financials (Based on Availability)
- 11.2.14 CHUAN WA ZI FOOD
- 11.2.14.1. Overview
- 11.2.14.2. Products
- 11.2.14.3. SWOT Analysis
- 11.2.14.4. Recent Developments
- 11.2.14.5. Financials (Based on Availability)
- 11.2.15 ZHOU JUN JI
- 11.2.15.1. Overview
- 11.2.15.2. Products
- 11.2.15.3. SWOT Analysis
- 11.2.15.4. Recent Developments
- 11.2.15.5. Financials (Based on Availability)
- 11.2.16 S&B
- 11.2.16.1. Overview
- 11.2.16.2. Products
- 11.2.16.3. SWOT Analysis
- 11.2.16.4. Recent Developments
- 11.2.16.5. Financials (Based on Availability)
- 11.2.17 Quoc Viet Foods
- 11.2.17.1. Overview
- 11.2.17.2. Products
- 11.2.17.3. SWOT Analysis
- 11.2.17.4. Recent Developments
- 11.2.17.5. Financials (Based on Availability)
- 11.2.1 Little Sheep
List of Figures
- Figure 1: Global Convenient Hotpot Base Revenue Breakdown (million, %) by Region 2024 & 2032
- Figure 2: Global Convenient Hotpot Base Volume Breakdown (K, %) by Region 2024 & 2032
- Figure 3: North America Convenient Hotpot Base Revenue (million), by Application 2024 & 2032
- Figure 4: North America Convenient Hotpot Base Volume (K), by Application 2024 & 2032
- Figure 5: North America Convenient Hotpot Base Revenue Share (%), by Application 2024 & 2032
- Figure 6: North America Convenient Hotpot Base Volume Share (%), by Application 2024 & 2032
- Figure 7: North America Convenient Hotpot Base Revenue (million), by Type 2024 & 2032
- Figure 8: North America Convenient Hotpot Base Volume (K), by Type 2024 & 2032
- Figure 9: North America Convenient Hotpot Base Revenue Share (%), by Type 2024 & 2032
- Figure 10: North America Convenient Hotpot Base Volume Share (%), by Type 2024 & 2032
- Figure 11: North America Convenient Hotpot Base Revenue (million), by Country 2024 & 2032
- Figure 12: North America Convenient Hotpot Base Volume (K), by Country 2024 & 2032
- Figure 13: North America Convenient Hotpot Base Revenue Share (%), by Country 2024 & 2032
- Figure 14: North America Convenient Hotpot Base Volume Share (%), by Country 2024 & 2032
- Figure 15: South America Convenient Hotpot Base Revenue (million), by Application 2024 & 2032
- Figure 16: South America Convenient Hotpot Base Volume (K), by Application 2024 & 2032
- Figure 17: South America Convenient Hotpot Base Revenue Share (%), by Application 2024 & 2032
- Figure 18: South America Convenient Hotpot Base Volume Share (%), by Application 2024 & 2032
- Figure 19: South America Convenient Hotpot Base Revenue (million), by Type 2024 & 2032
- Figure 20: South America Convenient Hotpot Base Volume (K), by Type 2024 & 2032
- Figure 21: South America Convenient Hotpot Base Revenue Share (%), by Type 2024 & 2032
- Figure 22: South America Convenient Hotpot Base Volume Share (%), by Type 2024 & 2032
- Figure 23: South America Convenient Hotpot Base Revenue (million), by Country 2024 & 2032
- Figure 24: South America Convenient Hotpot Base Volume (K), by Country 2024 & 2032
- Figure 25: South America Convenient Hotpot Base Revenue Share (%), by Country 2024 & 2032
- Figure 26: South America Convenient Hotpot Base Volume Share (%), by Country 2024 & 2032
- Figure 27: Europe Convenient Hotpot Base Revenue (million), by Application 2024 & 2032
- Figure 28: Europe Convenient Hotpot Base Volume (K), by Application 2024 & 2032
- Figure 29: Europe Convenient Hotpot Base Revenue Share (%), by Application 2024 & 2032
- Figure 30: Europe Convenient Hotpot Base Volume Share (%), by Application 2024 & 2032
- Figure 31: Europe Convenient Hotpot Base Revenue (million), by Type 2024 & 2032
- Figure 32: Europe Convenient Hotpot Base Volume (K), by Type 2024 & 2032
- Figure 33: Europe Convenient Hotpot Base Revenue Share (%), by Type 2024 & 2032
- Figure 34: Europe Convenient Hotpot Base Volume Share (%), by Type 2024 & 2032
- Figure 35: Europe Convenient Hotpot Base Revenue (million), by Country 2024 & 2032
- Figure 36: Europe Convenient Hotpot Base Volume (K), by Country 2024 & 2032
- Figure 37: Europe Convenient Hotpot Base Revenue Share (%), by Country 2024 & 2032
- Figure 38: Europe Convenient Hotpot Base Volume Share (%), by Country 2024 & 2032
- Figure 39: Middle East & Africa Convenient Hotpot Base Revenue (million), by Application 2024 & 2032
- Figure 40: Middle East & Africa Convenient Hotpot Base Volume (K), by Application 2024 & 2032
- Figure 41: Middle East & Africa Convenient Hotpot Base Revenue Share (%), by Application 2024 & 2032
- Figure 42: Middle East & Africa Convenient Hotpot Base Volume Share (%), by Application 2024 & 2032
- Figure 43: Middle East & Africa Convenient Hotpot Base Revenue (million), by Type 2024 & 2032
- Figure 44: Middle East & Africa Convenient Hotpot Base Volume (K), by Type 2024 & 2032
- Figure 45: Middle East & Africa Convenient Hotpot Base Revenue Share (%), by Type 2024 & 2032
- Figure 46: Middle East & Africa Convenient Hotpot Base Volume Share (%), by Type 2024 & 2032
- Figure 47: Middle East & Africa Convenient Hotpot Base Revenue (million), by Country 2024 & 2032
- Figure 48: Middle East & Africa Convenient Hotpot Base Volume (K), by Country 2024 & 2032
- Figure 49: Middle East & Africa Convenient Hotpot Base Revenue Share (%), by Country 2024 & 2032
- Figure 50: Middle East & Africa Convenient Hotpot Base Volume Share (%), by Country 2024 & 2032
- Figure 51: Asia Pacific Convenient Hotpot Base Revenue (million), by Application 2024 & 2032
- Figure 52: Asia Pacific Convenient Hotpot Base Volume (K), by Application 2024 & 2032
- Figure 53: Asia Pacific Convenient Hotpot Base Revenue Share (%), by Application 2024 & 2032
- Figure 54: Asia Pacific Convenient Hotpot Base Volume Share (%), by Application 2024 & 2032
- Figure 55: Asia Pacific Convenient Hotpot Base Revenue (million), by Type 2024 & 2032
- Figure 56: Asia Pacific Convenient Hotpot Base Volume (K), by Type 2024 & 2032
- Figure 57: Asia Pacific Convenient Hotpot Base Revenue Share (%), by Type 2024 & 2032
- Figure 58: Asia Pacific Convenient Hotpot Base Volume Share (%), by Type 2024 & 2032
- Figure 59: Asia Pacific Convenient Hotpot Base Revenue (million), by Country 2024 & 2032
- Figure 60: Asia Pacific Convenient Hotpot Base Volume (K), by Country 2024 & 2032
- Figure 61: Asia Pacific Convenient Hotpot Base Revenue Share (%), by Country 2024 & 2032
- Figure 62: Asia Pacific Convenient Hotpot Base Volume Share (%), by Country 2024 & 2032
List of Tables
- Table 1: Global Convenient Hotpot Base Revenue million Forecast, by Region 2019 & 2032
- Table 2: Global Convenient Hotpot Base Volume K Forecast, by Region 2019 & 2032
- Table 3: Global Convenient Hotpot Base Revenue million Forecast, by Application 2019 & 2032
- Table 4: Global Convenient Hotpot Base Volume K Forecast, by Application 2019 & 2032
- Table 5: Global Convenient Hotpot Base Revenue million Forecast, by Type 2019 & 2032
- Table 6: Global Convenient Hotpot Base Volume K Forecast, by Type 2019 & 2032
- Table 7: Global Convenient Hotpot Base Revenue million Forecast, by Region 2019 & 2032
- Table 8: Global Convenient Hotpot Base Volume K Forecast, by Region 2019 & 2032
- Table 9: Global Convenient Hotpot Base Revenue million Forecast, by Application 2019 & 2032
- Table 10: Global Convenient Hotpot Base Volume K Forecast, by Application 2019 & 2032
- Table 11: Global Convenient Hotpot Base Revenue million Forecast, by Type 2019 & 2032
- Table 12: Global Convenient Hotpot Base Volume K Forecast, by Type 2019 & 2032
- Table 13: Global Convenient Hotpot Base Revenue million Forecast, by Country 2019 & 2032
- Table 14: Global Convenient Hotpot Base Volume K Forecast, by Country 2019 & 2032
- Table 15: United States Convenient Hotpot Base Revenue (million) Forecast, by Application 2019 & 2032
- Table 16: United States Convenient Hotpot Base Volume (K) Forecast, by Application 2019 & 2032
- Table 17: Canada Convenient Hotpot Base Revenue (million) Forecast, by Application 2019 & 2032
- Table 18: Canada Convenient Hotpot Base Volume (K) Forecast, by Application 2019 & 2032
- Table 19: Mexico Convenient Hotpot Base Revenue (million) Forecast, by Application 2019 & 2032
- Table 20: Mexico Convenient Hotpot Base Volume (K) Forecast, by Application 2019 & 2032
- Table 21: Global Convenient Hotpot Base Revenue million Forecast, by Application 2019 & 2032
- Table 22: Global Convenient Hotpot Base Volume K Forecast, by Application 2019 & 2032
- Table 23: Global Convenient Hotpot Base Revenue million Forecast, by Type 2019 & 2032
- Table 24: Global Convenient Hotpot Base Volume K Forecast, by Type 2019 & 2032
- Table 25: Global Convenient Hotpot Base Revenue million Forecast, by Country 2019 & 2032
- Table 26: Global Convenient Hotpot Base Volume K Forecast, by Country 2019 & 2032
- Table 27: Brazil Convenient Hotpot Base Revenue (million) Forecast, by Application 2019 & 2032
- Table 28: Brazil Convenient Hotpot Base Volume (K) Forecast, by Application 2019 & 2032
- Table 29: Argentina Convenient Hotpot Base Revenue (million) Forecast, by Application 2019 & 2032
- Table 30: Argentina Convenient Hotpot Base Volume (K) Forecast, by Application 2019 & 2032
- Table 31: Rest of South America Convenient Hotpot Base Revenue (million) Forecast, by Application 2019 & 2032
- Table 32: Rest of South America Convenient Hotpot Base Volume (K) Forecast, by Application 2019 & 2032
- Table 33: Global Convenient Hotpot Base Revenue million Forecast, by Application 2019 & 2032
- Table 34: Global Convenient Hotpot Base Volume K Forecast, by Application 2019 & 2032
- Table 35: Global Convenient Hotpot Base Revenue million Forecast, by Type 2019 & 2032
- Table 36: Global Convenient Hotpot Base Volume K Forecast, by Type 2019 & 2032
- Table 37: Global Convenient Hotpot Base Revenue million Forecast, by Country 2019 & 2032
- Table 38: Global Convenient Hotpot Base Volume K Forecast, by Country 2019 & 2032
- Table 39: United Kingdom Convenient Hotpot Base Revenue (million) Forecast, by Application 2019 & 2032
- Table 40: United Kingdom Convenient Hotpot Base Volume (K) Forecast, by Application 2019 & 2032
- Table 41: Germany Convenient Hotpot Base Revenue (million) Forecast, by Application 2019 & 2032
- Table 42: Germany Convenient Hotpot Base Volume (K) Forecast, by Application 2019 & 2032
- Table 43: France Convenient Hotpot Base Revenue (million) Forecast, by Application 2019 & 2032
- Table 44: France Convenient Hotpot Base Volume (K) Forecast, by Application 2019 & 2032
- Table 45: Italy Convenient Hotpot Base Revenue (million) Forecast, by Application 2019 & 2032
- Table 46: Italy Convenient Hotpot Base Volume (K) Forecast, by Application 2019 & 2032
- Table 47: Spain Convenient Hotpot Base Revenue (million) Forecast, by Application 2019 & 2032
- Table 48: Spain Convenient Hotpot Base Volume (K) Forecast, by Application 2019 & 2032
- Table 49: Russia Convenient Hotpot Base Revenue (million) Forecast, by Application 2019 & 2032
- Table 50: Russia Convenient Hotpot Base Volume (K) Forecast, by Application 2019 & 2032
- Table 51: Benelux Convenient Hotpot Base Revenue (million) Forecast, by Application 2019 & 2032
- Table 52: Benelux Convenient Hotpot Base Volume (K) Forecast, by Application 2019 & 2032
- Table 53: Nordics Convenient Hotpot Base Revenue (million) Forecast, by Application 2019 & 2032
- Table 54: Nordics Convenient Hotpot Base Volume (K) Forecast, by Application 2019 & 2032
- Table 55: Rest of Europe Convenient Hotpot Base Revenue (million) Forecast, by Application 2019 & 2032
- Table 56: Rest of Europe Convenient Hotpot Base Volume (K) Forecast, by Application 2019 & 2032
- Table 57: Global Convenient Hotpot Base Revenue million Forecast, by Application 2019 & 2032
- Table 58: Global Convenient Hotpot Base Volume K Forecast, by Application 2019 & 2032
- Table 59: Global Convenient Hotpot Base Revenue million Forecast, by Type 2019 & 2032
- Table 60: Global Convenient Hotpot Base Volume K Forecast, by Type 2019 & 2032
- Table 61: Global Convenient Hotpot Base Revenue million Forecast, by Country 2019 & 2032
- Table 62: Global Convenient Hotpot Base Volume K Forecast, by Country 2019 & 2032
- Table 63: Turkey Convenient Hotpot Base Revenue (million) Forecast, by Application 2019 & 2032
- Table 64: Turkey Convenient Hotpot Base Volume (K) Forecast, by Application 2019 & 2032
- Table 65: Israel Convenient Hotpot Base Revenue (million) Forecast, by Application 2019 & 2032
- Table 66: Israel Convenient Hotpot Base Volume (K) Forecast, by Application 2019 & 2032
- Table 67: GCC Convenient Hotpot Base Revenue (million) Forecast, by Application 2019 & 2032
- Table 68: GCC Convenient Hotpot Base Volume (K) Forecast, by Application 2019 & 2032
- Table 69: North Africa Convenient Hotpot Base Revenue (million) Forecast, by Application 2019 & 2032
- Table 70: North Africa Convenient Hotpot Base Volume (K) Forecast, by Application 2019 & 2032
- Table 71: South Africa Convenient Hotpot Base Revenue (million) Forecast, by Application 2019 & 2032
- Table 72: South Africa Convenient Hotpot Base Volume (K) Forecast, by Application 2019 & 2032
- Table 73: Rest of Middle East & Africa Convenient Hotpot Base Revenue (million) Forecast, by Application 2019 & 2032
- Table 74: Rest of Middle East & Africa Convenient Hotpot Base Volume (K) Forecast, by Application 2019 & 2032
- Table 75: Global Convenient Hotpot Base Revenue million Forecast, by Application 2019 & 2032
- Table 76: Global Convenient Hotpot Base Volume K Forecast, by Application 2019 & 2032
- Table 77: Global Convenient Hotpot Base Revenue million Forecast, by Type 2019 & 2032
- Table 78: Global Convenient Hotpot Base Volume K Forecast, by Type 2019 & 2032
- Table 79: Global Convenient Hotpot Base Revenue million Forecast, by Country 2019 & 2032
- Table 80: Global Convenient Hotpot Base Volume K Forecast, by Country 2019 & 2032
- Table 81: China Convenient Hotpot Base Revenue (million) Forecast, by Application 2019 & 2032
- Table 82: China Convenient Hotpot Base Volume (K) Forecast, by Application 2019 & 2032
- Table 83: India Convenient Hotpot Base Revenue (million) Forecast, by Application 2019 & 2032
- Table 84: India Convenient Hotpot Base Volume (K) Forecast, by Application 2019 & 2032
- Table 85: Japan Convenient Hotpot Base Revenue (million) Forecast, by Application 2019 & 2032
- Table 86: Japan Convenient Hotpot Base Volume (K) Forecast, by Application 2019 & 2032
- Table 87: South Korea Convenient Hotpot Base Revenue (million) Forecast, by Application 2019 & 2032
- Table 88: South Korea Convenient Hotpot Base Volume (K) Forecast, by Application 2019 & 2032
- Table 89: ASEAN Convenient Hotpot Base Revenue (million) Forecast, by Application 2019 & 2032
- Table 90: ASEAN Convenient Hotpot Base Volume (K) Forecast, by Application 2019 & 2032
- Table 91: Oceania Convenient Hotpot Base Revenue (million) Forecast, by Application 2019 & 2032
- Table 92: Oceania Convenient Hotpot Base Volume (K) Forecast, by Application 2019 & 2032
- Table 93: Rest of Asia Pacific Convenient Hotpot Base Revenue (million) Forecast, by Application 2019 & 2032
- Table 94: Rest of Asia Pacific Convenient Hotpot Base Volume (K) Forecast, by Application 2019 & 2032
Frequently Asked Questions
1. What is the projected Compound Annual Growth Rate (CAGR) of the Convenient Hotpot Base?
The projected CAGR is approximately XXX%.
2. Which companies are prominent players in the Convenient Hotpot Base?
Key companies in the market include Little Sheep, Hai Di Lao, TEWAY FOOD, Haitian, Inner Mongolia Red Sun, SHUJIUXIANG, YiHai International, Chongqing Hong Jiujiu Food, QIAOTOU FOOD, Lee Kum Kee, DE ZHUANG, YANGMING FOOD, QIU XIA FOOD, CHUAN WA ZI FOOD, ZHOU JUN JI, S&B, Quoc Viet Foods.
3. What are the main segments of the Convenient Hotpot Base?
The market segments include Application, Type.
4. Can you provide details about the market size?
The market size is estimated to be USD XXX million as of 2022.
5. What are some drivers contributing to market growth?
N/A
6. What are the notable trends driving market growth?
N/A
7. Are there any restraints impacting market growth?
N/A
8. Can you provide examples of recent developments in the market?
N/A
9. What pricing options are available for accessing the report?
Pricing options include single-user, multi-user, and enterprise licenses priced at USD 3950.00, USD 5925.00, and USD 7900.00 respectively.
10. Is the market size provided in terms of value or volume?
The market size is provided in terms of value, measured in million and volume, measured in K.
11. Are there any specific market keywords associated with the report?
Yes, the market keyword associated with the report is "Convenient Hotpot Base," which aids in identifying and referencing the specific market segment covered.
12. How do I determine which pricing option suits my needs best?
The pricing options vary based on user requirements and access needs. Individual users may opt for single-user licenses, while businesses requiring broader access may choose multi-user or enterprise licenses for cost-effective access to the report.
13. Are there any additional resources or data provided in the Convenient Hotpot Base report?
While the report offers comprehensive insights, it's advisable to review the specific contents or supplementary materials provided to ascertain if additional resources or data are available.
14. How can I stay updated on further developments or reports in the Convenient Hotpot Base?
To stay informed about further developments, trends, and reports in the Convenient Hotpot Base, consider subscribing to industry newsletters, following relevant companies and organizations, or regularly checking reputable industry news sources and publications.
Methodology
Step 1 - Identification of Relevant Samples Size from Population Database


Step 2 - Approaches for Defining Global Market Size (Value, Volume* & Price*)

Note*: In applicable scenarios
Step 3 - Data Sources
Primary Research
- Web Analytics
- Survey Reports
- Research Institute
- Latest Research Reports
- Opinion Leaders
Secondary Research
- Annual Reports
- White Paper
- Latest Press Release
- Industry Association
- Paid Database
- Investor Presentations

Step 4 - Data Triangulation
Involves using different sources of information in order to increase the validity of a study
These sources are likely to be stakeholders in a program - participants, other researchers, program staff, other community members, and so on.
Then we put all data in single framework & apply various statistical tools to find out the dynamic on the market.
During the analysis stage, feedback from the stakeholder groups would be compared to determine areas of agreement as well as areas of divergence
