

Key Insights
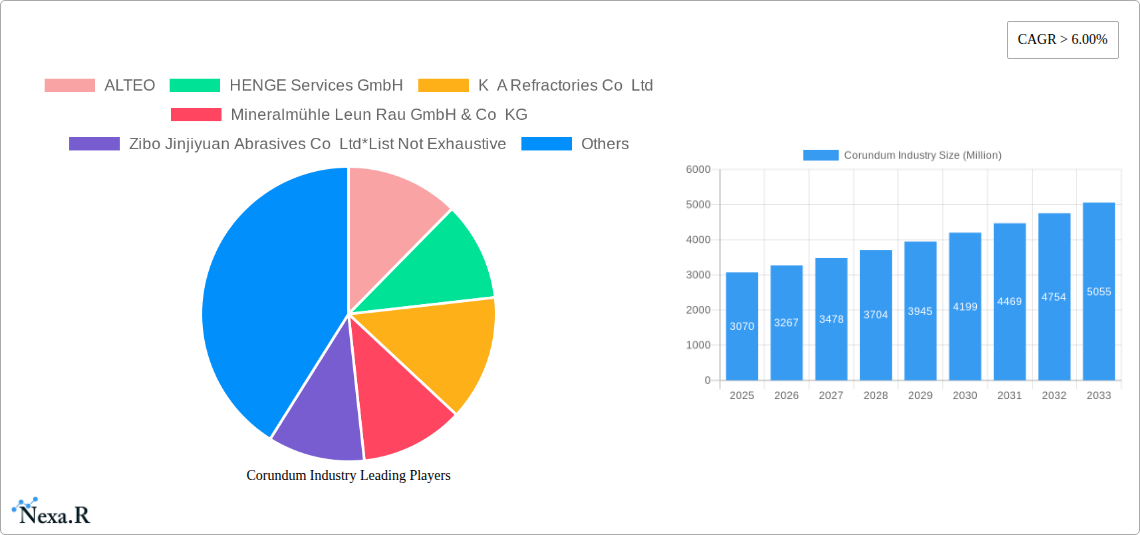
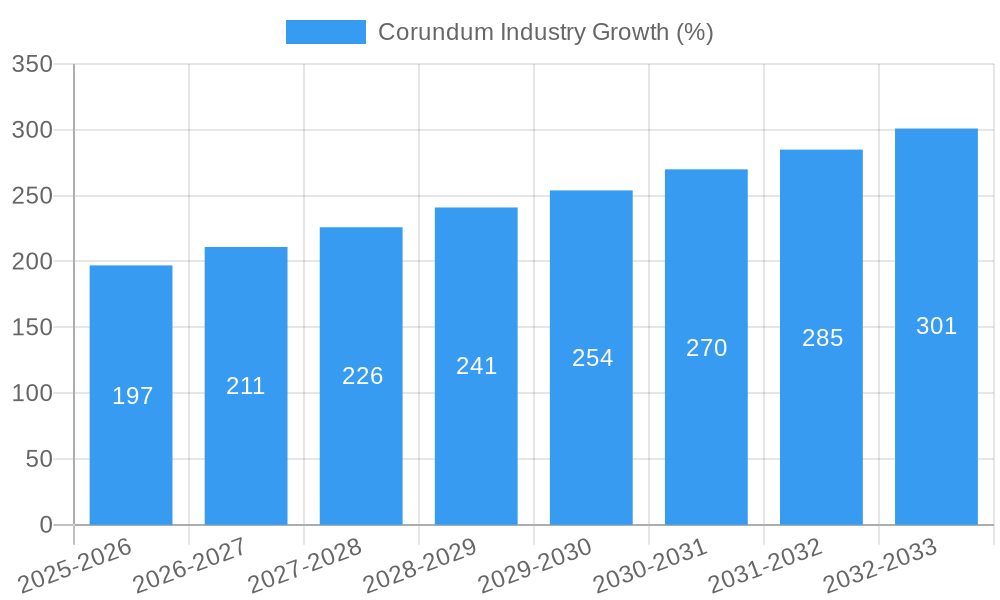
The corundum market, valued at $3.07 billion in 2025, is projected to experience robust growth, exceeding a 6% CAGR from 2025 to 2033. This expansion is driven by increasing demand across diverse applications, notably in jewelry, abrasives, and refractories. The jewelry segment benefits from corundum's inherent beauty and durability, particularly for synthetic rubies and sapphires. Simultaneously, the abrasives sector leverages corundum's exceptional hardness for grinding and polishing applications in various industries, fueling significant market growth. The rising adoption of advanced materials and technologies in electronics and industrial sectors further contributes to the market's expansion. Furthermore, the growing demand for high-performance refractories in metallurgical and chemical processing plants acts as a key driver. While challenges exist, such as price volatility of raw materials and potential environmental concerns related to mining, innovative manufacturing processes and the exploration of sustainable sourcing strategies are mitigating these risks. Geographic expansion, particularly in rapidly developing economies in Asia-Pacific, is expected to further bolster market growth. Key players like ALTEO, RIKEN CORUNDUM, and RusAL are strategically positioning themselves to capitalize on these trends through product diversification, technological advancements, and strategic acquisitions.
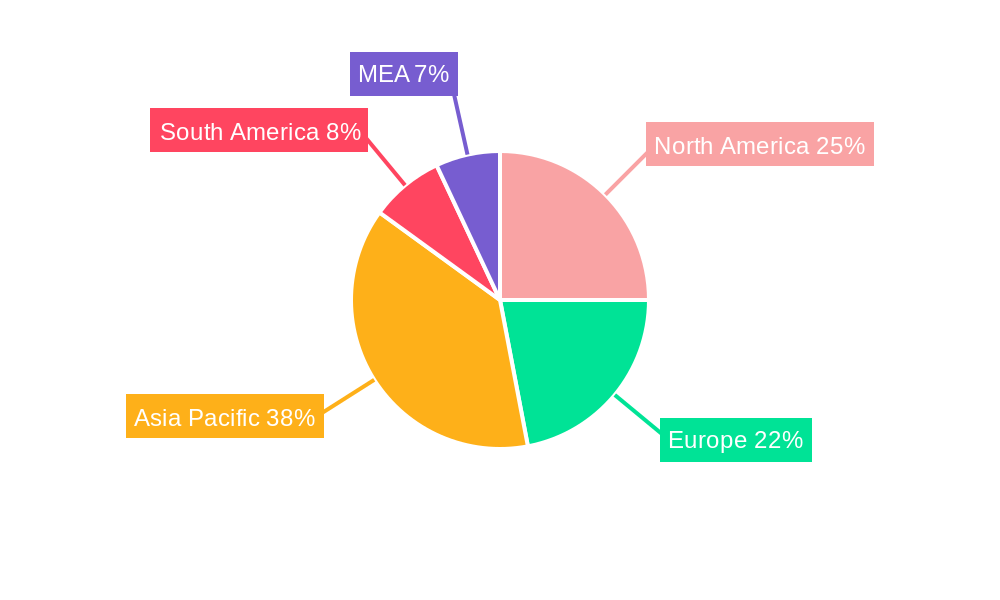
The market segmentation reveals a diversified landscape, with Emery, Ruby, and Sapphire dominating the "by type" category. The application-based segmentation highlights the significant contributions of jewelry, abrasives, and refractories. Regional analysis indicates strong growth potential across Asia-Pacific, driven by robust industrialization and increasing consumer spending. Europe and North America remain significant markets, characterized by established industries and high per-capita consumption. However, emerging markets in South America and MEA are attracting increasing attention due to their growing industrial bases and expanding infrastructure projects. Future growth will depend on technological advancements leading to higher-quality corundum products, innovative applications, and strategic partnerships among industry stakeholders.
Corundum Industry Market Report: 2019-2033
This comprehensive report provides a detailed analysis of the global corundum market, encompassing historical data (2019-2024), current estimates (2025), and future projections (2025-2033). It delves into market dynamics, growth trends, regional landscapes, key players, and emerging opportunities, offering invaluable insights for industry professionals, investors, and stakeholders. The report segments the market by type (Emery, Ruby, Sapphire) and application (Jewelry, Abrasive, Refractory, Mineral, Electrical and Electronics, Other Applications), providing a granular understanding of market behavior across various segments. The market is valued in million units.
Corundum Industry Market Dynamics & Structure
The corundum market exhibits a moderately concentrated structure with key players such as ALTEO, Henge Services GmbH, K A Refractories Co Ltd, Mineralmühle Leun Rau GmbH & Co KG, Zibo Jinjiyuan Abrasives Co Ltd, RIKEN CORUNDUM CO LTD, and RusAL holding significant market share. Technological advancements in synthesis techniques and material processing drive innovation, while regulatory frameworks concerning environmental impact and worker safety shape market practices. Competitive substitutes, such as other abrasive materials, influence market dynamics. M&A activity has been moderate in recent years, with xx deals recorded between 2019 and 2024, representing a market value of xx million.
- Market Concentration: Moderately concentrated, with top 7 players holding approximately xx% market share in 2025.
- Technological Innovation: Focus on improving synthesis purity, enhancing material properties, and developing sustainable production methods.
- Regulatory Framework: Increasing emphasis on environmental regulations and worker safety standards.
- Competitive Substitutes: Competition from alternative abrasive materials like silicon carbide and boron carbide.
- End-User Demographics: Diverse, including jewelry manufacturers, industrial abrasive users, refractory producers, and electronics manufacturers.
- M&A Trends: Moderate activity, with an average of xx deals per year between 2019-2024.
Corundum Industry Growth Trends & Insights
The global corundum market is projected to experience robust growth throughout the forecast period (2025-2033), driven by increasing demand from various end-use sectors. The market size, valued at xx million units in 2025, is anticipated to reach xx million units by 2033, exhibiting a CAGR of xx%. This growth is fueled by technological advancements leading to improved material properties and expanding applications in diverse sectors such as electronics and medical devices. Consumer preference for high-quality and durable products further fuels market expansion. Adoption rates are highest in the abrasive and refractory segments. Significant technological disruptions have seen the adoption of advanced synthesis techniques, improving efficiency and quality.
Dominant Regions, Countries, or Segments in Corundum Industry
The Asia-Pacific region is the dominant market for corundum, accounting for xx% of the global market share in 2025, driven by rapid industrialization and strong demand from the abrasive and refractory sectors in countries like China and India. Within the application segments, the abrasive sector holds the largest market share (xx%), followed by the refractory (xx%) and jewelry (xx%) segments.
- Key Drivers in Asia-Pacific: Rapid industrialization, rising disposable incomes, and government initiatives promoting infrastructure development.
- Dominance Factors: Large manufacturing base, low production costs, and strong demand from various industries.
- Growth Potential: Significant growth potential exists in emerging economies across Asia-Pacific and other developing regions.
- Emery segment is expected to dominate by type owing to high usage in industrial abrasive applications.
Corundum Industry Product Landscape
The corundum market offers a range of products, including different grades of emery, ruby, and sapphire, each tailored to specific applications. Product innovation focuses on improving purity, grain size control, and surface finishing to enhance performance across diverse applications. Unique selling propositions include customized particle size distribution and enhanced durability. Technological advancements focus on optimizing synthesis processes to create higher-quality corundum with improved physical and chemical properties.
Key Drivers, Barriers & Challenges in Corundum Industry
Key Drivers: Increasing demand from industrial sectors (abrasives, refractories), technological advancements in synthesis methods, growing consumer demand for high-quality jewelry, and supportive government policies in key regions.
Challenges & Restraints: Fluctuations in raw material prices, environmental concerns related to production processes, intense competition, and potential supply chain disruptions. The impact of these challenges is estimated to reduce the market growth rate by approximately xx% over the forecast period.
Emerging Opportunities in Corundum Industry
Untapped markets in developing economies present significant growth opportunities. Innovative applications in advanced materials, including high-performance ceramics and electronics, offer strong potential. Evolving consumer preferences for sustainable and ethically sourced products create new opportunities for manufacturers focusing on responsible production practices.
Growth Accelerators in the Corundum Industry Industry
Technological advancements in corundum synthesis, such as the development of more energy-efficient and environmentally friendly methods, will act as significant growth accelerators. Strategic partnerships between corundum producers and downstream users can accelerate product innovation and market penetration. Expansion into new geographical markets, particularly in developing economies, offers significant growth opportunities.
Key Players Shaping the Corundum Industry Market
- ALTEO
- Henge Services GmbH
- K A Refractories Co Ltd
- Mineralmühle Leun Rau GmbH & Co KG
- Zibo Jinjiyuan Abrasives Co Ltd
- RIKEN CORUNDUM CO LTD
- RusAL
Notable Milestones in Corundum Industry Sector
- 2021 Q3: ALTEO launches a new line of high-purity corundum for advanced electronics applications.
- 2022 Q1: A significant merger between two key players in the corundum mining sector reshapes the competitive landscape.
- 2023 Q4: Introduction of a new sustainable corundum synthesis technology significantly reduces the environmental impact of production. (Further milestones to be added based on available data).
In-Depth Corundum Industry Market Outlook
The corundum market is poised for continued growth, driven by technological advancements, expanding applications, and strong demand from diverse industries. Strategic partnerships and investments in research and development will be crucial for companies to secure a leading position in this evolving market. Focusing on sustainability and ethical sourcing will also become increasingly important to attract environmentally conscious consumers and investors. The long-term market outlook is positive, with significant potential for growth across various segments and regions.
Corundum Industry Segmentation
-
1. Type
- 1.1. Emery
- 1.2. Ruby
- 1.3. Sapphire
-
2. Application
- 2.1. Jewelry
- 2.2. Abrasive
- 2.3. Refractory
- 2.4. Mineral
- 2.5. Electrical and Electronics
- 2.6. Other Ap
Corundum Industry Segmentation By Geography
-
1. Asia Pacific
- 1.1. China
- 1.2. India
- 1.3. Japan
- 1.4. South Korea
- 1.5. Malaysia
- 1.6. Thailand
- 1.7. Indonesia
- 1.8. Vietnam
- 1.9. Rest of Asia Pacific
-
2. North America
- 2.1. United States
- 2.2. Canada
- 2.3. Mexico
-
3. Europe
- 3.1. Germany
- 3.2. United Kingdom
- 3.3. France
- 3.4. Italy
- 3.5. Spain
- 3.6. Nordic Countries
- 3.7. Turkey
- 3.8. Russia
- 3.9. Rest of Europe
-
4. South America
- 4.1. Brazil
- 4.2. Argentina
- 4.3. Colombia
- 4.4. Rest of South America
-
5. Middle East and Africa
- 5.1. Saudi Arabia
- 5.2. South Africa
- 5.3. Nigeria
- 5.4. Qatar
- 5.5. Egypt
- 5.6. United Arab Emirates
- 5.7. Rest of Middle East and Africa
Corundum Industry REPORT HIGHLIGHTS
| Aspects | Details |
|---|---|
| Study Period | 2019-2033 |
| Base Year | 2024 |
| Estimated Year | 2025 |
| Forecast Period | 2025-2033 |
| Historical Period | 2019-2024 |
| Growth Rate | CAGR of > 6.00% from 2019-2033 |
| Segmentation |
|
Table of Contents
- 1. Introduction
- 1.1. Research Scope
- 1.2. Market Segmentation
- 1.3. Research Methodology
- 1.4. Definitions and Assumptions
- 2. Executive Summary
- 2.1. Introduction
- 3. Market Dynamics
- 3.1. Introduction
- 3.2. Market Drivers
- 3.2.1. High Demand for Synthetic Corundum in Abrasion Applications; Growing Demand of Artificial Corundum in Jewelry Sector; Others
- 3.3. Market Restrains
- 3.3.1. Competition from Fused Alumina and Silicon Carbide; Others
- 3.4. Market Trends
- 3.4.1. Jewelry Segment to Dominate the Market
- 4. Market Factor Analysis
- 4.1. Porters Five Forces
- 4.2. Supply/Value Chain
- 4.3. PESTEL analysis
- 4.4. Market Entropy
- 4.5. Patent/Trademark Analysis
- 5. Global Corundum Industry Analysis, Insights and Forecast, 2019-2031
- 5.1. Market Analysis, Insights and Forecast - by Type
- 5.1.1. Emery
- 5.1.2. Ruby
- 5.1.3. Sapphire
- 5.2. Market Analysis, Insights and Forecast - by Application
- 5.2.1. Jewelry
- 5.2.2. Abrasive
- 5.2.3. Refractory
- 5.2.4. Mineral
- 5.2.5. Electrical and Electronics
- 5.2.6. Other Ap
- 5.3. Market Analysis, Insights and Forecast - by Region
- 5.3.1. Asia Pacific
- 5.3.2. North America
- 5.3.3. Europe
- 5.3.4. South America
- 5.3.5. Middle East and Africa
- 5.1. Market Analysis, Insights and Forecast - by Type
- 6. Asia Pacific Corundum Industry Analysis, Insights and Forecast, 2019-2031
- 6.1. Market Analysis, Insights and Forecast - by Type
- 6.1.1. Emery
- 6.1.2. Ruby
- 6.1.3. Sapphire
- 6.2. Market Analysis, Insights and Forecast - by Application
- 6.2.1. Jewelry
- 6.2.2. Abrasive
- 6.2.3. Refractory
- 6.2.4. Mineral
- 6.2.5. Electrical and Electronics
- 6.2.6. Other Ap
- 6.1. Market Analysis, Insights and Forecast - by Type
- 7. North America Corundum Industry Analysis, Insights and Forecast, 2019-2031
- 7.1. Market Analysis, Insights and Forecast - by Type
- 7.1.1. Emery
- 7.1.2. Ruby
- 7.1.3. Sapphire
- 7.2. Market Analysis, Insights and Forecast - by Application
- 7.2.1. Jewelry
- 7.2.2. Abrasive
- 7.2.3. Refractory
- 7.2.4. Mineral
- 7.2.5. Electrical and Electronics
- 7.2.6. Other Ap
- 7.1. Market Analysis, Insights and Forecast - by Type
- 8. Europe Corundum Industry Analysis, Insights and Forecast, 2019-2031
- 8.1. Market Analysis, Insights and Forecast - by Type
- 8.1.1. Emery
- 8.1.2. Ruby
- 8.1.3. Sapphire
- 8.2. Market Analysis, Insights and Forecast - by Application
- 8.2.1. Jewelry
- 8.2.2. Abrasive
- 8.2.3. Refractory
- 8.2.4. Mineral
- 8.2.5. Electrical and Electronics
- 8.2.6. Other Ap
- 8.1. Market Analysis, Insights and Forecast - by Type
- 9. South America Corundum Industry Analysis, Insights and Forecast, 2019-2031
- 9.1. Market Analysis, Insights and Forecast - by Type
- 9.1.1. Emery
- 9.1.2. Ruby
- 9.1.3. Sapphire
- 9.2. Market Analysis, Insights and Forecast - by Application
- 9.2.1. Jewelry
- 9.2.2. Abrasive
- 9.2.3. Refractory
- 9.2.4. Mineral
- 9.2.5. Electrical and Electronics
- 9.2.6. Other Ap
- 9.1. Market Analysis, Insights and Forecast - by Type
- 10. Middle East and Africa Corundum Industry Analysis, Insights and Forecast, 2019-2031
- 10.1. Market Analysis, Insights and Forecast - by Type
- 10.1.1. Emery
- 10.1.2. Ruby
- 10.1.3. Sapphire
- 10.2. Market Analysis, Insights and Forecast - by Application
- 10.2.1. Jewelry
- 10.2.2. Abrasive
- 10.2.3. Refractory
- 10.2.4. Mineral
- 10.2.5. Electrical and Electronics
- 10.2.6. Other Ap
- 10.1. Market Analysis, Insights and Forecast - by Type
- 11. Europe Corundum Industry Analysis, Insights and Forecast, 2019-2031
- 11.1. Market Analysis, Insights and Forecast - By Country/Sub-region
- 11.1.1 Germany
- 11.1.2 United Kingdom
- 11.1.3 France
- 11.1.4 Spain
- 11.1.5 Italy
- 11.1.6 Spain
- 11.1.7 Belgium
- 11.1.8 Netherland
- 11.1.9 Nordics
- 11.1.10 Rest of Europe
- 12. Asia Pacific Corundum Industry Analysis, Insights and Forecast, 2019-2031
- 12.1. Market Analysis, Insights and Forecast - By Country/Sub-region
- 12.1.1 China
- 12.1.2 Japan
- 12.1.3 India
- 12.1.4 South Korea
- 12.1.5 Southeast Asia
- 12.1.6 Australia
- 12.1.7 Indonesia
- 12.1.8 Phillipes
- 12.1.9 Singapore
- 12.1.10 Thailandc
- 12.1.11 Rest of Asia Pacific
- 13. South America Corundum Industry Analysis, Insights and Forecast, 2019-2031
- 13.1. Market Analysis, Insights and Forecast - By Country/Sub-region
- 13.1.1 Brazil
- 13.1.2 Argentina
- 13.1.3 Peru
- 13.1.4 Chile
- 13.1.5 Colombia
- 13.1.6 Ecuador
- 13.1.7 Venezuela
- 13.1.8 Rest of South America
- 14. North America Corundum Industry Analysis, Insights and Forecast, 2019-2031
- 14.1. Market Analysis, Insights and Forecast - By Country/Sub-region
- 14.1.1 United States
- 14.1.2 Canada
- 14.1.3 Mexico
- 15. MEA Corundum Industry Analysis, Insights and Forecast, 2019-2031
- 15.1. Market Analysis, Insights and Forecast - By Country/Sub-region
- 15.1.1 United Arab Emirates
- 15.1.2 Saudi Arabia
- 15.1.3 South Africa
- 15.1.4 Rest of Middle East and Africa
- 16. Competitive Analysis
- 16.1. Global Market Share Analysis 2024
- 16.2. Company Profiles
- 16.2.1 ALTEO
- 16.2.1.1. Overview
- 16.2.1.2. Products
- 16.2.1.3. SWOT Analysis
- 16.2.1.4. Recent Developments
- 16.2.1.5. Financials (Based on Availability)
- 16.2.2 HENGE Services GmbH
- 16.2.2.1. Overview
- 16.2.2.2. Products
- 16.2.2.3. SWOT Analysis
- 16.2.2.4. Recent Developments
- 16.2.2.5. Financials (Based on Availability)
- 16.2.3 K A Refractories Co Ltd
- 16.2.3.1. Overview
- 16.2.3.2. Products
- 16.2.3.3. SWOT Analysis
- 16.2.3.4. Recent Developments
- 16.2.3.5. Financials (Based on Availability)
- 16.2.4 Mineralmühle Leun Rau GmbH & Co KG
- 16.2.4.1. Overview
- 16.2.4.2. Products
- 16.2.4.3. SWOT Analysis
- 16.2.4.4. Recent Developments
- 16.2.4.5. Financials (Based on Availability)
- 16.2.5 Zibo Jinjiyuan Abrasives Co Ltd*List Not Exhaustive
- 16.2.5.1. Overview
- 16.2.5.2. Products
- 16.2.5.3. SWOT Analysis
- 16.2.5.4. Recent Developments
- 16.2.5.5. Financials (Based on Availability)
- 16.2.6 RIKEN CORUNDUM CO LTD
- 16.2.6.1. Overview
- 16.2.6.2. Products
- 16.2.6.3. SWOT Analysis
- 16.2.6.4. Recent Developments
- 16.2.6.5. Financials (Based on Availability)
- 16.2.7 RusAL
- 16.2.7.1. Overview
- 16.2.7.2. Products
- 16.2.7.3. SWOT Analysis
- 16.2.7.4. Recent Developments
- 16.2.7.5. Financials (Based on Availability)
- 16.2.1 ALTEO
List of Figures
- Figure 1: Global Corundum Industry Revenue Breakdown (Million, %) by Region 2024 & 2032
- Figure 2: Europe Corundum Industry Revenue (Million), by Country 2024 & 2032
- Figure 3: Europe Corundum Industry Revenue Share (%), by Country 2024 & 2032
- Figure 4: Asia Pacific Corundum Industry Revenue (Million), by Country 2024 & 2032
- Figure 5: Asia Pacific Corundum Industry Revenue Share (%), by Country 2024 & 2032
- Figure 6: South America Corundum Industry Revenue (Million), by Country 2024 & 2032
- Figure 7: South America Corundum Industry Revenue Share (%), by Country 2024 & 2032
- Figure 8: North America Corundum Industry Revenue (Million), by Country 2024 & 2032
- Figure 9: North America Corundum Industry Revenue Share (%), by Country 2024 & 2032
- Figure 10: MEA Corundum Industry Revenue (Million), by Country 2024 & 2032
- Figure 11: MEA Corundum Industry Revenue Share (%), by Country 2024 & 2032
- Figure 12: Asia Pacific Corundum Industry Revenue (Million), by Type 2024 & 2032
- Figure 13: Asia Pacific Corundum Industry Revenue Share (%), by Type 2024 & 2032
- Figure 14: Asia Pacific Corundum Industry Revenue (Million), by Application 2024 & 2032
- Figure 15: Asia Pacific Corundum Industry Revenue Share (%), by Application 2024 & 2032
- Figure 16: Asia Pacific Corundum Industry Revenue (Million), by Country 2024 & 2032
- Figure 17: Asia Pacific Corundum Industry Revenue Share (%), by Country 2024 & 2032
- Figure 18: North America Corundum Industry Revenue (Million), by Type 2024 & 2032
- Figure 19: North America Corundum Industry Revenue Share (%), by Type 2024 & 2032
- Figure 20: North America Corundum Industry Revenue (Million), by Application 2024 & 2032
- Figure 21: North America Corundum Industry Revenue Share (%), by Application 2024 & 2032
- Figure 22: North America Corundum Industry Revenue (Million), by Country 2024 & 2032
- Figure 23: North America Corundum Industry Revenue Share (%), by Country 2024 & 2032
- Figure 24: Europe Corundum Industry Revenue (Million), by Type 2024 & 2032
- Figure 25: Europe Corundum Industry Revenue Share (%), by Type 2024 & 2032
- Figure 26: Europe Corundum Industry Revenue (Million), by Application 2024 & 2032
- Figure 27: Europe Corundum Industry Revenue Share (%), by Application 2024 & 2032
- Figure 28: Europe Corundum Industry Revenue (Million), by Country 2024 & 2032
- Figure 29: Europe Corundum Industry Revenue Share (%), by Country 2024 & 2032
- Figure 30: South America Corundum Industry Revenue (Million), by Type 2024 & 2032
- Figure 31: South America Corundum Industry Revenue Share (%), by Type 2024 & 2032
- Figure 32: South America Corundum Industry Revenue (Million), by Application 2024 & 2032
- Figure 33: South America Corundum Industry Revenue Share (%), by Application 2024 & 2032
- Figure 34: South America Corundum Industry Revenue (Million), by Country 2024 & 2032
- Figure 35: South America Corundum Industry Revenue Share (%), by Country 2024 & 2032
- Figure 36: Middle East and Africa Corundum Industry Revenue (Million), by Type 2024 & 2032
- Figure 37: Middle East and Africa Corundum Industry Revenue Share (%), by Type 2024 & 2032
- Figure 38: Middle East and Africa Corundum Industry Revenue (Million), by Application 2024 & 2032
- Figure 39: Middle East and Africa Corundum Industry Revenue Share (%), by Application 2024 & 2032
- Figure 40: Middle East and Africa Corundum Industry Revenue (Million), by Country 2024 & 2032
- Figure 41: Middle East and Africa Corundum Industry Revenue Share (%), by Country 2024 & 2032
List of Tables
- Table 1: Global Corundum Industry Revenue Million Forecast, by Region 2019 & 2032
- Table 2: Global Corundum Industry Revenue Million Forecast, by Type 2019 & 2032
- Table 3: Global Corundum Industry Revenue Million Forecast, by Application 2019 & 2032
- Table 4: Global Corundum Industry Revenue Million Forecast, by Region 2019 & 2032
- Table 5: Global Corundum Industry Revenue Million Forecast, by Country 2019 & 2032
- Table 6: Germany Corundum Industry Revenue (Million) Forecast, by Application 2019 & 2032
- Table 7: United Kingdom Corundum Industry Revenue (Million) Forecast, by Application 2019 & 2032
- Table 8: France Corundum Industry Revenue (Million) Forecast, by Application 2019 & 2032
- Table 9: Spain Corundum Industry Revenue (Million) Forecast, by Application 2019 & 2032
- Table 10: Italy Corundum Industry Revenue (Million) Forecast, by Application 2019 & 2032
- Table 11: Spain Corundum Industry Revenue (Million) Forecast, by Application 2019 & 2032
- Table 12: Belgium Corundum Industry Revenue (Million) Forecast, by Application 2019 & 2032
- Table 13: Netherland Corundum Industry Revenue (Million) Forecast, by Application 2019 & 2032
- Table 14: Nordics Corundum Industry Revenue (Million) Forecast, by Application 2019 & 2032
- Table 15: Rest of Europe Corundum Industry Revenue (Million) Forecast, by Application 2019 & 2032
- Table 16: Global Corundum Industry Revenue Million Forecast, by Country 2019 & 2032
- Table 17: China Corundum Industry Revenue (Million) Forecast, by Application 2019 & 2032
- Table 18: Japan Corundum Industry Revenue (Million) Forecast, by Application 2019 & 2032
- Table 19: India Corundum Industry Revenue (Million) Forecast, by Application 2019 & 2032
- Table 20: South Korea Corundum Industry Revenue (Million) Forecast, by Application 2019 & 2032
- Table 21: Southeast Asia Corundum Industry Revenue (Million) Forecast, by Application 2019 & 2032
- Table 22: Australia Corundum Industry Revenue (Million) Forecast, by Application 2019 & 2032
- Table 23: Indonesia Corundum Industry Revenue (Million) Forecast, by Application 2019 & 2032
- Table 24: Phillipes Corundum Industry Revenue (Million) Forecast, by Application 2019 & 2032
- Table 25: Singapore Corundum Industry Revenue (Million) Forecast, by Application 2019 & 2032
- Table 26: Thailandc Corundum Industry Revenue (Million) Forecast, by Application 2019 & 2032
- Table 27: Rest of Asia Pacific Corundum Industry Revenue (Million) Forecast, by Application 2019 & 2032
- Table 28: Global Corundum Industry Revenue Million Forecast, by Country 2019 & 2032
- Table 29: Brazil Corundum Industry Revenue (Million) Forecast, by Application 2019 & 2032
- Table 30: Argentina Corundum Industry Revenue (Million) Forecast, by Application 2019 & 2032
- Table 31: Peru Corundum Industry Revenue (Million) Forecast, by Application 2019 & 2032
- Table 32: Chile Corundum Industry Revenue (Million) Forecast, by Application 2019 & 2032
- Table 33: Colombia Corundum Industry Revenue (Million) Forecast, by Application 2019 & 2032
- Table 34: Ecuador Corundum Industry Revenue (Million) Forecast, by Application 2019 & 2032
- Table 35: Venezuela Corundum Industry Revenue (Million) Forecast, by Application 2019 & 2032
- Table 36: Rest of South America Corundum Industry Revenue (Million) Forecast, by Application 2019 & 2032
- Table 37: Global Corundum Industry Revenue Million Forecast, by Country 2019 & 2032
- Table 38: United States Corundum Industry Revenue (Million) Forecast, by Application 2019 & 2032
- Table 39: Canada Corundum Industry Revenue (Million) Forecast, by Application 2019 & 2032
- Table 40: Mexico Corundum Industry Revenue (Million) Forecast, by Application 2019 & 2032
- Table 41: Global Corundum Industry Revenue Million Forecast, by Country 2019 & 2032
- Table 42: United Arab Emirates Corundum Industry Revenue (Million) Forecast, by Application 2019 & 2032
- Table 43: Saudi Arabia Corundum Industry Revenue (Million) Forecast, by Application 2019 & 2032
- Table 44: South Africa Corundum Industry Revenue (Million) Forecast, by Application 2019 & 2032
- Table 45: Rest of Middle East and Africa Corundum Industry Revenue (Million) Forecast, by Application 2019 & 2032
- Table 46: Global Corundum Industry Revenue Million Forecast, by Type 2019 & 2032
- Table 47: Global Corundum Industry Revenue Million Forecast, by Application 2019 & 2032
- Table 48: Global Corundum Industry Revenue Million Forecast, by Country 2019 & 2032
- Table 49: China Corundum Industry Revenue (Million) Forecast, by Application 2019 & 2032
- Table 50: India Corundum Industry Revenue (Million) Forecast, by Application 2019 & 2032
- Table 51: Japan Corundum Industry Revenue (Million) Forecast, by Application 2019 & 2032
- Table 52: South Korea Corundum Industry Revenue (Million) Forecast, by Application 2019 & 2032
- Table 53: Malaysia Corundum Industry Revenue (Million) Forecast, by Application 2019 & 2032
- Table 54: Thailand Corundum Industry Revenue (Million) Forecast, by Application 2019 & 2032
- Table 55: Indonesia Corundum Industry Revenue (Million) Forecast, by Application 2019 & 2032
- Table 56: Vietnam Corundum Industry Revenue (Million) Forecast, by Application 2019 & 2032
- Table 57: Rest of Asia Pacific Corundum Industry Revenue (Million) Forecast, by Application 2019 & 2032
- Table 58: Global Corundum Industry Revenue Million Forecast, by Type 2019 & 2032
- Table 59: Global Corundum Industry Revenue Million Forecast, by Application 2019 & 2032
- Table 60: Global Corundum Industry Revenue Million Forecast, by Country 2019 & 2032
- Table 61: United States Corundum Industry Revenue (Million) Forecast, by Application 2019 & 2032
- Table 62: Canada Corundum Industry Revenue (Million) Forecast, by Application 2019 & 2032
- Table 63: Mexico Corundum Industry Revenue (Million) Forecast, by Application 2019 & 2032
- Table 64: Global Corundum Industry Revenue Million Forecast, by Type 2019 & 2032
- Table 65: Global Corundum Industry Revenue Million Forecast, by Application 2019 & 2032
- Table 66: Global Corundum Industry Revenue Million Forecast, by Country 2019 & 2032
- Table 67: Germany Corundum Industry Revenue (Million) Forecast, by Application 2019 & 2032
- Table 68: United Kingdom Corundum Industry Revenue (Million) Forecast, by Application 2019 & 2032
- Table 69: France Corundum Industry Revenue (Million) Forecast, by Application 2019 & 2032
- Table 70: Italy Corundum Industry Revenue (Million) Forecast, by Application 2019 & 2032
- Table 71: Spain Corundum Industry Revenue (Million) Forecast, by Application 2019 & 2032
- Table 72: Nordic Countries Corundum Industry Revenue (Million) Forecast, by Application 2019 & 2032
- Table 73: Turkey Corundum Industry Revenue (Million) Forecast, by Application 2019 & 2032
- Table 74: Russia Corundum Industry Revenue (Million) Forecast, by Application 2019 & 2032
- Table 75: Rest of Europe Corundum Industry Revenue (Million) Forecast, by Application 2019 & 2032
- Table 76: Global Corundum Industry Revenue Million Forecast, by Type 2019 & 2032
- Table 77: Global Corundum Industry Revenue Million Forecast, by Application 2019 & 2032
- Table 78: Global Corundum Industry Revenue Million Forecast, by Country 2019 & 2032
- Table 79: Brazil Corundum Industry Revenue (Million) Forecast, by Application 2019 & 2032
- Table 80: Argentina Corundum Industry Revenue (Million) Forecast, by Application 2019 & 2032
- Table 81: Colombia Corundum Industry Revenue (Million) Forecast, by Application 2019 & 2032
- Table 82: Rest of South America Corundum Industry Revenue (Million) Forecast, by Application 2019 & 2032
- Table 83: Global Corundum Industry Revenue Million Forecast, by Type 2019 & 2032
- Table 84: Global Corundum Industry Revenue Million Forecast, by Application 2019 & 2032
- Table 85: Global Corundum Industry Revenue Million Forecast, by Country 2019 & 2032
- Table 86: Saudi Arabia Corundum Industry Revenue (Million) Forecast, by Application 2019 & 2032
- Table 87: South Africa Corundum Industry Revenue (Million) Forecast, by Application 2019 & 2032
- Table 88: Nigeria Corundum Industry Revenue (Million) Forecast, by Application 2019 & 2032
- Table 89: Qatar Corundum Industry Revenue (Million) Forecast, by Application 2019 & 2032
- Table 90: Egypt Corundum Industry Revenue (Million) Forecast, by Application 2019 & 2032
- Table 91: United Arab Emirates Corundum Industry Revenue (Million) Forecast, by Application 2019 & 2032
- Table 92: Rest of Middle East and Africa Corundum Industry Revenue (Million) Forecast, by Application 2019 & 2032
Frequently Asked Questions
1. What is the projected Compound Annual Growth Rate (CAGR) of the Corundum Industry?
The projected CAGR is approximately > 6.00%.
2. Which companies are prominent players in the Corundum Industry?
Key companies in the market include ALTEO, HENGE Services GmbH, K A Refractories Co Ltd, Mineralmühle Leun Rau GmbH & Co KG, Zibo Jinjiyuan Abrasives Co Ltd*List Not Exhaustive, RIKEN CORUNDUM CO LTD, RusAL.
3. What are the main segments of the Corundum Industry?
The market segments include Type, Application.
4. Can you provide details about the market size?
The market size is estimated to be USD 3.07 Million as of 2022.
5. What are some drivers contributing to market growth?
High Demand for Synthetic Corundum in Abrasion Applications; Growing Demand of Artificial Corundum in Jewelry Sector; Others.
6. What are the notable trends driving market growth?
Jewelry Segment to Dominate the Market.
7. Are there any restraints impacting market growth?
Competition from Fused Alumina and Silicon Carbide; Others.
8. Can you provide examples of recent developments in the market?
N/A
9. What pricing options are available for accessing the report?
Pricing options include single-user, multi-user, and enterprise licenses priced at USD 4750, USD 5250, and USD 8750 respectively.
10. Is the market size provided in terms of value or volume?
The market size is provided in terms of value, measured in Million.
11. Are there any specific market keywords associated with the report?
Yes, the market keyword associated with the report is "Corundum Industry," which aids in identifying and referencing the specific market segment covered.
12. How do I determine which pricing option suits my needs best?
The pricing options vary based on user requirements and access needs. Individual users may opt for single-user licenses, while businesses requiring broader access may choose multi-user or enterprise licenses for cost-effective access to the report.
13. Are there any additional resources or data provided in the Corundum Industry report?
While the report offers comprehensive insights, it's advisable to review the specific contents or supplementary materials provided to ascertain if additional resources or data are available.
14. How can I stay updated on further developments or reports in the Corundum Industry?
To stay informed about further developments, trends, and reports in the Corundum Industry, consider subscribing to industry newsletters, following relevant companies and organizations, or regularly checking reputable industry news sources and publications.
Methodology
Step 1 - Identification of Relevant Samples Size from Population Database


Step 2 - Approaches for Defining Global Market Size (Value, Volume* & Price*)

Note*: In applicable scenarios
Step 3 - Data Sources
Primary Research
- Web Analytics
- Survey Reports
- Research Institute
- Latest Research Reports
- Opinion Leaders
Secondary Research
- Annual Reports
- White Paper
- Latest Press Release
- Industry Association
- Paid Database
- Investor Presentations

Step 4 - Data Triangulation
Involves using different sources of information in order to increase the validity of a study
These sources are likely to be stakeholders in a program - participants, other researchers, program staff, other community members, and so on.
Then we put all data in single framework & apply various statistical tools to find out the dynamic on the market.
During the analysis stage, feedback from the stakeholder groups would be compared to determine areas of agreement as well as areas of divergence
