

Key Insights
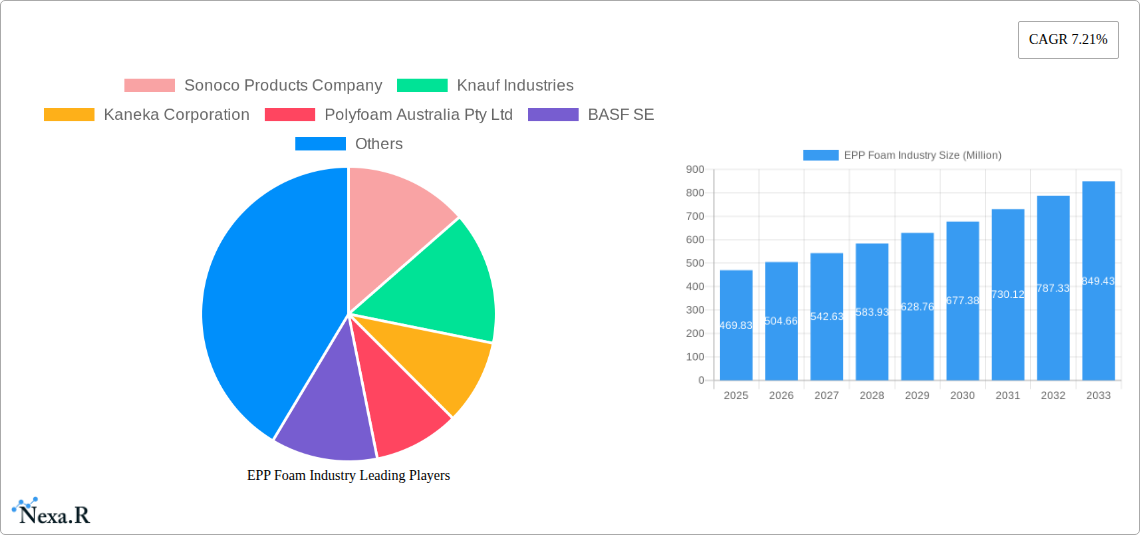
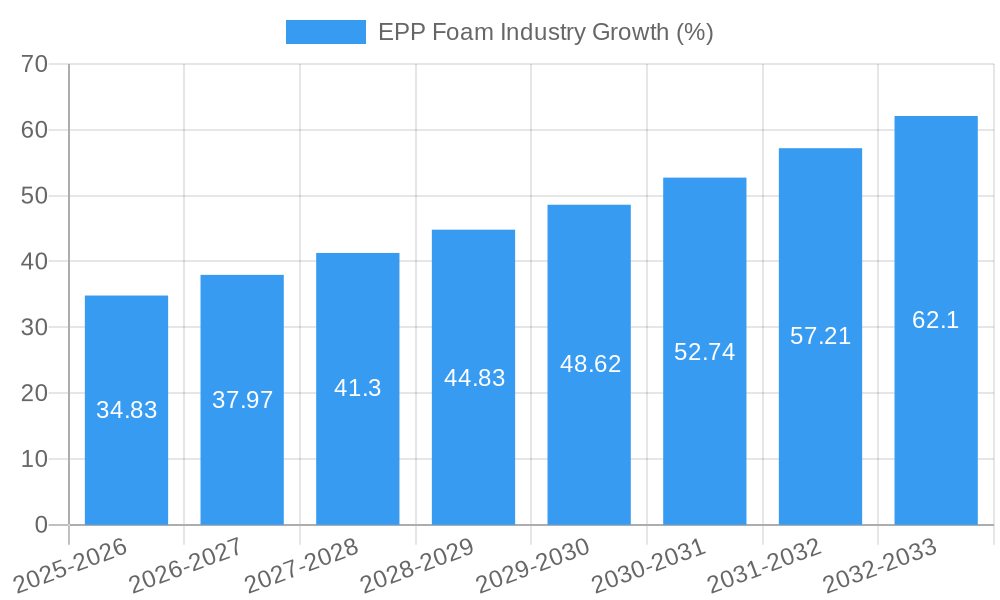
The Expanded Polypropylene (EPP) foam market is experiencing robust growth, projected to reach a substantial size, driven by increasing demand across diverse sectors. The market's Compound Annual Growth Rate (CAGR) of 7.21% from 2019 to 2024 indicates a significant upward trajectory, expected to continue through 2033. Key drivers include the lightweight yet high-impact-resistant nature of EPP, making it ideal for automotive parts (bumpers, dashboards), packaging (particularly for fragile goods and temperature-sensitive products), and sporting goods. The shift towards sustainable packaging solutions further fuels market expansion, with bio-based polypropylene gaining traction as a more environmentally friendly raw material. Significant regional growth is anticipated in the Asia-Pacific region, driven by increasing industrialization and automotive production in countries like China and India. However, the market faces certain restraints, including fluctuations in raw material prices and the competitive landscape presented by alternative packaging and cushioning materials. Segmentation analysis reveals strong performance across various foam types (fabricated and molded EPP) and applications, with automotive and packaging dominating the market share. The continuous innovation in EPP foam formulations, focusing on improved performance characteristics like thermal insulation and recyclability, is expected to further propel market growth in the coming years. Leading companies like Sonoco Products Company, BASF SE, and BEWi (IZOBLOK) are actively shaping market dynamics through their product offerings and expansion strategies.
The market's growth is largely attributed to its versatility. EPP's ability to absorb significant impact while remaining lightweight makes it a preferred choice in various industries. The automotive sector's preference for lighter vehicle components for improved fuel efficiency significantly boosts demand. In packaging, EPP's superior cushioning properties protect sensitive goods during transportation, leading to increased adoption across food, electronics, and pharmaceutical sectors. The burgeoning e-commerce sector, requiring substantial packaging solutions, represents a further significant growth opportunity. Furthermore, advancements in manufacturing processes and the development of customized EPP foam solutions for specific applications are driving market innovation. While competition from alternative materials exists, EPP’s unique combination of properties ensures a sustainable market position, supported by ongoing research and development efforts to enhance its performance and sustainability profile. The forecast for the EPP foam market reflects a positive outlook, driven by continuous technological advancements and the rising demand across diverse applications.
EPP Foam Industry Market Report: 2019-2033
This comprehensive report provides a detailed analysis of the EPP (Expanded Polypropylene) foam industry, covering market dynamics, growth trends, key players, and future outlook. The study period spans from 2019 to 2033, with a focus on the base year 2025 and a forecast period from 2025 to 2033. The report delves into various segments, including raw materials (synthetic and bio-based polypropylene), foam types (fabricated and molded EPP, other foams), and applications (automotive, dunnage, furniture, food packaging, HVAC, sports and leisure, and other applications). The market size is valued in millions of units.
EPP Foam Industry Market Dynamics & Structure
The EPP foam market exhibits a moderately consolidated structure, with several major players holding significant market share. Technological innovation, particularly in material science and manufacturing processes, is a key driver. Regulatory frameworks concerning environmental sustainability and material safety influence product development and market access. Competitive substitutes, such as other foams (e.g., EPS, EPE), exert pressure on pricing and market penetration. End-user demographics, especially in the automotive and packaging sectors, significantly shape demand. M&A activity, as evidenced by recent transactions, indicates consolidation and strategic expansion within the industry.
- Market Concentration: Moderately consolidated, with top 5 players holding approximately xx% market share (2024).
- Technological Innovation: Focus on lightweighting, improved impact resistance, and recyclability drives innovation.
- Regulatory Landscape: Regulations on material safety and environmental impact influence production processes and material selection.
- Competitive Substitutes: EPS, EPE, and other foams compete based on cost, performance, and sustainability.
- End-User Demographics: Growth is driven by demand from automotive, packaging, and sports & leisure sectors.
- M&A Trends: Recent years have witnessed xx M&A deals, signaling industry consolidation and expansion (2019-2024).
EPP Foam Industry Growth Trends & Insights
The EPP foam market has experienced steady growth throughout the historical period (2019-2024), driven by increasing demand from various end-use sectors. The automotive industry remains a primary driver, with EPP increasingly adopted for interior and exterior components due to its lightweight and energy-absorbing properties. Packaging applications are also witnessing significant growth, benefiting from EPP’s protective qualities and recyclability. Technological advancements, such as improved molding techniques and the development of bio-based polypropylene, contribute to market expansion. Shifting consumer preferences towards sustainable and eco-friendly products further support market growth. The CAGR for the period 2019-2024 is estimated at xx%, with a projected CAGR of xx% from 2025-2033. Market penetration in key segments is expected to increase significantly over the forecast period.
Dominant Regions, Countries, or Segments in EPP Foam Industry
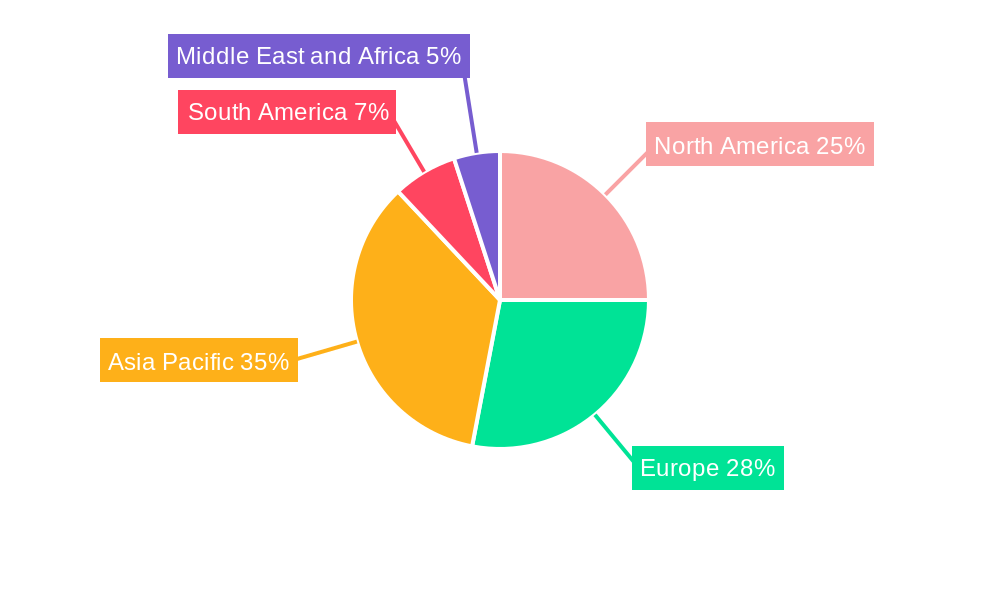
The automotive sector in North America and Europe is driving the demand for molded EPP, while Asia Pacific shows significant growth in the packaging and consumer goods sectors. Fabricated EPP dominates the furniture and dunnage segments globally. Synthetic polypropylene remains the dominant raw material due to its cost-effectiveness.
- Key Drivers: Strong economic growth in key regions, increasing automotive production, and rising consumer demand for durable goods.
- Dominant Regions: North America and Europe (Molded EPP, Automotive), Asia Pacific (Fabricated EPP, Packaging).
- Dominant Segments: Molded EPP (Automotive), Fabricated EPP (Dunnage, Furniture), Synthetic Polypropylene (Raw Material).
- Market Share: North America holds xx% of the global market share (2024), while Asia Pacific is projected to reach xx% by 2033.
EPP Foam Industry Product Landscape
EPP foam products are characterized by their lightweight yet robust nature, excellent energy absorption, and recyclability. Recent innovations focus on improving processability, enhancing performance characteristics, and broadening applications. Unique selling propositions include superior impact resistance, excellent thermal insulation, and reduced environmental footprint. Technological advancements encompass the development of novel formulations, optimized molding processes, and improved surface finishing techniques.
Key Drivers, Barriers & Challenges in EPP Foam Industry
Key Drivers:
- Increasing demand from the automotive and packaging sectors.
- Growing awareness of EPP's lightweight and sustainable properties.
- Technological advancements in manufacturing processes.
- Favorable government policies and regulations supporting sustainable materials.
Challenges and Restraints:
- Fluctuations in raw material prices.
- Competition from alternative foam materials.
- Potential supply chain disruptions.
- Regulatory hurdles concerning material safety and environmental compliance. These factors could limit market growth by an estimated xx% in the next 5 years.
Emerging Opportunities in EPP Foam Industry
- Expansion into new applications, such as 3D printing and medical devices.
- Development of bio-based EPP foams to enhance sustainability.
- Customization of EPP foam properties to meet specific application requirements.
- Penetration into developing economies with growing consumer demand.
Growth Accelerators in the EPP Foam Industry
Technological breakthroughs, especially in material science and manufacturing, are accelerating market growth. Strategic partnerships between foam manufacturers and end-users are fostering innovation and application development. Expansion into new geographic markets and diversification into niche applications create substantial growth opportunities.
Key Players Shaping the EPP Foam Industry Market
- Sonoco Products Company
- Knauf Industries
- Kaneka Corporation
- Polyfoam Australia Pty Ltd
- BASF SE
- BEWi (IZOBLOK)
- K K Nag Pvt Ltd
- Clark Foam Products Corporation
- Woodbridge
- Signode Industrial Group Llc
- JSP
- Hanwha Solutions
Notable Milestones in EPP Foam Industry Sector
- March 2022: Hanwha Solutions announced the split-off and sale of its advanced materials business for USD 491 million, indicating significant investment in the sector.
- February 2022: BEWI acquired a controlling stake (63.83%) in Izoblok, consolidating its position in the EPP market.
In-Depth EPP Foam Industry Market Outlook
The EPP foam industry is poised for continued growth, driven by technological advancements, increasing demand from key sectors, and the adoption of sustainable practices. Strategic partnerships and market expansion initiatives will further propel market expansion. The market presents significant opportunities for innovation and investment, particularly in bio-based materials and novel applications.
EPP Foam Industry Segmentation
-
1. Raw Material
- 1.1. Synthetic Polypropylene
- 1.2. Bio-based Polypropylene
-
2. Foam
- 2.1. Fabricated EPP
- 2.2. Molded EPP
- 2.3. Other Foams
-
3. Application
- 3.1. Automotive
- 3.2. Dunnage
- 3.3. Furniture
- 3.4. Food Packaging
- 3.5. HVAC
- 3.6. Sports and Leisure
- 3.7. Other Applications
EPP Foam Industry Segmentation By Geography
-
1. Asia Pacific
- 1.1. China
- 1.2. India
- 1.3. Japan
- 1.4. South Korea
- 1.5. Rest of Asia Pacific
-
2. North America
- 2.1. United States
- 2.2. Canada
- 2.3. Mexico
-
3. Europe
- 3.1. Germany
- 3.2. United Kingdom
- 3.3. France
- 3.4. Italy
- 3.5. Rest of Europe
-
4. South America
- 4.1. Brazil
- 4.2. Argentina
- 4.3. Rest of South America
-
5. Middle East and Africa
- 5.1. Saudi Arabia
- 5.2. South Africa
- 5.3. Rest of Middle East and Africa
EPP Foam Industry REPORT HIGHLIGHTS
| Aspects | Details |
|---|---|
| Study Period | 2019-2033 |
| Base Year | 2024 |
| Estimated Year | 2025 |
| Forecast Period | 2025-2033 |
| Historical Period | 2019-2024 |
| Growth Rate | CAGR of 7.21% from 2019-2033 |
| Segmentation |
|
Table of Contents
- 1. Introduction
- 1.1. Research Scope
- 1.2. Market Segmentation
- 1.3. Research Methodology
- 1.4. Definitions and Assumptions
- 2. Executive Summary
- 2.1. Introduction
- 3. Market Dynamics
- 3.1. Introduction
- 3.2. Market Drivers
- 3.2.1. Non-toxic and Recyclable Nature of the Material; Rising Demand from the Packaging Industry
- 3.3. Market Restrains
- 3.3.1. Declining Automobile Industry Through Previous Years; Higher Price Among Other Structural Foams
- 3.4. Market Trends
- 3.4.1. Increasing Usage in the Automotive Industry
- 4. Market Factor Analysis
- 4.1. Porters Five Forces
- 4.2. Supply/Value Chain
- 4.3. PESTEL analysis
- 4.4. Market Entropy
- 4.5. Patent/Trademark Analysis
- 5. Global EPP Foam Industry Analysis, Insights and Forecast, 2019-2031
- 5.1. Market Analysis, Insights and Forecast - by Raw Material
- 5.1.1. Synthetic Polypropylene
- 5.1.2. Bio-based Polypropylene
- 5.2. Market Analysis, Insights and Forecast - by Foam
- 5.2.1. Fabricated EPP
- 5.2.2. Molded EPP
- 5.2.3. Other Foams
- 5.3. Market Analysis, Insights and Forecast - by Application
- 5.3.1. Automotive
- 5.3.2. Dunnage
- 5.3.3. Furniture
- 5.3.4. Food Packaging
- 5.3.5. HVAC
- 5.3.6. Sports and Leisure
- 5.3.7. Other Applications
- 5.4. Market Analysis, Insights and Forecast - by Region
- 5.4.1. Asia Pacific
- 5.4.2. North America
- 5.4.3. Europe
- 5.4.4. South America
- 5.4.5. Middle East and Africa
- 5.1. Market Analysis, Insights and Forecast - by Raw Material
- 6. Asia Pacific EPP Foam Industry Analysis, Insights and Forecast, 2019-2031
- 6.1. Market Analysis, Insights and Forecast - by Raw Material
- 6.1.1. Synthetic Polypropylene
- 6.1.2. Bio-based Polypropylene
- 6.2. Market Analysis, Insights and Forecast - by Foam
- 6.2.1. Fabricated EPP
- 6.2.2. Molded EPP
- 6.2.3. Other Foams
- 6.3. Market Analysis, Insights and Forecast - by Application
- 6.3.1. Automotive
- 6.3.2. Dunnage
- 6.3.3. Furniture
- 6.3.4. Food Packaging
- 6.3.5. HVAC
- 6.3.6. Sports and Leisure
- 6.3.7. Other Applications
- 6.1. Market Analysis, Insights and Forecast - by Raw Material
- 7. North America EPP Foam Industry Analysis, Insights and Forecast, 2019-2031
- 7.1. Market Analysis, Insights and Forecast - by Raw Material
- 7.1.1. Synthetic Polypropylene
- 7.1.2. Bio-based Polypropylene
- 7.2. Market Analysis, Insights and Forecast - by Foam
- 7.2.1. Fabricated EPP
- 7.2.2. Molded EPP
- 7.2.3. Other Foams
- 7.3. Market Analysis, Insights and Forecast - by Application
- 7.3.1. Automotive
- 7.3.2. Dunnage
- 7.3.3. Furniture
- 7.3.4. Food Packaging
- 7.3.5. HVAC
- 7.3.6. Sports and Leisure
- 7.3.7. Other Applications
- 7.1. Market Analysis, Insights and Forecast - by Raw Material
- 8. Europe EPP Foam Industry Analysis, Insights and Forecast, 2019-2031
- 8.1. Market Analysis, Insights and Forecast - by Raw Material
- 8.1.1. Synthetic Polypropylene
- 8.1.2. Bio-based Polypropylene
- 8.2. Market Analysis, Insights and Forecast - by Foam
- 8.2.1. Fabricated EPP
- 8.2.2. Molded EPP
- 8.2.3. Other Foams
- 8.3. Market Analysis, Insights and Forecast - by Application
- 8.3.1. Automotive
- 8.3.2. Dunnage
- 8.3.3. Furniture
- 8.3.4. Food Packaging
- 8.3.5. HVAC
- 8.3.6. Sports and Leisure
- 8.3.7. Other Applications
- 8.1. Market Analysis, Insights and Forecast - by Raw Material
- 9. South America EPP Foam Industry Analysis, Insights and Forecast, 2019-2031
- 9.1. Market Analysis, Insights and Forecast - by Raw Material
- 9.1.1. Synthetic Polypropylene
- 9.1.2. Bio-based Polypropylene
- 9.2. Market Analysis, Insights and Forecast - by Foam
- 9.2.1. Fabricated EPP
- 9.2.2. Molded EPP
- 9.2.3. Other Foams
- 9.3. Market Analysis, Insights and Forecast - by Application
- 9.3.1. Automotive
- 9.3.2. Dunnage
- 9.3.3. Furniture
- 9.3.4. Food Packaging
- 9.3.5. HVAC
- 9.3.6. Sports and Leisure
- 9.3.7. Other Applications
- 9.1. Market Analysis, Insights and Forecast - by Raw Material
- 10. Middle East and Africa EPP Foam Industry Analysis, Insights and Forecast, 2019-2031
- 10.1. Market Analysis, Insights and Forecast - by Raw Material
- 10.1.1. Synthetic Polypropylene
- 10.1.2. Bio-based Polypropylene
- 10.2. Market Analysis, Insights and Forecast - by Foam
- 10.2.1. Fabricated EPP
- 10.2.2. Molded EPP
- 10.2.3. Other Foams
- 10.3. Market Analysis, Insights and Forecast - by Application
- 10.3.1. Automotive
- 10.3.2. Dunnage
- 10.3.3. Furniture
- 10.3.4. Food Packaging
- 10.3.5. HVAC
- 10.3.6. Sports and Leisure
- 10.3.7. Other Applications
- 10.1. Market Analysis, Insights and Forecast - by Raw Material
- 11. Asia Pacific EPP Foam Industry Analysis, Insights and Forecast, 2019-2031
- 11.1. Market Analysis, Insights and Forecast - By Country/Sub-region
- 11.1.1 China
- 11.1.2 India
- 11.1.3 Japan
- 11.1.4 South Korea
- 11.1.5 Rest of Asia Pacific
- 12. North America EPP Foam Industry Analysis, Insights and Forecast, 2019-2031
- 12.1. Market Analysis, Insights and Forecast - By Country/Sub-region
- 12.1.1 United States
- 12.1.2 Canada
- 12.1.3 Mexico
- 13. Europe EPP Foam Industry Analysis, Insights and Forecast, 2019-2031
- 13.1. Market Analysis, Insights and Forecast - By Country/Sub-region
- 13.1.1 Germany
- 13.1.2 United Kingdom
- 13.1.3 France
- 13.1.4 Italy
- 13.1.5 Rest of Europe
- 14. South America EPP Foam Industry Analysis, Insights and Forecast, 2019-2031
- 14.1. Market Analysis, Insights and Forecast - By Country/Sub-region
- 14.1.1 Brazil
- 14.1.2 Argentina
- 14.1.3 Rest of South America
- 15. Middle East and Africa EPP Foam Industry Analysis, Insights and Forecast, 2019-2031
- 15.1. Market Analysis, Insights and Forecast - By Country/Sub-region
- 15.1.1 Saudi Arabia
- 15.1.2 South Africa
- 15.1.3 Rest of Middle East and Africa
- 16. Competitive Analysis
- 16.1. Global Market Share Analysis 2024
- 16.2. Company Profiles
- 16.2.1 Sonoco Products Company
- 16.2.1.1. Overview
- 16.2.1.2. Products
- 16.2.1.3. SWOT Analysis
- 16.2.1.4. Recent Developments
- 16.2.1.5. Financials (Based on Availability)
- 16.2.2 Knauf Industries
- 16.2.2.1. Overview
- 16.2.2.2. Products
- 16.2.2.3. SWOT Analysis
- 16.2.2.4. Recent Developments
- 16.2.2.5. Financials (Based on Availability)
- 16.2.3 Kaneka Corporation
- 16.2.3.1. Overview
- 16.2.3.2. Products
- 16.2.3.3. SWOT Analysis
- 16.2.3.4. Recent Developments
- 16.2.3.5. Financials (Based on Availability)
- 16.2.4 Polyfoam Australia Pty Ltd
- 16.2.4.1. Overview
- 16.2.4.2. Products
- 16.2.4.3. SWOT Analysis
- 16.2.4.4. Recent Developments
- 16.2.4.5. Financials (Based on Availability)
- 16.2.5 BASF SE
- 16.2.5.1. Overview
- 16.2.5.2. Products
- 16.2.5.3. SWOT Analysis
- 16.2.5.4. Recent Developments
- 16.2.5.5. Financials (Based on Availability)
- 16.2.6 BEWi (IZOBLOK)
- 16.2.6.1. Overview
- 16.2.6.2. Products
- 16.2.6.3. SWOT Analysis
- 16.2.6.4. Recent Developments
- 16.2.6.5. Financials (Based on Availability)
- 16.2.7 K K Nag Pvt Ltd
- 16.2.7.1. Overview
- 16.2.7.2. Products
- 16.2.7.3. SWOT Analysis
- 16.2.7.4. Recent Developments
- 16.2.7.5. Financials (Based on Availability)
- 16.2.8 Clark Foam Products Corporation
- 16.2.8.1. Overview
- 16.2.8.2. Products
- 16.2.8.3. SWOT Analysis
- 16.2.8.4. Recent Developments
- 16.2.8.5. Financials (Based on Availability)
- 16.2.9 Woodbridge*List Not Exhaustive
- 16.2.9.1. Overview
- 16.2.9.2. Products
- 16.2.9.3. SWOT Analysis
- 16.2.9.4. Recent Developments
- 16.2.9.5. Financials (Based on Availability)
- 16.2.10 Signode Industrial Group Llc
- 16.2.10.1. Overview
- 16.2.10.2. Products
- 16.2.10.3. SWOT Analysis
- 16.2.10.4. Recent Developments
- 16.2.10.5. Financials (Based on Availability)
- 16.2.11 JSP
- 16.2.11.1. Overview
- 16.2.11.2. Products
- 16.2.11.3. SWOT Analysis
- 16.2.11.4. Recent Developments
- 16.2.11.5. Financials (Based on Availability)
- 16.2.12 Hanwha Solutions
- 16.2.12.1. Overview
- 16.2.12.2. Products
- 16.2.12.3. SWOT Analysis
- 16.2.12.4. Recent Developments
- 16.2.12.5. Financials (Based on Availability)
- 16.2.1 Sonoco Products Company
List of Figures
- Figure 1: Global EPP Foam Industry Revenue Breakdown (Million, %) by Region 2024 & 2032
- Figure 2: Asia Pacific EPP Foam Industry Revenue (Million), by Country 2024 & 2032
- Figure 3: Asia Pacific EPP Foam Industry Revenue Share (%), by Country 2024 & 2032
- Figure 4: North America EPP Foam Industry Revenue (Million), by Country 2024 & 2032
- Figure 5: North America EPP Foam Industry Revenue Share (%), by Country 2024 & 2032
- Figure 6: Europe EPP Foam Industry Revenue (Million), by Country 2024 & 2032
- Figure 7: Europe EPP Foam Industry Revenue Share (%), by Country 2024 & 2032
- Figure 8: South America EPP Foam Industry Revenue (Million), by Country 2024 & 2032
- Figure 9: South America EPP Foam Industry Revenue Share (%), by Country 2024 & 2032
- Figure 10: Middle East and Africa EPP Foam Industry Revenue (Million), by Country 2024 & 2032
- Figure 11: Middle East and Africa EPP Foam Industry Revenue Share (%), by Country 2024 & 2032
- Figure 12: Asia Pacific EPP Foam Industry Revenue (Million), by Raw Material 2024 & 2032
- Figure 13: Asia Pacific EPP Foam Industry Revenue Share (%), by Raw Material 2024 & 2032
- Figure 14: Asia Pacific EPP Foam Industry Revenue (Million), by Foam 2024 & 2032
- Figure 15: Asia Pacific EPP Foam Industry Revenue Share (%), by Foam 2024 & 2032
- Figure 16: Asia Pacific EPP Foam Industry Revenue (Million), by Application 2024 & 2032
- Figure 17: Asia Pacific EPP Foam Industry Revenue Share (%), by Application 2024 & 2032
- Figure 18: Asia Pacific EPP Foam Industry Revenue (Million), by Country 2024 & 2032
- Figure 19: Asia Pacific EPP Foam Industry Revenue Share (%), by Country 2024 & 2032
- Figure 20: North America EPP Foam Industry Revenue (Million), by Raw Material 2024 & 2032
- Figure 21: North America EPP Foam Industry Revenue Share (%), by Raw Material 2024 & 2032
- Figure 22: North America EPP Foam Industry Revenue (Million), by Foam 2024 & 2032
- Figure 23: North America EPP Foam Industry Revenue Share (%), by Foam 2024 & 2032
- Figure 24: North America EPP Foam Industry Revenue (Million), by Application 2024 & 2032
- Figure 25: North America EPP Foam Industry Revenue Share (%), by Application 2024 & 2032
- Figure 26: North America EPP Foam Industry Revenue (Million), by Country 2024 & 2032
- Figure 27: North America EPP Foam Industry Revenue Share (%), by Country 2024 & 2032
- Figure 28: Europe EPP Foam Industry Revenue (Million), by Raw Material 2024 & 2032
- Figure 29: Europe EPP Foam Industry Revenue Share (%), by Raw Material 2024 & 2032
- Figure 30: Europe EPP Foam Industry Revenue (Million), by Foam 2024 & 2032
- Figure 31: Europe EPP Foam Industry Revenue Share (%), by Foam 2024 & 2032
- Figure 32: Europe EPP Foam Industry Revenue (Million), by Application 2024 & 2032
- Figure 33: Europe EPP Foam Industry Revenue Share (%), by Application 2024 & 2032
- Figure 34: Europe EPP Foam Industry Revenue (Million), by Country 2024 & 2032
- Figure 35: Europe EPP Foam Industry Revenue Share (%), by Country 2024 & 2032
- Figure 36: South America EPP Foam Industry Revenue (Million), by Raw Material 2024 & 2032
- Figure 37: South America EPP Foam Industry Revenue Share (%), by Raw Material 2024 & 2032
- Figure 38: South America EPP Foam Industry Revenue (Million), by Foam 2024 & 2032
- Figure 39: South America EPP Foam Industry Revenue Share (%), by Foam 2024 & 2032
- Figure 40: South America EPP Foam Industry Revenue (Million), by Application 2024 & 2032
- Figure 41: South America EPP Foam Industry Revenue Share (%), by Application 2024 & 2032
- Figure 42: South America EPP Foam Industry Revenue (Million), by Country 2024 & 2032
- Figure 43: South America EPP Foam Industry Revenue Share (%), by Country 2024 & 2032
- Figure 44: Middle East and Africa EPP Foam Industry Revenue (Million), by Raw Material 2024 & 2032
- Figure 45: Middle East and Africa EPP Foam Industry Revenue Share (%), by Raw Material 2024 & 2032
- Figure 46: Middle East and Africa EPP Foam Industry Revenue (Million), by Foam 2024 & 2032
- Figure 47: Middle East and Africa EPP Foam Industry Revenue Share (%), by Foam 2024 & 2032
- Figure 48: Middle East and Africa EPP Foam Industry Revenue (Million), by Application 2024 & 2032
- Figure 49: Middle East and Africa EPP Foam Industry Revenue Share (%), by Application 2024 & 2032
- Figure 50: Middle East and Africa EPP Foam Industry Revenue (Million), by Country 2024 & 2032
- Figure 51: Middle East and Africa EPP Foam Industry Revenue Share (%), by Country 2024 & 2032
List of Tables
- Table 1: Global EPP Foam Industry Revenue Million Forecast, by Region 2019 & 2032
- Table 2: Global EPP Foam Industry Revenue Million Forecast, by Raw Material 2019 & 2032
- Table 3: Global EPP Foam Industry Revenue Million Forecast, by Foam 2019 & 2032
- Table 4: Global EPP Foam Industry Revenue Million Forecast, by Application 2019 & 2032
- Table 5: Global EPP Foam Industry Revenue Million Forecast, by Region 2019 & 2032
- Table 6: Global EPP Foam Industry Revenue Million Forecast, by Country 2019 & 2032
- Table 7: China EPP Foam Industry Revenue (Million) Forecast, by Application 2019 & 2032
- Table 8: India EPP Foam Industry Revenue (Million) Forecast, by Application 2019 & 2032
- Table 9: Japan EPP Foam Industry Revenue (Million) Forecast, by Application 2019 & 2032
- Table 10: South Korea EPP Foam Industry Revenue (Million) Forecast, by Application 2019 & 2032
- Table 11: Rest of Asia Pacific EPP Foam Industry Revenue (Million) Forecast, by Application 2019 & 2032
- Table 12: Global EPP Foam Industry Revenue Million Forecast, by Country 2019 & 2032
- Table 13: United States EPP Foam Industry Revenue (Million) Forecast, by Application 2019 & 2032
- Table 14: Canada EPP Foam Industry Revenue (Million) Forecast, by Application 2019 & 2032
- Table 15: Mexico EPP Foam Industry Revenue (Million) Forecast, by Application 2019 & 2032
- Table 16: Global EPP Foam Industry Revenue Million Forecast, by Country 2019 & 2032
- Table 17: Germany EPP Foam Industry Revenue (Million) Forecast, by Application 2019 & 2032
- Table 18: United Kingdom EPP Foam Industry Revenue (Million) Forecast, by Application 2019 & 2032
- Table 19: France EPP Foam Industry Revenue (Million) Forecast, by Application 2019 & 2032
- Table 20: Italy EPP Foam Industry Revenue (Million) Forecast, by Application 2019 & 2032
- Table 21: Rest of Europe EPP Foam Industry Revenue (Million) Forecast, by Application 2019 & 2032
- Table 22: Global EPP Foam Industry Revenue Million Forecast, by Country 2019 & 2032
- Table 23: Brazil EPP Foam Industry Revenue (Million) Forecast, by Application 2019 & 2032
- Table 24: Argentina EPP Foam Industry Revenue (Million) Forecast, by Application 2019 & 2032
- Table 25: Rest of South America EPP Foam Industry Revenue (Million) Forecast, by Application 2019 & 2032
- Table 26: Global EPP Foam Industry Revenue Million Forecast, by Country 2019 & 2032
- Table 27: Saudi Arabia EPP Foam Industry Revenue (Million) Forecast, by Application 2019 & 2032
- Table 28: South Africa EPP Foam Industry Revenue (Million) Forecast, by Application 2019 & 2032
- Table 29: Rest of Middle East and Africa EPP Foam Industry Revenue (Million) Forecast, by Application 2019 & 2032
- Table 30: Global EPP Foam Industry Revenue Million Forecast, by Raw Material 2019 & 2032
- Table 31: Global EPP Foam Industry Revenue Million Forecast, by Foam 2019 & 2032
- Table 32: Global EPP Foam Industry Revenue Million Forecast, by Application 2019 & 2032
- Table 33: Global EPP Foam Industry Revenue Million Forecast, by Country 2019 & 2032
- Table 34: China EPP Foam Industry Revenue (Million) Forecast, by Application 2019 & 2032
- Table 35: India EPP Foam Industry Revenue (Million) Forecast, by Application 2019 & 2032
- Table 36: Japan EPP Foam Industry Revenue (Million) Forecast, by Application 2019 & 2032
- Table 37: South Korea EPP Foam Industry Revenue (Million) Forecast, by Application 2019 & 2032
- Table 38: Rest of Asia Pacific EPP Foam Industry Revenue (Million) Forecast, by Application 2019 & 2032
- Table 39: Global EPP Foam Industry Revenue Million Forecast, by Raw Material 2019 & 2032
- Table 40: Global EPP Foam Industry Revenue Million Forecast, by Foam 2019 & 2032
- Table 41: Global EPP Foam Industry Revenue Million Forecast, by Application 2019 & 2032
- Table 42: Global EPP Foam Industry Revenue Million Forecast, by Country 2019 & 2032
- Table 43: United States EPP Foam Industry Revenue (Million) Forecast, by Application 2019 & 2032
- Table 44: Canada EPP Foam Industry Revenue (Million) Forecast, by Application 2019 & 2032
- Table 45: Mexico EPP Foam Industry Revenue (Million) Forecast, by Application 2019 & 2032
- Table 46: Global EPP Foam Industry Revenue Million Forecast, by Raw Material 2019 & 2032
- Table 47: Global EPP Foam Industry Revenue Million Forecast, by Foam 2019 & 2032
- Table 48: Global EPP Foam Industry Revenue Million Forecast, by Application 2019 & 2032
- Table 49: Global EPP Foam Industry Revenue Million Forecast, by Country 2019 & 2032
- Table 50: Germany EPP Foam Industry Revenue (Million) Forecast, by Application 2019 & 2032
- Table 51: United Kingdom EPP Foam Industry Revenue (Million) Forecast, by Application 2019 & 2032
- Table 52: France EPP Foam Industry Revenue (Million) Forecast, by Application 2019 & 2032
- Table 53: Italy EPP Foam Industry Revenue (Million) Forecast, by Application 2019 & 2032
- Table 54: Rest of Europe EPP Foam Industry Revenue (Million) Forecast, by Application 2019 & 2032
- Table 55: Global EPP Foam Industry Revenue Million Forecast, by Raw Material 2019 & 2032
- Table 56: Global EPP Foam Industry Revenue Million Forecast, by Foam 2019 & 2032
- Table 57: Global EPP Foam Industry Revenue Million Forecast, by Application 2019 & 2032
- Table 58: Global EPP Foam Industry Revenue Million Forecast, by Country 2019 & 2032
- Table 59: Brazil EPP Foam Industry Revenue (Million) Forecast, by Application 2019 & 2032
- Table 60: Argentina EPP Foam Industry Revenue (Million) Forecast, by Application 2019 & 2032
- Table 61: Rest of South America EPP Foam Industry Revenue (Million) Forecast, by Application 2019 & 2032
- Table 62: Global EPP Foam Industry Revenue Million Forecast, by Raw Material 2019 & 2032
- Table 63: Global EPP Foam Industry Revenue Million Forecast, by Foam 2019 & 2032
- Table 64: Global EPP Foam Industry Revenue Million Forecast, by Application 2019 & 2032
- Table 65: Global EPP Foam Industry Revenue Million Forecast, by Country 2019 & 2032
- Table 66: Saudi Arabia EPP Foam Industry Revenue (Million) Forecast, by Application 2019 & 2032
- Table 67: South Africa EPP Foam Industry Revenue (Million) Forecast, by Application 2019 & 2032
- Table 68: Rest of Middle East and Africa EPP Foam Industry Revenue (Million) Forecast, by Application 2019 & 2032
Frequently Asked Questions
1. What is the projected Compound Annual Growth Rate (CAGR) of the EPP Foam Industry?
The projected CAGR is approximately 7.21%.
2. Which companies are prominent players in the EPP Foam Industry?
Key companies in the market include Sonoco Products Company, Knauf Industries, Kaneka Corporation, Polyfoam Australia Pty Ltd, BASF SE, BEWi (IZOBLOK), K K Nag Pvt Ltd, Clark Foam Products Corporation, Woodbridge*List Not Exhaustive, Signode Industrial Group Llc, JSP, Hanwha Solutions.
3. What are the main segments of the EPP Foam Industry?
The market segments include Raw Material, Foam, Application.
4. Can you provide details about the market size?
The market size is estimated to be USD 469.83 Million as of 2022.
5. What are some drivers contributing to market growth?
Non-toxic and Recyclable Nature of the Material; Rising Demand from the Packaging Industry.
6. What are the notable trends driving market growth?
Increasing Usage in the Automotive Industry.
7. Are there any restraints impacting market growth?
Declining Automobile Industry Through Previous Years; Higher Price Among Other Structural Foams.
8. Can you provide examples of recent developments in the market?
March 2022: Hanwha Solutions has announced that the company is set to split off its advanced materials business and sell a stake in the unit to raise USD 491 million for investments at home and abroad. The sell-off was considered first in November 2021. Private equity firm Glenwood PE has planned to buy a 49% stake in the division for KRW 600 billion (USD 491.4 million), becoming its second-largest shareholder after Hanwha.
9. What pricing options are available for accessing the report?
Pricing options include single-user, multi-user, and enterprise licenses priced at USD 4750, USD 5250, and USD 8750 respectively.
10. Is the market size provided in terms of value or volume?
The market size is provided in terms of value, measured in Million.
11. Are there any specific market keywords associated with the report?
Yes, the market keyword associated with the report is "EPP Foam Industry," which aids in identifying and referencing the specific market segment covered.
12. How do I determine which pricing option suits my needs best?
The pricing options vary based on user requirements and access needs. Individual users may opt for single-user licenses, while businesses requiring broader access may choose multi-user or enterprise licenses for cost-effective access to the report.
13. Are there any additional resources or data provided in the EPP Foam Industry report?
While the report offers comprehensive insights, it's advisable to review the specific contents or supplementary materials provided to ascertain if additional resources or data are available.
14. How can I stay updated on further developments or reports in the EPP Foam Industry?
To stay informed about further developments, trends, and reports in the EPP Foam Industry, consider subscribing to industry newsletters, following relevant companies and organizations, or regularly checking reputable industry news sources and publications.
Methodology
Step 1 - Identification of Relevant Samples Size from Population Database


Step 2 - Approaches for Defining Global Market Size (Value, Volume* & Price*)

Note*: In applicable scenarios
Step 3 - Data Sources
Primary Research
- Web Analytics
- Survey Reports
- Research Institute
- Latest Research Reports
- Opinion Leaders
Secondary Research
- Annual Reports
- White Paper
- Latest Press Release
- Industry Association
- Paid Database
- Investor Presentations

Step 4 - Data Triangulation
Involves using different sources of information in order to increase the validity of a study
These sources are likely to be stakeholders in a program - participants, other researchers, program staff, other community members, and so on.
Then we put all data in single framework & apply various statistical tools to find out the dynamic on the market.
During the analysis stage, feedback from the stakeholder groups would be compared to determine areas of agreement as well as areas of divergence
