

Key Insights
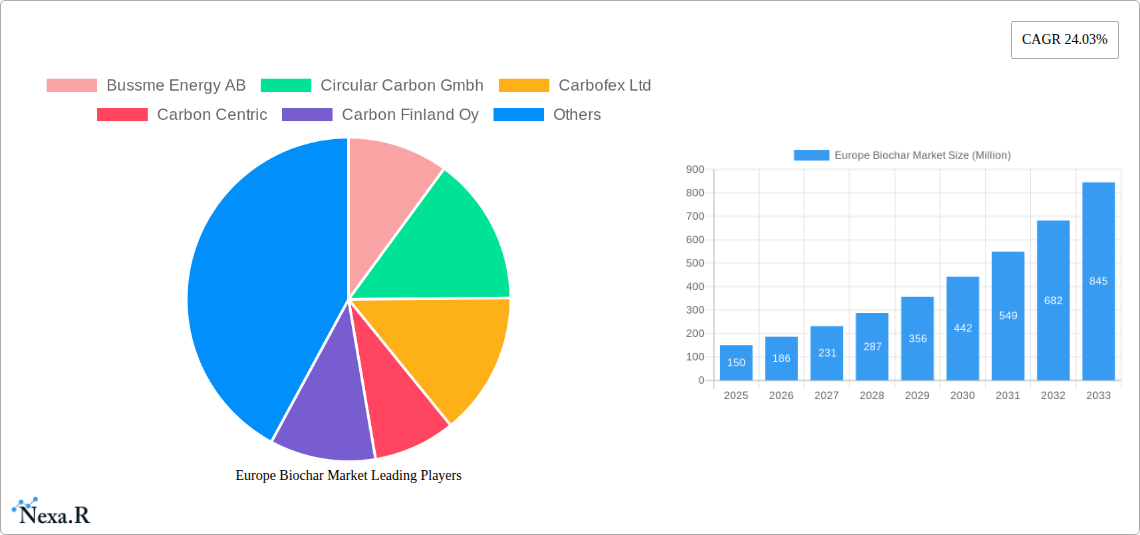
The European biochar market is experiencing robust growth, projected to expand significantly over the forecast period (2025-2033). A Compound Annual Growth Rate (CAGR) of 24.03% indicates a dynamic market driven by several key factors. Increasing environmental concerns, particularly regarding soil health and carbon sequestration, are fueling demand for biochar as a sustainable soil amendment. Furthermore, the growing adoption of biochar in various applications, including agriculture (enhancing soil fertility and water retention), wastewater treatment (improving pollutant removal), and even as a component in construction materials, contributes to this market expansion. Regulations promoting sustainable practices and renewable resources within the European Union further bolster the market's trajectory. While data on specific market size is unavailable, based on the provided CAGR and considering comparable markets, we can infer a substantial market valuation, likely in the hundreds of millions of Euros by 2033. The competitive landscape is relatively fragmented, with numerous companies like Bussme Energy AB, Circular Carbon GmbH, and Carbofex Ltd contributing to the market's dynamism through innovation and expansion into new applications. However, challenges such as the high production costs of biochar and the need for wider consumer awareness and acceptance may present certain restraints to the market’s growth.
The market segmentation within Europe will likely reflect the varied applications of biochar. Agriculture will probably represent the largest segment, given the widespread use of biochar as a soil amendment. Other significant segments might include industrial applications (e.g., construction materials) and environmental remediation (e.g., wastewater treatment). Regional variations in market penetration will exist, with countries demonstrating strong commitment to environmental sustainability and possessing readily available biomass feedstocks likely leading the market growth within Europe. Future growth will depend on technological advancements reducing production costs, effective policy support from governments, and increasing awareness among consumers and businesses about the multiple benefits of biochar. Further research into specific regional data and market segment sizes would provide a more granular understanding of the market dynamics within Europe.
Europe Biochar Market: A Comprehensive Market Report (2019-2033)
This in-depth report provides a comprehensive analysis of the Europe biochar market, encompassing market dynamics, growth trends, regional analysis, product landscape, key players, and future outlook. The report covers the period from 2019 to 2033, with a focus on the forecast period of 2025-2033 and a base year of 2025. The analysis leverages extensive primary and secondary research to deliver actionable insights for industry professionals, investors, and stakeholders. The European biochar market, a vital sub-segment within the broader global biochar market, is experiencing significant growth driven by increasing environmental concerns and supportive government policies. This report delves deep into this burgeoning sector, providing a granular view of its current state and future trajectory.
Europe Biochar Market Dynamics & Structure
The European biochar market is characterized by moderate concentration, with several key players vying for market share. Technological innovation, particularly in biochar production methods and applications, is a significant driver. Stringent environmental regulations across Europe are creating a favorable landscape for biochar adoption, while the availability of sustainable feedstock also plays a pivotal role. Competition from alternative soil amendments and carbon sequestration methods presents a challenge. The market exhibits diverse end-user demographics, including agriculture, horticulture, and environmental remediation sectors. Recent years have witnessed a moderate number of M&A activities, indicating a consolidation trend within the industry.
- Market Concentration: Moderately concentrated, with top 5 players holding approximately xx% market share (2024).
- Technological Innovation: Focus on improving production efficiency, enhancing biochar quality, and expanding applications. Key barriers include high initial investment costs and lack of standardized quality control.
- Regulatory Framework: Supportive policies promoting sustainable agriculture and carbon sequestration are driving growth.
- Competitive Substitutes: Compost, peat, and other soil amendments pose competition.
- End-User Demographics: Agriculture (xx%), horticulture (xx%), environmental remediation (xx%), other (xx%).
- M&A Trends: Moderate level of mergers and acquisitions, with an average of xx deals per year in the historical period.
Europe Biochar Market Growth Trends & Insights
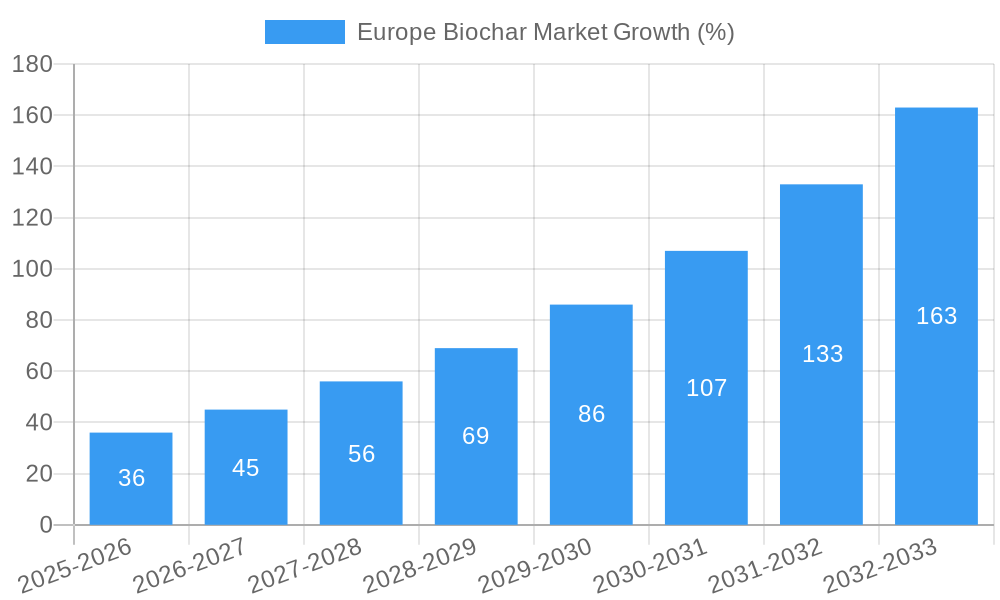
The European biochar market is exhibiting robust growth, driven by increasing awareness of its environmental benefits and supportive government policies. Market size has expanded significantly from xx million in 2019 to an estimated xx million in 2025, projecting a CAGR of xx% during the forecast period (2025-2033). Adoption rates are increasing across various sectors, particularly in agriculture and environmental remediation. Technological advancements are leading to cost reductions and improved biochar quality, further fueling market expansion. Consumer behavior is shifting towards sustainable and eco-friendly products, creating a strong demand for biochar.
Dominant Regions, Countries, or Segments in Europe Biochar Market
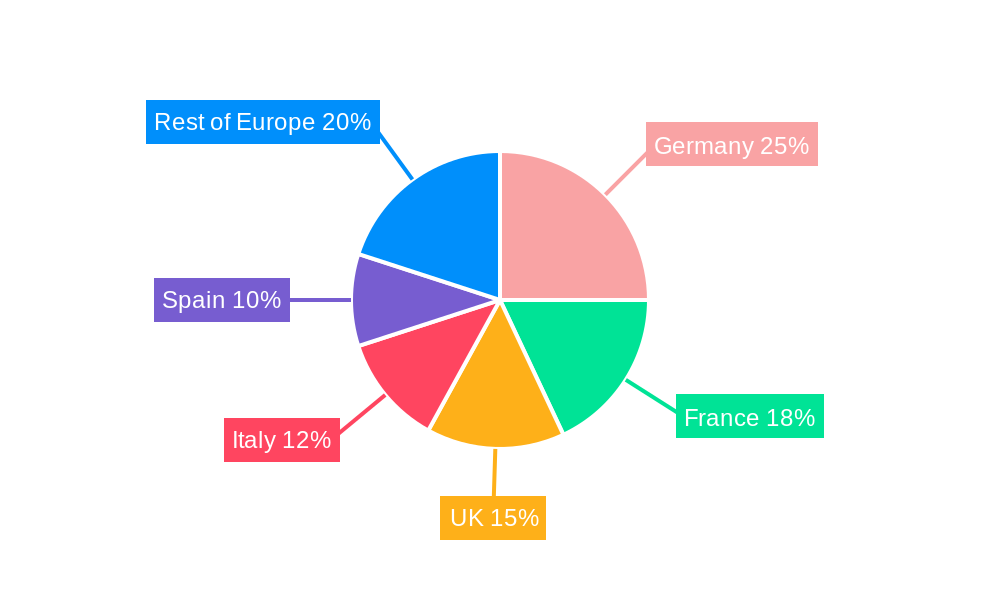
Germany, followed by France and the UK, are the leading markets in Europe for biochar, driven by strong government support for renewable energy and sustainable agriculture. These countries benefit from well-established agricultural sectors and readily available biomass feedstock. Specific regions within these countries, characterized by high agricultural activity and favorable policies, exhibit even higher growth rates. The agricultural segment holds the largest market share due to the widespread adoption of biochar as a soil amendment to improve soil health and carbon sequestration.
- Key Drivers:
- Supportive government policies: Subsidies, tax incentives, and carbon credit schemes.
- Strong agricultural sector: High demand for soil amendments and sustainable farming practices.
- Availability of biomass feedstock: Abundant agricultural and forestry residues.
- Growing environmental awareness: Increased focus on carbon sequestration and soil health.
Europe Biochar Market Product Landscape
The European biochar market offers a range of biochar products tailored to diverse applications. Key product differentiators include particle size, porosity, and carbon content, impacting performance in different sectors. Recent innovations focus on enhancing biochar production efficiency and developing specialized biochar types for specific applications, such as enhanced nutrient retention or targeted water management. These advancements enhance the biochar's unique selling propositions and boost its adoption.
Key Drivers, Barriers & Challenges in Europe Biochar Market
Key Drivers: Growing environmental concerns, increasing demand for sustainable agriculture, supportive government policies promoting carbon sequestration and renewable energy, and advancements in biochar production technologies.
Key Challenges: High production costs, lack of standardized quality control, inconsistent supply chains, and competition from existing soil amendments. Regulatory hurdles in specific regions also hinder market expansion. The competitive landscape presents a further challenge, with existing players and new entrants vying for market share. These factors combined can significantly impact market growth rates.
Emerging Opportunities in Europe Biochar Market
Emerging opportunities include the expansion of biochar applications in water treatment and industrial processes, development of specialized biochar products for specific needs, exploration of untapped markets in Eastern Europe, and the rise of innovative business models focused on carbon credits and circular economy principles. The growing awareness of biochar's role in carbon sequestration offers a significant potential for market expansion.
Growth Accelerators in the Europe Biochar Market Industry
Technological breakthroughs in efficient biochar production, strategic partnerships between biochar producers and end-users, and expansion into new applications are key growth catalysts. Government initiatives promoting sustainable agriculture and carbon neutrality will further accelerate market growth. Investments in research and development are crucial for overcoming current challenges and unlocking the full potential of the biochar market.
Key Players Shaping the Europe Biochar Market Market
- Bussme Energy AB
- Circular Carbon GmbH
- Carbofex Ltd
- Carbon Centric
- Carbon Finland Oy
- Carbon Gold Ltd
- Carbuna
- Charline GmbH
- Egos GmbH
- Eoc Energy Ocean
- Lucrat GmbH
- Nettenergy BV
- Novocarbo GmbH
- Sonnenerde GmbH
- Verora AG
- List Not Exhaustive
Notable Milestones in Europe Biochar Market Sector
- October 2022: Sonnenerde announced the construction of its first industrial biochar production plant in Europe, boosting its product portfolio.
- November 2022: Novocarbo GmbH and ThyssenKrupp launched a new decarbonization plant in Germany, producing regenerative heat and biochar.
- November 2023: Novocarbo opened Germany's largest carbon removal park, a significant step in its biochar carbon removal strategy.
- March 2024: Novocarbo secured EUR 25 million (USD 27 million) to build 200 carbon removal parks in Europe by 2033, expanding its CCS and green heat network.
In-Depth Europe Biochar Market Market Outlook
The future of the European biochar market is bright, driven by sustained growth in demand for sustainable solutions and continuous technological advancements. Strategic partnerships, coupled with supportive policy frameworks, will unlock new market segments and applications. The potential for carbon credit generation and integration into circular economy initiatives presents significant long-term opportunities, promising substantial market expansion and increased investor interest in the coming years.
Europe Biochar Market Segmentation
-
1. Technology
- 1.1. Pyrolysis
- 1.2. Gasification Systems
- 1.3. Other Technologies
-
2. Application
- 2.1. Agriculture
- 2.2. Animal Farming
- 2.3. Industrial Uses
- 2.4. Other Applications
Europe Biochar Market Segmentation By Geography
- 1. Germany
- 2. United Kingdom
- 3. France
- 4. Italy
- 5. Spain
- 6. Nordic
- 7. Turkey
- 8. Russia
- 9. Rest of Europe
Europe Biochar Market REPORT HIGHLIGHTS
| Aspects | Details |
|---|---|
| Study Period | 2019-2033 |
| Base Year | 2024 |
| Estimated Year | 2025 |
| Forecast Period | 2025-2033 |
| Historical Period | 2019-2024 |
| Growth Rate | CAGR of 24.03% from 2019-2033 |
| Segmentation |
|
Table of Contents
- 1. Introduction
- 1.1. Research Scope
- 1.2. Market Segmentation
- 1.3. Research Methodology
- 1.4. Definitions and Assumptions
- 2. Executive Summary
- 2.1. Introduction
- 3. Market Dynamics
- 3.1. Introduction
- 3.2. Market Drivers
- 3.2.1. Increasing Demand for Organic Farming in the Agricultural Industry; Increasing Focus on the Waste Management Sector; Others
- 3.3. Market Restrains
- 3.3.1. Increasing Demand for Organic Farming in the Agricultural Industry; Increasing Focus on the Waste Management Sector; Others
- 3.4. Market Trends
- 3.4.1. Increasing Demand from the Agricultural Industry
- 4. Market Factor Analysis
- 4.1. Porters Five Forces
- 4.2. Supply/Value Chain
- 4.3. PESTEL analysis
- 4.4. Market Entropy
- 4.5. Patent/Trademark Analysis
- 5. Global Europe Biochar Market Analysis, Insights and Forecast, 2019-2031
- 5.1. Market Analysis, Insights and Forecast - by Technology
- 5.1.1. Pyrolysis
- 5.1.2. Gasification Systems
- 5.1.3. Other Technologies
- 5.2. Market Analysis, Insights and Forecast - by Application
- 5.2.1. Agriculture
- 5.2.2. Animal Farming
- 5.2.3. Industrial Uses
- 5.2.4. Other Applications
- 5.3. Market Analysis, Insights and Forecast - by Region
- 5.3.1. Germany
- 5.3.2. United Kingdom
- 5.3.3. France
- 5.3.4. Italy
- 5.3.5. Spain
- 5.3.6. Nordic
- 5.3.7. Turkey
- 5.3.8. Russia
- 5.3.9. Rest of Europe
- 5.1. Market Analysis, Insights and Forecast - by Technology
- 6. Germany Europe Biochar Market Analysis, Insights and Forecast, 2019-2031
- 6.1. Market Analysis, Insights and Forecast - by Technology
- 6.1.1. Pyrolysis
- 6.1.2. Gasification Systems
- 6.1.3. Other Technologies
- 6.2. Market Analysis, Insights and Forecast - by Application
- 6.2.1. Agriculture
- 6.2.2. Animal Farming
- 6.2.3. Industrial Uses
- 6.2.4. Other Applications
- 6.1. Market Analysis, Insights and Forecast - by Technology
- 7. United Kingdom Europe Biochar Market Analysis, Insights and Forecast, 2019-2031
- 7.1. Market Analysis, Insights and Forecast - by Technology
- 7.1.1. Pyrolysis
- 7.1.2. Gasification Systems
- 7.1.3. Other Technologies
- 7.2. Market Analysis, Insights and Forecast - by Application
- 7.2.1. Agriculture
- 7.2.2. Animal Farming
- 7.2.3. Industrial Uses
- 7.2.4. Other Applications
- 7.1. Market Analysis, Insights and Forecast - by Technology
- 8. France Europe Biochar Market Analysis, Insights and Forecast, 2019-2031
- 8.1. Market Analysis, Insights and Forecast - by Technology
- 8.1.1. Pyrolysis
- 8.1.2. Gasification Systems
- 8.1.3. Other Technologies
- 8.2. Market Analysis, Insights and Forecast - by Application
- 8.2.1. Agriculture
- 8.2.2. Animal Farming
- 8.2.3. Industrial Uses
- 8.2.4. Other Applications
- 8.1. Market Analysis, Insights and Forecast - by Technology
- 9. Italy Europe Biochar Market Analysis, Insights and Forecast, 2019-2031
- 9.1. Market Analysis, Insights and Forecast - by Technology
- 9.1.1. Pyrolysis
- 9.1.2. Gasification Systems
- 9.1.3. Other Technologies
- 9.2. Market Analysis, Insights and Forecast - by Application
- 9.2.1. Agriculture
- 9.2.2. Animal Farming
- 9.2.3. Industrial Uses
- 9.2.4. Other Applications
- 9.1. Market Analysis, Insights and Forecast - by Technology
- 10. Spain Europe Biochar Market Analysis, Insights and Forecast, 2019-2031
- 10.1. Market Analysis, Insights and Forecast - by Technology
- 10.1.1. Pyrolysis
- 10.1.2. Gasification Systems
- 10.1.3. Other Technologies
- 10.2. Market Analysis, Insights and Forecast - by Application
- 10.2.1. Agriculture
- 10.2.2. Animal Farming
- 10.2.3. Industrial Uses
- 10.2.4. Other Applications
- 10.1. Market Analysis, Insights and Forecast - by Technology
- 11. Nordic Europe Biochar Market Analysis, Insights and Forecast, 2019-2031
- 11.1. Market Analysis, Insights and Forecast - by Technology
- 11.1.1. Pyrolysis
- 11.1.2. Gasification Systems
- 11.1.3. Other Technologies
- 11.2. Market Analysis, Insights and Forecast - by Application
- 11.2.1. Agriculture
- 11.2.2. Animal Farming
- 11.2.3. Industrial Uses
- 11.2.4. Other Applications
- 11.1. Market Analysis, Insights and Forecast - by Technology
- 12. Turkey Europe Biochar Market Analysis, Insights and Forecast, 2019-2031
- 12.1. Market Analysis, Insights and Forecast - by Technology
- 12.1.1. Pyrolysis
- 12.1.2. Gasification Systems
- 12.1.3. Other Technologies
- 12.2. Market Analysis, Insights and Forecast - by Application
- 12.2.1. Agriculture
- 12.2.2. Animal Farming
- 12.2.3. Industrial Uses
- 12.2.4. Other Applications
- 12.1. Market Analysis, Insights and Forecast - by Technology
- 13. Russia Europe Biochar Market Analysis, Insights and Forecast, 2019-2031
- 13.1. Market Analysis, Insights and Forecast - by Technology
- 13.1.1. Pyrolysis
- 13.1.2. Gasification Systems
- 13.1.3. Other Technologies
- 13.2. Market Analysis, Insights and Forecast - by Application
- 13.2.1. Agriculture
- 13.2.2. Animal Farming
- 13.2.3. Industrial Uses
- 13.2.4. Other Applications
- 13.1. Market Analysis, Insights and Forecast - by Technology
- 14. Rest of Europe Europe Biochar Market Analysis, Insights and Forecast, 2019-2031
- 14.1. Market Analysis, Insights and Forecast - by Technology
- 14.1.1. Pyrolysis
- 14.1.2. Gasification Systems
- 14.1.3. Other Technologies
- 14.2. Market Analysis, Insights and Forecast - by Application
- 14.2.1. Agriculture
- 14.2.2. Animal Farming
- 14.2.3. Industrial Uses
- 14.2.4. Other Applications
- 14.1. Market Analysis, Insights and Forecast - by Technology
- 15. Competitive Analysis
- 15.1. Global Market Share Analysis 2024
- 15.2. Company Profiles
- 15.2.1 Bussme Energy AB
- 15.2.1.1. Overview
- 15.2.1.2. Products
- 15.2.1.3. SWOT Analysis
- 15.2.1.4. Recent Developments
- 15.2.1.5. Financials (Based on Availability)
- 15.2.2 Circular Carbon Gmbh
- 15.2.2.1. Overview
- 15.2.2.2. Products
- 15.2.2.3. SWOT Analysis
- 15.2.2.4. Recent Developments
- 15.2.2.5. Financials (Based on Availability)
- 15.2.3 Carbofex Ltd
- 15.2.3.1. Overview
- 15.2.3.2. Products
- 15.2.3.3. SWOT Analysis
- 15.2.3.4. Recent Developments
- 15.2.3.5. Financials (Based on Availability)
- 15.2.4 Carbon Centric
- 15.2.4.1. Overview
- 15.2.4.2. Products
- 15.2.4.3. SWOT Analysis
- 15.2.4.4. Recent Developments
- 15.2.4.5. Financials (Based on Availability)
- 15.2.5 Carbon Finland Oy
- 15.2.5.1. Overview
- 15.2.5.2. Products
- 15.2.5.3. SWOT Analysis
- 15.2.5.4. Recent Developments
- 15.2.5.5. Financials (Based on Availability)
- 15.2.6 Carbon Gold Ltd
- 15.2.6.1. Overview
- 15.2.6.2. Products
- 15.2.6.3. SWOT Analysis
- 15.2.6.4. Recent Developments
- 15.2.6.5. Financials (Based on Availability)
- 15.2.7 Carbuna
- 15.2.7.1. Overview
- 15.2.7.2. Products
- 15.2.7.3. SWOT Analysis
- 15.2.7.4. Recent Developments
- 15.2.7.5. Financials (Based on Availability)
- 15.2.8 Charline Gmbh
- 15.2.8.1. Overview
- 15.2.8.2. Products
- 15.2.8.3. SWOT Analysis
- 15.2.8.4. Recent Developments
- 15.2.8.5. Financials (Based on Availability)
- 15.2.9 Egos Gmbh
- 15.2.9.1. Overview
- 15.2.9.2. Products
- 15.2.9.3. SWOT Analysis
- 15.2.9.4. Recent Developments
- 15.2.9.5. Financials (Based on Availability)
- 15.2.10 Eoc Energy Ocean
- 15.2.10.1. Overview
- 15.2.10.2. Products
- 15.2.10.3. SWOT Analysis
- 15.2.10.4. Recent Developments
- 15.2.10.5. Financials (Based on Availability)
- 15.2.11 Lucrat Gmbh
- 15.2.11.1. Overview
- 15.2.11.2. Products
- 15.2.11.3. SWOT Analysis
- 15.2.11.4. Recent Developments
- 15.2.11.5. Financials (Based on Availability)
- 15.2.12 Nettenergy BV
- 15.2.12.1. Overview
- 15.2.12.2. Products
- 15.2.12.3. SWOT Analysis
- 15.2.12.4. Recent Developments
- 15.2.12.5. Financials (Based on Availability)
- 15.2.13 Novocarbo Gmbh
- 15.2.13.1. Overview
- 15.2.13.2. Products
- 15.2.13.3. SWOT Analysis
- 15.2.13.4. Recent Developments
- 15.2.13.5. Financials (Based on Availability)
- 15.2.14 Sonnenerde Gmbh
- 15.2.14.1. Overview
- 15.2.14.2. Products
- 15.2.14.3. SWOT Analysis
- 15.2.14.4. Recent Developments
- 15.2.14.5. Financials (Based on Availability)
- 15.2.15 Verora AG*List Not Exhaustive
- 15.2.15.1. Overview
- 15.2.15.2. Products
- 15.2.15.3. SWOT Analysis
- 15.2.15.4. Recent Developments
- 15.2.15.5. Financials (Based on Availability)
- 15.2.1 Bussme Energy AB
List of Figures
- Figure 1: Global Europe Biochar Market Revenue Breakdown (Million, %) by Region 2024 & 2032
- Figure 2: Germany Europe Biochar Market Revenue (Million), by Technology 2024 & 2032
- Figure 3: Germany Europe Biochar Market Revenue Share (%), by Technology 2024 & 2032
- Figure 4: Germany Europe Biochar Market Revenue (Million), by Application 2024 & 2032
- Figure 5: Germany Europe Biochar Market Revenue Share (%), by Application 2024 & 2032
- Figure 6: Germany Europe Biochar Market Revenue (Million), by Country 2024 & 2032
- Figure 7: Germany Europe Biochar Market Revenue Share (%), by Country 2024 & 2032
- Figure 8: United Kingdom Europe Biochar Market Revenue (Million), by Technology 2024 & 2032
- Figure 9: United Kingdom Europe Biochar Market Revenue Share (%), by Technology 2024 & 2032
- Figure 10: United Kingdom Europe Biochar Market Revenue (Million), by Application 2024 & 2032
- Figure 11: United Kingdom Europe Biochar Market Revenue Share (%), by Application 2024 & 2032
- Figure 12: United Kingdom Europe Biochar Market Revenue (Million), by Country 2024 & 2032
- Figure 13: United Kingdom Europe Biochar Market Revenue Share (%), by Country 2024 & 2032
- Figure 14: France Europe Biochar Market Revenue (Million), by Technology 2024 & 2032
- Figure 15: France Europe Biochar Market Revenue Share (%), by Technology 2024 & 2032
- Figure 16: France Europe Biochar Market Revenue (Million), by Application 2024 & 2032
- Figure 17: France Europe Biochar Market Revenue Share (%), by Application 2024 & 2032
- Figure 18: France Europe Biochar Market Revenue (Million), by Country 2024 & 2032
- Figure 19: France Europe Biochar Market Revenue Share (%), by Country 2024 & 2032
- Figure 20: Italy Europe Biochar Market Revenue (Million), by Technology 2024 & 2032
- Figure 21: Italy Europe Biochar Market Revenue Share (%), by Technology 2024 & 2032
- Figure 22: Italy Europe Biochar Market Revenue (Million), by Application 2024 & 2032
- Figure 23: Italy Europe Biochar Market Revenue Share (%), by Application 2024 & 2032
- Figure 24: Italy Europe Biochar Market Revenue (Million), by Country 2024 & 2032
- Figure 25: Italy Europe Biochar Market Revenue Share (%), by Country 2024 & 2032
- Figure 26: Spain Europe Biochar Market Revenue (Million), by Technology 2024 & 2032
- Figure 27: Spain Europe Biochar Market Revenue Share (%), by Technology 2024 & 2032
- Figure 28: Spain Europe Biochar Market Revenue (Million), by Application 2024 & 2032
- Figure 29: Spain Europe Biochar Market Revenue Share (%), by Application 2024 & 2032
- Figure 30: Spain Europe Biochar Market Revenue (Million), by Country 2024 & 2032
- Figure 31: Spain Europe Biochar Market Revenue Share (%), by Country 2024 & 2032
- Figure 32: Nordic Europe Biochar Market Revenue (Million), by Technology 2024 & 2032
- Figure 33: Nordic Europe Biochar Market Revenue Share (%), by Technology 2024 & 2032
- Figure 34: Nordic Europe Biochar Market Revenue (Million), by Application 2024 & 2032
- Figure 35: Nordic Europe Biochar Market Revenue Share (%), by Application 2024 & 2032
- Figure 36: Nordic Europe Biochar Market Revenue (Million), by Country 2024 & 2032
- Figure 37: Nordic Europe Biochar Market Revenue Share (%), by Country 2024 & 2032
- Figure 38: Turkey Europe Biochar Market Revenue (Million), by Technology 2024 & 2032
- Figure 39: Turkey Europe Biochar Market Revenue Share (%), by Technology 2024 & 2032
- Figure 40: Turkey Europe Biochar Market Revenue (Million), by Application 2024 & 2032
- Figure 41: Turkey Europe Biochar Market Revenue Share (%), by Application 2024 & 2032
- Figure 42: Turkey Europe Biochar Market Revenue (Million), by Country 2024 & 2032
- Figure 43: Turkey Europe Biochar Market Revenue Share (%), by Country 2024 & 2032
- Figure 44: Russia Europe Biochar Market Revenue (Million), by Technology 2024 & 2032
- Figure 45: Russia Europe Biochar Market Revenue Share (%), by Technology 2024 & 2032
- Figure 46: Russia Europe Biochar Market Revenue (Million), by Application 2024 & 2032
- Figure 47: Russia Europe Biochar Market Revenue Share (%), by Application 2024 & 2032
- Figure 48: Russia Europe Biochar Market Revenue (Million), by Country 2024 & 2032
- Figure 49: Russia Europe Biochar Market Revenue Share (%), by Country 2024 & 2032
- Figure 50: Rest of Europe Europe Biochar Market Revenue (Million), by Technology 2024 & 2032
- Figure 51: Rest of Europe Europe Biochar Market Revenue Share (%), by Technology 2024 & 2032
- Figure 52: Rest of Europe Europe Biochar Market Revenue (Million), by Application 2024 & 2032
- Figure 53: Rest of Europe Europe Biochar Market Revenue Share (%), by Application 2024 & 2032
- Figure 54: Rest of Europe Europe Biochar Market Revenue (Million), by Country 2024 & 2032
- Figure 55: Rest of Europe Europe Biochar Market Revenue Share (%), by Country 2024 & 2032
List of Tables
- Table 1: Global Europe Biochar Market Revenue Million Forecast, by Region 2019 & 2032
- Table 2: Global Europe Biochar Market Revenue Million Forecast, by Technology 2019 & 2032
- Table 3: Global Europe Biochar Market Revenue Million Forecast, by Application 2019 & 2032
- Table 4: Global Europe Biochar Market Revenue Million Forecast, by Region 2019 & 2032
- Table 5: Global Europe Biochar Market Revenue Million Forecast, by Technology 2019 & 2032
- Table 6: Global Europe Biochar Market Revenue Million Forecast, by Application 2019 & 2032
- Table 7: Global Europe Biochar Market Revenue Million Forecast, by Country 2019 & 2032
- Table 8: Global Europe Biochar Market Revenue Million Forecast, by Technology 2019 & 2032
- Table 9: Global Europe Biochar Market Revenue Million Forecast, by Application 2019 & 2032
- Table 10: Global Europe Biochar Market Revenue Million Forecast, by Country 2019 & 2032
- Table 11: Global Europe Biochar Market Revenue Million Forecast, by Technology 2019 & 2032
- Table 12: Global Europe Biochar Market Revenue Million Forecast, by Application 2019 & 2032
- Table 13: Global Europe Biochar Market Revenue Million Forecast, by Country 2019 & 2032
- Table 14: Global Europe Biochar Market Revenue Million Forecast, by Technology 2019 & 2032
- Table 15: Global Europe Biochar Market Revenue Million Forecast, by Application 2019 & 2032
- Table 16: Global Europe Biochar Market Revenue Million Forecast, by Country 2019 & 2032
- Table 17: Global Europe Biochar Market Revenue Million Forecast, by Technology 2019 & 2032
- Table 18: Global Europe Biochar Market Revenue Million Forecast, by Application 2019 & 2032
- Table 19: Global Europe Biochar Market Revenue Million Forecast, by Country 2019 & 2032
- Table 20: Global Europe Biochar Market Revenue Million Forecast, by Technology 2019 & 2032
- Table 21: Global Europe Biochar Market Revenue Million Forecast, by Application 2019 & 2032
- Table 22: Global Europe Biochar Market Revenue Million Forecast, by Country 2019 & 2032
- Table 23: Global Europe Biochar Market Revenue Million Forecast, by Technology 2019 & 2032
- Table 24: Global Europe Biochar Market Revenue Million Forecast, by Application 2019 & 2032
- Table 25: Global Europe Biochar Market Revenue Million Forecast, by Country 2019 & 2032
- Table 26: Global Europe Biochar Market Revenue Million Forecast, by Technology 2019 & 2032
- Table 27: Global Europe Biochar Market Revenue Million Forecast, by Application 2019 & 2032
- Table 28: Global Europe Biochar Market Revenue Million Forecast, by Country 2019 & 2032
- Table 29: Global Europe Biochar Market Revenue Million Forecast, by Technology 2019 & 2032
- Table 30: Global Europe Biochar Market Revenue Million Forecast, by Application 2019 & 2032
- Table 31: Global Europe Biochar Market Revenue Million Forecast, by Country 2019 & 2032
Frequently Asked Questions
1. What is the projected Compound Annual Growth Rate (CAGR) of the Europe Biochar Market?
The projected CAGR is approximately 24.03%.
2. Which companies are prominent players in the Europe Biochar Market?
Key companies in the market include Bussme Energy AB, Circular Carbon Gmbh, Carbofex Ltd, Carbon Centric, Carbon Finland Oy, Carbon Gold Ltd, Carbuna, Charline Gmbh, Egos Gmbh, Eoc Energy Ocean, Lucrat Gmbh, Nettenergy BV, Novocarbo Gmbh, Sonnenerde Gmbh, Verora AG*List Not Exhaustive.
3. What are the main segments of the Europe Biochar Market?
The market segments include Technology, Application.
4. Can you provide details about the market size?
The market size is estimated to be USD XX Million as of 2022.
5. What are some drivers contributing to market growth?
Increasing Demand for Organic Farming in the Agricultural Industry; Increasing Focus on the Waste Management Sector; Others.
6. What are the notable trends driving market growth?
Increasing Demand from the Agricultural Industry.
7. Are there any restraints impacting market growth?
Increasing Demand for Organic Farming in the Agricultural Industry; Increasing Focus on the Waste Management Sector; Others.
8. Can you provide examples of recent developments in the market?
March 2024: Novocarbo raised EUR 25 million (USD 27 million) to construct 200 carbon removal parks in Europe by 2033. The company aims to expand the network for carbon capture and sequestration (CCS) and green heat across Europe.
9. What pricing options are available for accessing the report?
Pricing options include single-user, multi-user, and enterprise licenses priced at USD 4750, USD 5250, and USD 8750 respectively.
10. Is the market size provided in terms of value or volume?
The market size is provided in terms of value, measured in Million.
11. Are there any specific market keywords associated with the report?
Yes, the market keyword associated with the report is "Europe Biochar Market," which aids in identifying and referencing the specific market segment covered.
12. How do I determine which pricing option suits my needs best?
The pricing options vary based on user requirements and access needs. Individual users may opt for single-user licenses, while businesses requiring broader access may choose multi-user or enterprise licenses for cost-effective access to the report.
13. Are there any additional resources or data provided in the Europe Biochar Market report?
While the report offers comprehensive insights, it's advisable to review the specific contents or supplementary materials provided to ascertain if additional resources or data are available.
14. How can I stay updated on further developments or reports in the Europe Biochar Market?
To stay informed about further developments, trends, and reports in the Europe Biochar Market, consider subscribing to industry newsletters, following relevant companies and organizations, or regularly checking reputable industry news sources and publications.
Methodology
Step 1 - Identification of Relevant Samples Size from Population Database


Step 2 - Approaches for Defining Global Market Size (Value, Volume* & Price*)

Note*: In applicable scenarios
Step 3 - Data Sources
Primary Research
- Web Analytics
- Survey Reports
- Research Institute
- Latest Research Reports
- Opinion Leaders
Secondary Research
- Annual Reports
- White Paper
- Latest Press Release
- Industry Association
- Paid Database
- Investor Presentations

Step 4 - Data Triangulation
Involves using different sources of information in order to increase the validity of a study
These sources are likely to be stakeholders in a program - participants, other researchers, program staff, other community members, and so on.
Then we put all data in single framework & apply various statistical tools to find out the dynamic on the market.
During the analysis stage, feedback from the stakeholder groups would be compared to determine areas of agreement as well as areas of divergence
