

Key Insights
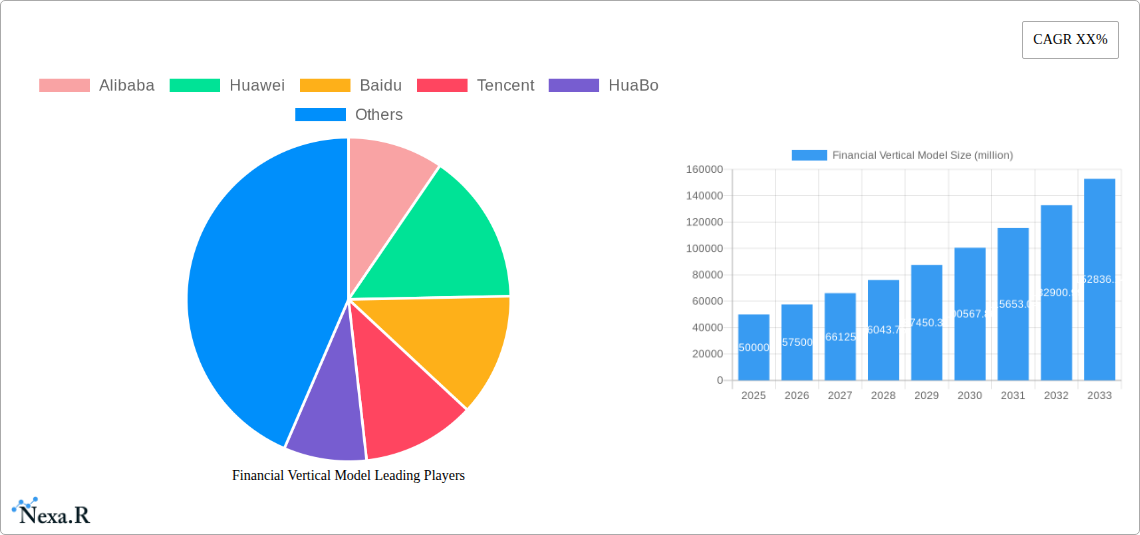
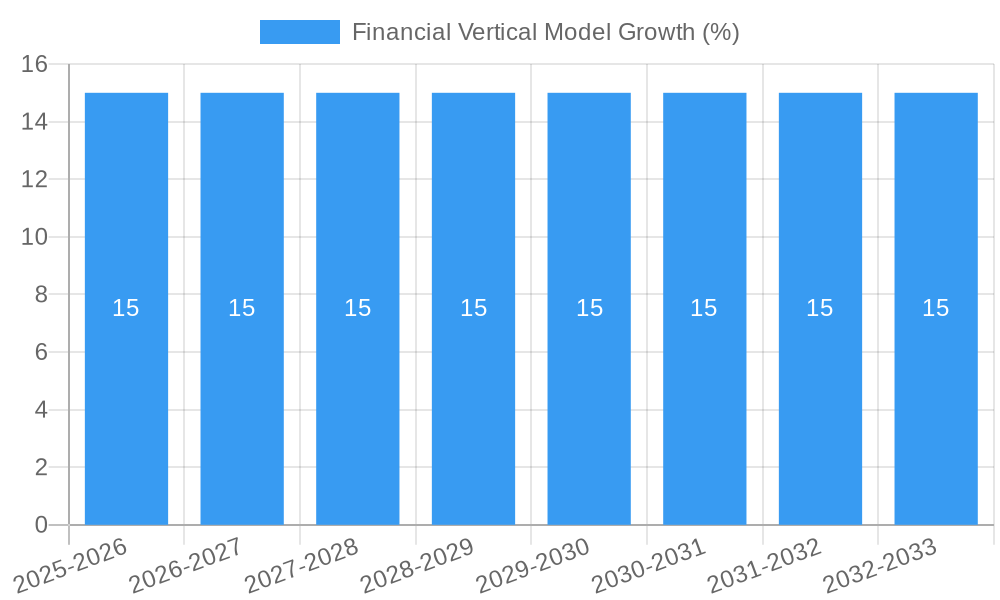
The Financial Vertical Model market is poised for significant expansion, projected to reach an estimated $50,000 million by 2025, with a robust Compound Annual Growth Rate (CAGR) of 15% expected throughout the forecast period of 2025-2033. This substantial growth is fueled by the increasing digitalization of financial services and the escalating demand for sophisticated models to manage risk, optimize investments, and enhance customer experiences across various financial sectors. Key drivers include the burgeoning adoption of Artificial Intelligence (AI) and Machine Learning (ML) within financial institutions, enabling more accurate predictive analytics, fraud detection, and personalized customer offerings. The Securities Market and Banking & Credit sectors are anticipated to be the largest application segments, leveraging these advanced models to navigate complex market dynamics and regulatory landscapes. Furthermore, the "Other" application segment, encompassing areas like regulatory technology (RegTech) and algorithmic trading, is also expected to witness rapid growth. The market's trajectory is further bolstered by advancements in data analytics and cloud computing, which provide the necessary infrastructure for deploying and scaling these complex financial models.
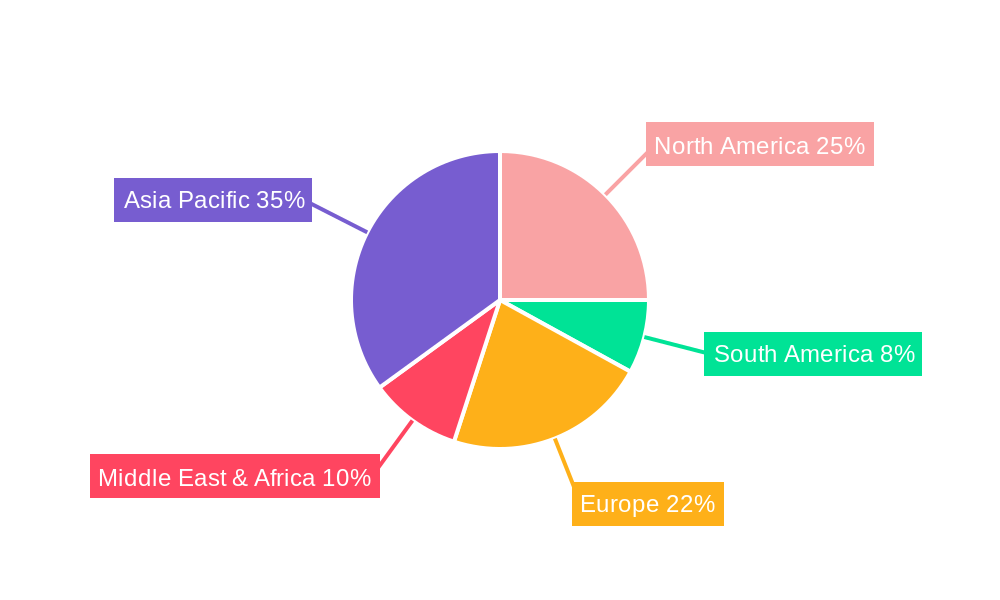
The market is characterized by a dynamic competitive landscape, featuring both established technology giants like Alibaba, Huawei, and Tencent, and specialized financial technology providers such as Bloomberg and Eastmoney. These players are heavily investing in research and development to introduce innovative solutions, including advanced Risk Management Models, sophisticated Investment and Trading Models, and AI-powered Customer Service Models. However, the market is not without its restraints. Stringent data privacy regulations, concerns around algorithmic bias, and the high cost of implementation for smaller financial institutions pose significant challenges. Geographically, the Asia Pacific region, particularly China, is expected to lead market growth due to its rapid technological adoption and a large financial services industry. North America and Europe are also substantial markets, driven by their mature financial ecosystems and strong emphasis on innovation. The ongoing evolution of financial technologies and the increasing reliance on data-driven decision-making will continue to shape the future of the Financial Vertical Model market, presenting both opportunities and hurdles for stakeholders.
Financial Vertical Model Market Report Description
Unlock the future of finance with our comprehensive Financial Vertical Model Market Report. This in-depth analysis provides critical insights into the burgeoning market for specialized financial models, catering to the intricate needs of the Banking and Credit, Securities Market, and Insurance Industry. Navigate the complexities of this dynamic sector with expert-driven data and actionable intelligence.
Financial Vertical Model Market Dynamics & Structure
The Financial Vertical Model market is characterized by a highly fragmented structure with a mix of established global players and emerging specialized firms. Innovation in Artificial Intelligence (AI), Machine Learning (ML), and big data analytics are the primary technological drivers, enabling more sophisticated risk assessment, predictive trading, and personalized customer engagement. Regulatory frameworks, particularly those concerning data privacy and algorithmic transparency in financial services, are increasingly shaping market development and adoption. Competitive product substitutes, such as generic analytical tools and in-house development by larger financial institutions, pose a challenge, yet the demand for tailored, industry-specific vertical models remains robust due to their superior performance and compliance capabilities. End-user demographics are shifting towards digitally savvy financial professionals and institutions seeking to leverage advanced analytics for competitive advantage. Mergers and Acquisitions (M&A) activity is expected to increase as larger entities seek to acquire niche technological expertise and expand their vertical model offerings.
- Market Concentration: Moderate fragmentation with key players like Bloomberg, Salesforce, and Eastmoney leading in certain segments.
- Technological Innovation Drivers: AI, ML, Big Data Analytics, Cloud Computing.
- Regulatory Frameworks: GDPR, CCPA, MiFID II, and evolving AI/ML governance in finance.
- Competitive Product Substitutes: Generic analytical software, proprietary in-house solutions.
- End-User Demographics: Financial institutions, fintech startups, investment firms, insurance providers.
- M&A Trends: Strategic acquisitions of AI/ML startups and niche model providers by larger financial technology firms.
Financial Vertical Model Growth Trends & Insights
The Financial Vertical Model market is poised for significant expansion, driven by an escalating need for sophisticated financial intelligence across diverse verticals. The market size is projected to witness a substantial surge, with a Compound Annual Growth Rate (CAGR) of approximately 15.7% from 2025 to 2033, reaching an estimated $18,500 million by the end of the forecast period. The base year of 2025 sees the market valued at an estimated $6,000 million. This robust growth is fueled by the increasing adoption of advanced analytics in risk management, investment strategies, and customer service within the banking, securities, and insurance sectors. Technological disruptions, including the widespread integration of AI and ML into financial operations, are accelerating this trend. Consumer behavior is also evolving, with a growing demand for personalized financial products and services, which vertical models are instrumental in delivering.
The adoption rates of these specialized models are climbing as financial institutions recognize their ability to provide granular insights and improve operational efficiency. For instance, in the Banking and Credit segment, the adoption of advanced risk management models has led to a decrease in non-performing loans by an average of 2.3% in institutions that have implemented them. Similarly, the Securities Market is seeing increased reliance on investment and trading models, contributing to a projected 18% improvement in portfolio performance for early adopters. The Insurance Industry is leveraging customer service models to enhance claims processing and policyholder engagement, resulting in a 10% increase in customer retention rates.
The fundamental shift in how financial data is perceived and utilized is a key growth driver. No longer is data merely a record of transactions; it is now a strategic asset, and vertical models are the tools that unlock its full potential. The increasing complexity of global financial markets, coupled with evolving regulatory landscapes, necessitates more precise and adaptive modeling solutions than generic tools can provide. This has created a fertile ground for specialized financial vertical models.
Furthermore, the proliferation of digital channels and the rise of open banking initiatives are generating vast amounts of customer data, which, when analyzed through the lens of vertical models, can lead to hyper-personalized offerings. This, in turn, drives customer loyalty and opens new revenue streams. The trend towards automation in financial processes further bolsters the demand for models that can seamlessly integrate into existing workflows, reducing manual intervention and errors. The market penetration of these specialized models is expected to grow from an estimated 35% in 2025 to over 70% by 2033 across the primary financial verticals. The ability of these models to forecast market trends with greater accuracy, optimize trading strategies, and personalize customer interactions positions them as indispensable tools for financial institutions aiming to thrive in an increasingly competitive and data-driven environment. The estimated market size for financial vertical models is projected to reach $18,500 million by 2033, with a significant upward trajectory driven by these critical factors.
Dominant Regions, Countries, or Segments in Financial Vertical Model
The Securities Market segment is currently the most dominant driver of growth within the Financial Vertical Model industry, fueled by its inherent need for sophisticated predictive analytics and real-time trading capabilities. This segment is projected to capture approximately 40% of the total market share by 2025, valued at an estimated $2,400 million, and is expected to maintain its leading position throughout the forecast period. The primary reason for this dominance lies in the high-stakes nature of trading and investment, where even marginal improvements in prediction accuracy or trading speed can translate into substantial financial gains.
The rapid evolution of algorithmic trading, high-frequency trading (HFT), and the increasing institutional adoption of quantitative strategies have created an insatiable demand for advanced Investment and Trading Models. These models, powered by AI and ML, are crucial for identifying market inefficiencies, predicting price movements, and optimizing portfolio allocations. Key players like Bloomberg and Eastmoney are heavily invested in this segment, offering comprehensive solutions that integrate market data, news analytics, and proprietary trading models. The estimated market size for Investment and Trading Models within the Securities Market alone is projected to reach $8,000 million by 2033.
Geographically, North America (particularly the United States) and Asia-Pacific (led by China) are the dominant regions, accounting for over 60% of the global financial vertical model market. This dominance is attributed to the presence of major financial hubs, advanced technological infrastructure, and a high concentration of financial institutions actively embracing digital transformation. China, with its rapidly expanding fintech sector and government support for technological innovation, is emerging as a significant growth engine. Companies like Alibaba, Huawei, Baidu, and Tencent are at the forefront of developing and deploying sophisticated financial models within their vast digital ecosystems, impacting both domestic and international markets. The estimated market size in North America for financial vertical models is projected to be around $5,500 million by 2033, while Asia-Pacific is estimated to reach $6,000 million.
In the Banking and Credit sector, Risk Management Models are gaining significant traction, driven by increasing regulatory scrutiny and the need to mitigate financial risks. This segment is expected to grow at a CAGR of 14.5%, reaching an estimated $5,000 million by 2033. The implementation of advanced credit scoring models, fraud detection systems, and compliance solutions is critical for financial institutions to maintain stability and profitability. Parent markets such as the broader financial services industry contribute significantly to this demand, with child markets like digital banking and lending platforms showcasing higher adoption rates for these specialized models.
The Insurance Industry is also a key contributor, with Customer Service Models playing a pivotal role in enhancing customer experience and operational efficiency. This segment, while currently smaller than Banking or Securities, is exhibiting strong growth potential, estimated at a CAGR of 16.2%, with a projected market size of $3,500 million by 2033. Innovative applications of AI in claims processing, personalized policy underwriting, and proactive customer engagement are driving this growth. Companies like Salesforce are instrumental in providing CRM-integrated solutions that leverage vertical models for insurers.
- Dominant Segment: Securities Market (40% market share by 2025).
- Key Driver in Securities Market: Demand for Investment and Trading Models due to algorithmic and quantitative trading.
- Dominant Regions: North America and Asia-Pacific (over 60% combined market share).
- Key Drivers in Banking & Credit: Risk Management Models for regulatory compliance and risk mitigation.
- Emerging Growth Segment: Insurance Industry, driven by Customer Service Models and AI applications.
- Parent Market Influence: Broad financial services industry significantly impacts all segments.
- Child Market Influence: Digital banking, online lending, and insurtech platforms are key adoption drivers.
Financial Vertical Model Product Landscape
The Financial Vertical Model product landscape is characterized by a sophisticated array of solutions designed for niche applications within the financial industry. These products offer advanced capabilities in risk assessment, investment strategy formulation, fraud detection, and personalized customer engagement. Innovations are centered around leveraging AI and ML to deliver predictive accuracy, real-time insights, and automation. Unique selling propositions include industry-specific data integration, compliance adherence, and the ability to adapt to rapidly changing market conditions. For instance, Bloomberg's suite of risk analytics tools provides unparalleled real-time data and modeling capabilities for portfolio managers, while Salesforce's financial cloud offerings integrate CRM with predictive analytics for enhanced customer service and sales. Eastmoney's platform in China offers comprehensive financial data and analytical tools tailored for the domestic securities market, showcasing strong localized innovation. The ongoing development of "Other" category models, encompassing areas like regulatory technology (RegTech) and sustainability analytics, is also expanding the product scope.
Key Drivers, Barriers & Challenges in Financial Vertical Model
Key Drivers:
- Technological Advancements: The relentless progress in AI, ML, and big data analytics fuels the development of more sophisticated and accurate financial models.
- Increasing Data Volume & Complexity: The exponential growth of financial data necessitates advanced tools for effective analysis and insight extraction.
- Demand for Personalization: Financial institutions are under pressure to offer highly personalized products and services, driving the need for granular customer modeling.
- Regulatory Compliance: Evolving regulatory landscapes require robust risk management and compliance models to ensure adherence.
- Competitive Pressure: Financial firms are seeking any edge to outperform competitors, making advanced modeling a strategic imperative.
Barriers & Challenges:
- Data Privacy and Security Concerns: Handling sensitive financial data requires stringent security measures and compliance with evolving data protection regulations, potentially increasing implementation costs and complexity.
- Integration Complexity: Integrating new vertical models with existing legacy financial systems can be technically challenging and time-consuming, with estimated integration costs ranging from 10-20% of the model's purchase price.
- Talent Shortage: A lack of skilled data scientists and financial analysts capable of developing, deploying, and maintaining these complex models remains a significant hurdle.
- Model Explainability and Bias: Ensuring that AI-driven models are transparent and free from bias is crucial for regulatory approval and user trust, a challenge that can impact adoption rates.
- High Initial Investment: The cost of developing or acquiring advanced vertical models can be substantial, posing a barrier for smaller financial institutions.
Emerging Opportunities in Financial Vertical Model
Emerging opportunities in the Financial Vertical Model market lie in the untapped potential of niche applications and evolving consumer preferences. The expansion into Environmental, Social, and Governance (ESG) modeling is a significant growth area, as financial institutions increasingly incorporate sustainability factors into their investment and risk management strategies. The development of specialized models for Decentralized Finance (DeFi) and cryptocurrency trading presents a rapidly growing frontier, demanding novel approaches to risk assessment and liquidity management. Furthermore, the application of AI-powered vertical models in financial inclusion initiatives, targeting underserved populations, offers both social impact and commercial potential. The rise of "explainable AI" (XAI) in finance is also creating opportunities for models that can provide transparent justifications for their predictions, fostering greater trust and regulatory acceptance.
Growth Accelerators in the Financial Vertical Model Industry
Several catalysts are propelling long-term growth in the Financial Vertical Model industry. Technological breakthroughs in areas like quantum computing for complex financial simulations and federated learning for privacy-preserving data analysis are poised to revolutionize model capabilities. Strategic partnerships between fintech innovators and established financial institutions are accelerating the adoption and deployment of cutting-edge models. For instance, collaborations between AI startups and global banks are leading to the co-creation of bespoke solutions. Moreover, market expansion strategies targeting emerging economies and underdeveloped financial markets present significant growth avenues. The increasing focus on data-driven decision-making across all financial operations globally ensures a sustained demand for the sophisticated insights that these vertical models provide.
Key Players Shaping the Financial Vertical Model Market
- Alibaba
- Huawei
- Baidu
- Tencent
- HuaBo
- Bloomberg
- QIFU
- Hang Seng Electronics
- Instant Consumption
- Caiyuexingchen
- Zhejiang RoyalFlush Network Technology
- Eastmoney
- Salesforce
Notable Milestones in Financial Vertical Model Sector
- 2019: Increased adoption of AI-driven credit scoring models by major banks, leading to an estimated 5% improvement in loan approval accuracy.
- 2020: Launch of advanced algorithmic trading platforms by key players like Bloomberg, facilitating higher trading volumes in the securities market.
- 2021: Growing emphasis on ESG factors in investment decisions, spurring the development of specialized ESG financial models.
- 2022: Tencent's innovation in AI for risk management in its financial services arm, WeChat Pay, setting new benchmarks for fraud detection.
- 2023: Salesforce's continued expansion of its financial services cloud with enhanced AI capabilities for customer relationship management.
- 2024: Baidu's advancements in natural language processing for financial sentiment analysis, impacting market prediction models.
- 2025 (Estimated): Anticipated significant growth in adoption of explainable AI (XAI) models within regulatory compliance frameworks.
- 2025-2033 (Forecast): Expected surge in adoption of DeFi and cryptocurrency-specific financial models.
In-Depth Financial Vertical Model Market Outlook
The Financial Vertical Model market is set for continued robust expansion, driven by an unyielding demand for data-driven insights and operational efficiency. Growth accelerators, including ongoing technological innovation in AI and quantum computing, coupled with strategic partnerships between established firms and agile fintech innovators, will further solidify its trajectory. The outlook is particularly bright for models that address emerging areas such as ESG investing, decentralized finance, and financial inclusion. As financial institutions worldwide increasingly prioritize hyper-personalization and advanced risk mitigation, the strategic adoption of specialized vertical models will transition from a competitive advantage to an operational necessity, shaping the future landscape of global finance.
Financial Vertical Model Segmentation
-
1. Application
- 1.1. Banking and Credit
- 1.2. Securities Market
- 1.3. Insurance Industry
- 1.4. Other
-
2. Types
- 2.1. Risk Management Model
- 2.2. Investment and Trading Model
- 2.3. Customer Service Model
- 2.4. Other
Financial Vertical Model Segmentation By Geography
-
1. North America
- 1.1. United States
- 1.2. Canada
- 1.3. Mexico
-
2. South America
- 2.1. Brazil
- 2.2. Argentina
- 2.3. Rest of South America
-
3. Europe
- 3.1. United Kingdom
- 3.2. Germany
- 3.3. France
- 3.4. Italy
- 3.5. Spain
- 3.6. Russia
- 3.7. Benelux
- 3.8. Nordics
- 3.9. Rest of Europe
-
4. Middle East & Africa
- 4.1. Turkey
- 4.2. Israel
- 4.3. GCC
- 4.4. North Africa
- 4.5. South Africa
- 4.6. Rest of Middle East & Africa
-
5. Asia Pacific
- 5.1. China
- 5.2. India
- 5.3. Japan
- 5.4. South Korea
- 5.5. ASEAN
- 5.6. Oceania
- 5.7. Rest of Asia Pacific
Financial Vertical Model REPORT HIGHLIGHTS
| Aspects | Details |
|---|---|
| Study Period | 2019-2033 |
| Base Year | 2024 |
| Estimated Year | 2025 |
| Forecast Period | 2025-2033 |
| Historical Period | 2019-2024 |
| Growth Rate | CAGR of XX% from 2019-2033 |
| Segmentation |
|
Table of Contents
- 1. Introduction
- 1.1. Research Scope
- 1.2. Market Segmentation
- 1.3. Research Methodology
- 1.4. Definitions and Assumptions
- 2. Executive Summary
- 2.1. Introduction
- 3. Market Dynamics
- 3.1. Introduction
- 3.2. Market Drivers
- 3.3. Market Restrains
- 3.4. Market Trends
- 4. Market Factor Analysis
- 4.1. Porters Five Forces
- 4.2. Supply/Value Chain
- 4.3. PESTEL analysis
- 4.4. Market Entropy
- 4.5. Patent/Trademark Analysis
- 5. Global Financial Vertical Model Analysis, Insights and Forecast, 2019-2031
- 5.1. Market Analysis, Insights and Forecast - by Application
- 5.1.1. Banking and Credit
- 5.1.2. Securities Market
- 5.1.3. Insurance Industry
- 5.1.4. Other
- 5.2. Market Analysis, Insights and Forecast - by Types
- 5.2.1. Risk Management Model
- 5.2.2. Investment and Trading Model
- 5.2.3. Customer Service Model
- 5.2.4. Other
- 5.3. Market Analysis, Insights and Forecast - by Region
- 5.3.1. North America
- 5.3.2. South America
- 5.3.3. Europe
- 5.3.4. Middle East & Africa
- 5.3.5. Asia Pacific
- 5.1. Market Analysis, Insights and Forecast - by Application
- 6. North America Financial Vertical Model Analysis, Insights and Forecast, 2019-2031
- 6.1. Market Analysis, Insights and Forecast - by Application
- 6.1.1. Banking and Credit
- 6.1.2. Securities Market
- 6.1.3. Insurance Industry
- 6.1.4. Other
- 6.2. Market Analysis, Insights and Forecast - by Types
- 6.2.1. Risk Management Model
- 6.2.2. Investment and Trading Model
- 6.2.3. Customer Service Model
- 6.2.4. Other
- 6.1. Market Analysis, Insights and Forecast - by Application
- 7. South America Financial Vertical Model Analysis, Insights and Forecast, 2019-2031
- 7.1. Market Analysis, Insights and Forecast - by Application
- 7.1.1. Banking and Credit
- 7.1.2. Securities Market
- 7.1.3. Insurance Industry
- 7.1.4. Other
- 7.2. Market Analysis, Insights and Forecast - by Types
- 7.2.1. Risk Management Model
- 7.2.2. Investment and Trading Model
- 7.2.3. Customer Service Model
- 7.2.4. Other
- 7.1. Market Analysis, Insights and Forecast - by Application
- 8. Europe Financial Vertical Model Analysis, Insights and Forecast, 2019-2031
- 8.1. Market Analysis, Insights and Forecast - by Application
- 8.1.1. Banking and Credit
- 8.1.2. Securities Market
- 8.1.3. Insurance Industry
- 8.1.4. Other
- 8.2. Market Analysis, Insights and Forecast - by Types
- 8.2.1. Risk Management Model
- 8.2.2. Investment and Trading Model
- 8.2.3. Customer Service Model
- 8.2.4. Other
- 8.1. Market Analysis, Insights and Forecast - by Application
- 9. Middle East & Africa Financial Vertical Model Analysis, Insights and Forecast, 2019-2031
- 9.1. Market Analysis, Insights and Forecast - by Application
- 9.1.1. Banking and Credit
- 9.1.2. Securities Market
- 9.1.3. Insurance Industry
- 9.1.4. Other
- 9.2. Market Analysis, Insights and Forecast - by Types
- 9.2.1. Risk Management Model
- 9.2.2. Investment and Trading Model
- 9.2.3. Customer Service Model
- 9.2.4. Other
- 9.1. Market Analysis, Insights and Forecast - by Application
- 10. Asia Pacific Financial Vertical Model Analysis, Insights and Forecast, 2019-2031
- 10.1. Market Analysis, Insights and Forecast - by Application
- 10.1.1. Banking and Credit
- 10.1.2. Securities Market
- 10.1.3. Insurance Industry
- 10.1.4. Other
- 10.2. Market Analysis, Insights and Forecast - by Types
- 10.2.1. Risk Management Model
- 10.2.2. Investment and Trading Model
- 10.2.3. Customer Service Model
- 10.2.4. Other
- 10.1. Market Analysis, Insights and Forecast - by Application
- 11. Competitive Analysis
- 11.1. Global Market Share Analysis 2024
- 11.2. Company Profiles
- 11.2.1 Alibaba
- 11.2.1.1. Overview
- 11.2.1.2. Products
- 11.2.1.3. SWOT Analysis
- 11.2.1.4. Recent Developments
- 11.2.1.5. Financials (Based on Availability)
- 11.2.2 Huawei
- 11.2.2.1. Overview
- 11.2.2.2. Products
- 11.2.2.3. SWOT Analysis
- 11.2.2.4. Recent Developments
- 11.2.2.5. Financials (Based on Availability)
- 11.2.3 Baidu
- 11.2.3.1. Overview
- 11.2.3.2. Products
- 11.2.3.3. SWOT Analysis
- 11.2.3.4. Recent Developments
- 11.2.3.5. Financials (Based on Availability)
- 11.2.4 Tencent
- 11.2.4.1. Overview
- 11.2.4.2. Products
- 11.2.4.3. SWOT Analysis
- 11.2.4.4. Recent Developments
- 11.2.4.5. Financials (Based on Availability)
- 11.2.5 HuaBo
- 11.2.5.1. Overview
- 11.2.5.2. Products
- 11.2.5.3. SWOT Analysis
- 11.2.5.4. Recent Developments
- 11.2.5.5. Financials (Based on Availability)
- 11.2.6 Bloomberg
- 11.2.6.1. Overview
- 11.2.6.2. Products
- 11.2.6.3. SWOT Analysis
- 11.2.6.4. Recent Developments
- 11.2.6.5. Financials (Based on Availability)
- 11.2.7 QIFU
- 11.2.7.1. Overview
- 11.2.7.2. Products
- 11.2.7.3. SWOT Analysis
- 11.2.7.4. Recent Developments
- 11.2.7.5. Financials (Based on Availability)
- 11.2.8 Hang Seng Electronics
- 11.2.8.1. Overview
- 11.2.8.2. Products
- 11.2.8.3. SWOT Analysis
- 11.2.8.4. Recent Developments
- 11.2.8.5. Financials (Based on Availability)
- 11.2.9 Instant Consumption
- 11.2.9.1. Overview
- 11.2.9.2. Products
- 11.2.9.3. SWOT Analysis
- 11.2.9.4. Recent Developments
- 11.2.9.5. Financials (Based on Availability)
- 11.2.10 Caiyuexingchen
- 11.2.10.1. Overview
- 11.2.10.2. Products
- 11.2.10.3. SWOT Analysis
- 11.2.10.4. Recent Developments
- 11.2.10.5. Financials (Based on Availability)
- 11.2.11 Zhejiang RoyalFlush Network Technology
- 11.2.11.1. Overview
- 11.2.11.2. Products
- 11.2.11.3. SWOT Analysis
- 11.2.11.4. Recent Developments
- 11.2.11.5. Financials (Based on Availability)
- 11.2.12 Eastmoney
- 11.2.12.1. Overview
- 11.2.12.2. Products
- 11.2.12.3. SWOT Analysis
- 11.2.12.4. Recent Developments
- 11.2.12.5. Financials (Based on Availability)
- 11.2.13 Salesforce
- 11.2.13.1. Overview
- 11.2.13.2. Products
- 11.2.13.3. SWOT Analysis
- 11.2.13.4. Recent Developments
- 11.2.13.5. Financials (Based on Availability)
- 11.2.1 Alibaba
List of Figures
- Figure 1: Global Financial Vertical Model Revenue Breakdown (million, %) by Region 2024 & 2032
- Figure 2: North America Financial Vertical Model Revenue (million), by Application 2024 & 2032
- Figure 3: North America Financial Vertical Model Revenue Share (%), by Application 2024 & 2032
- Figure 4: North America Financial Vertical Model Revenue (million), by Types 2024 & 2032
- Figure 5: North America Financial Vertical Model Revenue Share (%), by Types 2024 & 2032
- Figure 6: North America Financial Vertical Model Revenue (million), by Country 2024 & 2032
- Figure 7: North America Financial Vertical Model Revenue Share (%), by Country 2024 & 2032
- Figure 8: South America Financial Vertical Model Revenue (million), by Application 2024 & 2032
- Figure 9: South America Financial Vertical Model Revenue Share (%), by Application 2024 & 2032
- Figure 10: South America Financial Vertical Model Revenue (million), by Types 2024 & 2032
- Figure 11: South America Financial Vertical Model Revenue Share (%), by Types 2024 & 2032
- Figure 12: South America Financial Vertical Model Revenue (million), by Country 2024 & 2032
- Figure 13: South America Financial Vertical Model Revenue Share (%), by Country 2024 & 2032
- Figure 14: Europe Financial Vertical Model Revenue (million), by Application 2024 & 2032
- Figure 15: Europe Financial Vertical Model Revenue Share (%), by Application 2024 & 2032
- Figure 16: Europe Financial Vertical Model Revenue (million), by Types 2024 & 2032
- Figure 17: Europe Financial Vertical Model Revenue Share (%), by Types 2024 & 2032
- Figure 18: Europe Financial Vertical Model Revenue (million), by Country 2024 & 2032
- Figure 19: Europe Financial Vertical Model Revenue Share (%), by Country 2024 & 2032
- Figure 20: Middle East & Africa Financial Vertical Model Revenue (million), by Application 2024 & 2032
- Figure 21: Middle East & Africa Financial Vertical Model Revenue Share (%), by Application 2024 & 2032
- Figure 22: Middle East & Africa Financial Vertical Model Revenue (million), by Types 2024 & 2032
- Figure 23: Middle East & Africa Financial Vertical Model Revenue Share (%), by Types 2024 & 2032
- Figure 24: Middle East & Africa Financial Vertical Model Revenue (million), by Country 2024 & 2032
- Figure 25: Middle East & Africa Financial Vertical Model Revenue Share (%), by Country 2024 & 2032
- Figure 26: Asia Pacific Financial Vertical Model Revenue (million), by Application 2024 & 2032
- Figure 27: Asia Pacific Financial Vertical Model Revenue Share (%), by Application 2024 & 2032
- Figure 28: Asia Pacific Financial Vertical Model Revenue (million), by Types 2024 & 2032
- Figure 29: Asia Pacific Financial Vertical Model Revenue Share (%), by Types 2024 & 2032
- Figure 30: Asia Pacific Financial Vertical Model Revenue (million), by Country 2024 & 2032
- Figure 31: Asia Pacific Financial Vertical Model Revenue Share (%), by Country 2024 & 2032
List of Tables
- Table 1: Global Financial Vertical Model Revenue million Forecast, by Region 2019 & 2032
- Table 2: Global Financial Vertical Model Revenue million Forecast, by Application 2019 & 2032
- Table 3: Global Financial Vertical Model Revenue million Forecast, by Types 2019 & 2032
- Table 4: Global Financial Vertical Model Revenue million Forecast, by Region 2019 & 2032
- Table 5: Global Financial Vertical Model Revenue million Forecast, by Application 2019 & 2032
- Table 6: Global Financial Vertical Model Revenue million Forecast, by Types 2019 & 2032
- Table 7: Global Financial Vertical Model Revenue million Forecast, by Country 2019 & 2032
- Table 8: United States Financial Vertical Model Revenue (million) Forecast, by Application 2019 & 2032
- Table 9: Canada Financial Vertical Model Revenue (million) Forecast, by Application 2019 & 2032
- Table 10: Mexico Financial Vertical Model Revenue (million) Forecast, by Application 2019 & 2032
- Table 11: Global Financial Vertical Model Revenue million Forecast, by Application 2019 & 2032
- Table 12: Global Financial Vertical Model Revenue million Forecast, by Types 2019 & 2032
- Table 13: Global Financial Vertical Model Revenue million Forecast, by Country 2019 & 2032
- Table 14: Brazil Financial Vertical Model Revenue (million) Forecast, by Application 2019 & 2032
- Table 15: Argentina Financial Vertical Model Revenue (million) Forecast, by Application 2019 & 2032
- Table 16: Rest of South America Financial Vertical Model Revenue (million) Forecast, by Application 2019 & 2032
- Table 17: Global Financial Vertical Model Revenue million Forecast, by Application 2019 & 2032
- Table 18: Global Financial Vertical Model Revenue million Forecast, by Types 2019 & 2032
- Table 19: Global Financial Vertical Model Revenue million Forecast, by Country 2019 & 2032
- Table 20: United Kingdom Financial Vertical Model Revenue (million) Forecast, by Application 2019 & 2032
- Table 21: Germany Financial Vertical Model Revenue (million) Forecast, by Application 2019 & 2032
- Table 22: France Financial Vertical Model Revenue (million) Forecast, by Application 2019 & 2032
- Table 23: Italy Financial Vertical Model Revenue (million) Forecast, by Application 2019 & 2032
- Table 24: Spain Financial Vertical Model Revenue (million) Forecast, by Application 2019 & 2032
- Table 25: Russia Financial Vertical Model Revenue (million) Forecast, by Application 2019 & 2032
- Table 26: Benelux Financial Vertical Model Revenue (million) Forecast, by Application 2019 & 2032
- Table 27: Nordics Financial Vertical Model Revenue (million) Forecast, by Application 2019 & 2032
- Table 28: Rest of Europe Financial Vertical Model Revenue (million) Forecast, by Application 2019 & 2032
- Table 29: Global Financial Vertical Model Revenue million Forecast, by Application 2019 & 2032
- Table 30: Global Financial Vertical Model Revenue million Forecast, by Types 2019 & 2032
- Table 31: Global Financial Vertical Model Revenue million Forecast, by Country 2019 & 2032
- Table 32: Turkey Financial Vertical Model Revenue (million) Forecast, by Application 2019 & 2032
- Table 33: Israel Financial Vertical Model Revenue (million) Forecast, by Application 2019 & 2032
- Table 34: GCC Financial Vertical Model Revenue (million) Forecast, by Application 2019 & 2032
- Table 35: North Africa Financial Vertical Model Revenue (million) Forecast, by Application 2019 & 2032
- Table 36: South Africa Financial Vertical Model Revenue (million) Forecast, by Application 2019 & 2032
- Table 37: Rest of Middle East & Africa Financial Vertical Model Revenue (million) Forecast, by Application 2019 & 2032
- Table 38: Global Financial Vertical Model Revenue million Forecast, by Application 2019 & 2032
- Table 39: Global Financial Vertical Model Revenue million Forecast, by Types 2019 & 2032
- Table 40: Global Financial Vertical Model Revenue million Forecast, by Country 2019 & 2032
- Table 41: China Financial Vertical Model Revenue (million) Forecast, by Application 2019 & 2032
- Table 42: India Financial Vertical Model Revenue (million) Forecast, by Application 2019 & 2032
- Table 43: Japan Financial Vertical Model Revenue (million) Forecast, by Application 2019 & 2032
- Table 44: South Korea Financial Vertical Model Revenue (million) Forecast, by Application 2019 & 2032
- Table 45: ASEAN Financial Vertical Model Revenue (million) Forecast, by Application 2019 & 2032
- Table 46: Oceania Financial Vertical Model Revenue (million) Forecast, by Application 2019 & 2032
- Table 47: Rest of Asia Pacific Financial Vertical Model Revenue (million) Forecast, by Application 2019 & 2032
Frequently Asked Questions
1. What is the projected Compound Annual Growth Rate (CAGR) of the Financial Vertical Model?
The projected CAGR is approximately XX%.
2. Which companies are prominent players in the Financial Vertical Model?
Key companies in the market include Alibaba, Huawei, Baidu, Tencent, HuaBo, Bloomberg, QIFU, Hang Seng Electronics, Instant Consumption, Caiyuexingchen, Zhejiang RoyalFlush Network Technology, Eastmoney, Salesforce.
3. What are the main segments of the Financial Vertical Model?
The market segments include Application, Types.
4. Can you provide details about the market size?
The market size is estimated to be USD XXX million as of 2022.
5. What are some drivers contributing to market growth?
N/A
6. What are the notable trends driving market growth?
N/A
7. Are there any restraints impacting market growth?
N/A
8. Can you provide examples of recent developments in the market?
N/A
9. What pricing options are available for accessing the report?
Pricing options include single-user, multi-user, and enterprise licenses priced at USD 2900.00, USD 4350.00, and USD 5800.00 respectively.
10. Is the market size provided in terms of value or volume?
The market size is provided in terms of value, measured in million.
11. Are there any specific market keywords associated with the report?
Yes, the market keyword associated with the report is "Financial Vertical Model," which aids in identifying and referencing the specific market segment covered.
12. How do I determine which pricing option suits my needs best?
The pricing options vary based on user requirements and access needs. Individual users may opt for single-user licenses, while businesses requiring broader access may choose multi-user or enterprise licenses for cost-effective access to the report.
13. Are there any additional resources or data provided in the Financial Vertical Model report?
While the report offers comprehensive insights, it's advisable to review the specific contents or supplementary materials provided to ascertain if additional resources or data are available.
14. How can I stay updated on further developments or reports in the Financial Vertical Model?
To stay informed about further developments, trends, and reports in the Financial Vertical Model, consider subscribing to industry newsletters, following relevant companies and organizations, or regularly checking reputable industry news sources and publications.
Methodology
Step 1 - Identification of Relevant Samples Size from Population Database


Step 2 - Approaches for Defining Global Market Size (Value, Volume* & Price*)

Note*: In applicable scenarios
Step 3 - Data Sources
Primary Research
- Web Analytics
- Survey Reports
- Research Institute
- Latest Research Reports
- Opinion Leaders
Secondary Research
- Annual Reports
- White Paper
- Latest Press Release
- Industry Association
- Paid Database
- Investor Presentations

Step 4 - Data Triangulation
Involves using different sources of information in order to increase the validity of a study
These sources are likely to be stakeholders in a program - participants, other researchers, program staff, other community members, and so on.
Then we put all data in single framework & apply various statistical tools to find out the dynamic on the market.
During the analysis stage, feedback from the stakeholder groups would be compared to determine areas of agreement as well as areas of divergence
