

Key Insights
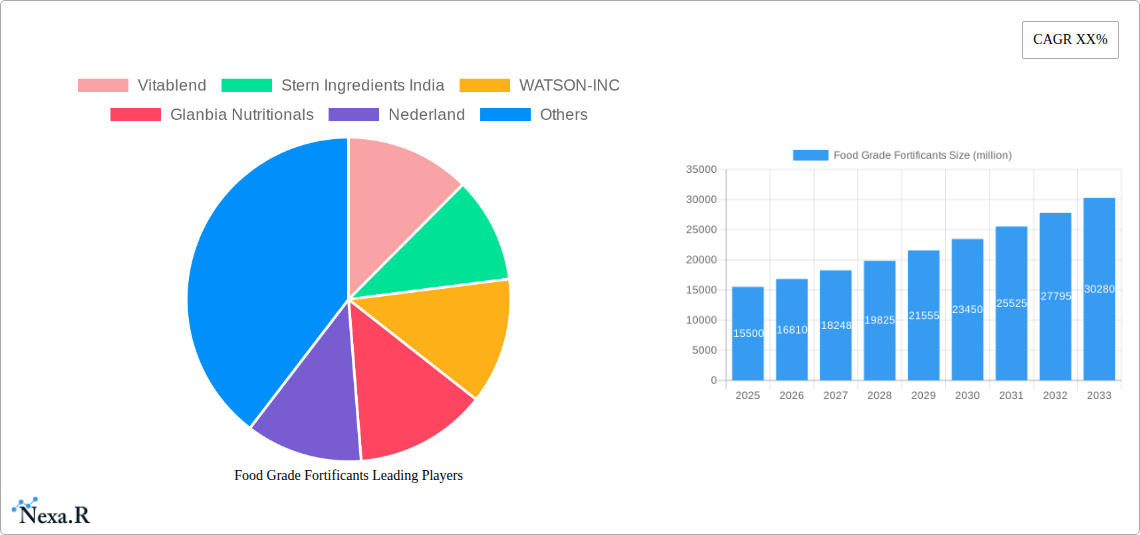
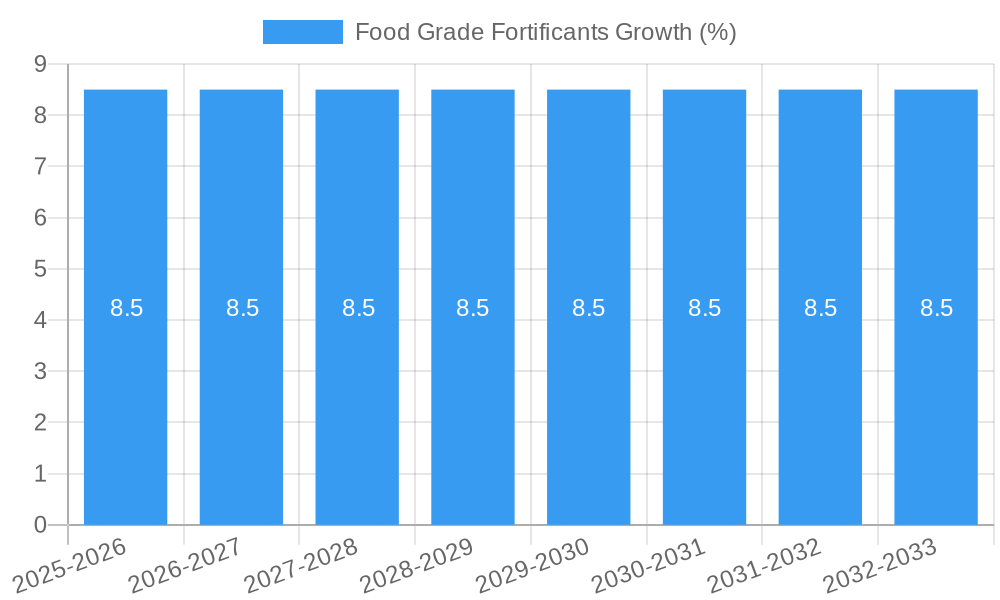
The global Food Grade Fortificants market is poised for significant expansion, projected to reach an estimated market size of USD 15,500 million by 2025, with a robust Compound Annual Growth Rate (CAGR) of 8.5% throughout the forecast period extending to 2033. This remarkable growth is primarily propelled by a confluence of escalating health consciousness among consumers, a growing demand for fortified foods and beverages to address nutritional deficiencies, and the increasing prevalence of lifestyle-related diseases. The Baby Food segment stands out as a dominant application, driven by parental focus on infant nutrition and the burgeoning global birth rates. Patient Food is another key segment, fueled by the rising incidence of chronic diseases and the need for specialized dietary interventions for recovery and management. The market's expansion is further bolstered by advancements in food processing technologies that enable effective fortification without compromising taste or texture, as well as a favorable regulatory landscape in many regions promoting the addition of essential micronutrients to food products.
The market landscape is characterized by several key drivers, including the widespread awareness of the benefits of micronutrient supplementation for overall health and well-being, especially in developing economies. Furthermore, the growing demand for functional foods that offer added health benefits beyond basic nutrition is significantly contributing to the market's upward trajectory. Key trends include the increasing popularity of plant-based fortificants, driven by the rise of veganism and vegetarianism, and a growing emphasis on natural and organic fortificants. However, challenges such as the fluctuating costs of raw materials and stringent regulatory requirements in certain geographies could pose restraints. Nonetheless, the innovative strategies adopted by key market players, including mergers, acquisitions, and product development, are expected to mitigate these challenges and ensure sustained market growth. The competitive environment is dynamic, with major companies like BASF SE, Glanbia Nutritionals, and Hexagon Nutrition actively investing in research and development to capture a larger market share.
This comprehensive report offers an in-depth analysis of the global Food Grade Fortificants market, meticulously examining market dynamics, growth trends, regional dominance, product innovations, and the strategic landscape. Designed for industry professionals, manufacturers, ingredient suppliers, and investors, this report provides actionable insights and data-driven forecasts to navigate the evolving nutritional enhancement sector. We delve into the parent market of Nutritional Ingredients and the child market of Specialty Food Additives, offering a holistic view of the fortificants' place within the broader industry.
Food Grade Fortificants Market Dynamics & Structure
The global Food Grade Fortificants market is characterized by moderate to high concentration, with key players like BASF SE, Glanbia Nutritionals, and Jubilant Life Sciences holding significant market share. Technological innovation is a primary driver, fueled by advancements in bioavailability, stability, and delivery systems for vitamins, minerals, and other essential nutrients. Robust regulatory frameworks established by bodies like the FDA and EFSA ensure product safety and efficacy, influencing product development and market access. While the market for direct substitutes is limited, the broader nutritional supplement industry presents indirect competition. End-user demographics are increasingly health-conscious, with growing demand from infant nutrition, elderly care, and functional food sectors. Merger and acquisition (M&A) activities are on the rise, as companies seek to expand their product portfolios, geographic reach, and technological capabilities. For instance, the historical period (2019-2024) witnessed an estimated $XXX million in M&A deal value, indicating consolidation and strategic growth initiatives. Innovation barriers include high R&D costs, stringent regulatory approvals, and the need for consumer education on the benefits of fortification.
- Market Concentration: Moderate to High.
- Key Innovators: BASF SE, Glanbia Nutritionals, Jubilant Life Sciences.
- Regulatory Influence: Strong, ensuring safety and efficacy.
- Competitive Landscape: Primarily within specialty ingredients; indirect competition from broader supplements.
- End-User Demographics: Growing demand from health-conscious consumers, especially in baby and patient food segments.
- M&A Trends: Increasing, aiming for portfolio expansion and market consolidation. Estimated $XXX million in deal value during 2019-2024.
Food Grade Fortificants Growth Trends & Insights
The Food Grade Fortificants market is poised for robust growth, projected to expand at a Compound Annual Growth Rate (CAGR) of XX% from 2025 to 2033. This expansion is underpinned by a confluence of factors including increasing global awareness of nutritional deficiencies, rising demand for fortified foods in emerging economies, and a growing preference for preventive healthcare. The market size, estimated at $XXX million in the base year 2025, is anticipated to reach $XXX million by 2033. Adoption rates are accelerating, particularly in the baby food segment where fortification is a standard practice for ensuring optimal infant development. Technological disruptions are playing a crucial role, with advancements in encapsulation technologies enhancing the stability and absorption of fortificants, thereby improving product performance and consumer satisfaction. Consumer behavior is shifting towards healthier lifestyles, with a greater willingness to choose fortified products that offer added health benefits. For example, the increasing prevalence of fortified cereals and dairy products reflects this trend. Market penetration in developing regions is expected to surge as governments implement public health initiatives focused on micronutrient supplementation. The estimated market penetration for fortified vitamins in the parent market of Nutritional Ingredients stands at XX% in 2025. The child market of Specialty Food Additives is also seeing significant growth, with fortificants being a key contributor.
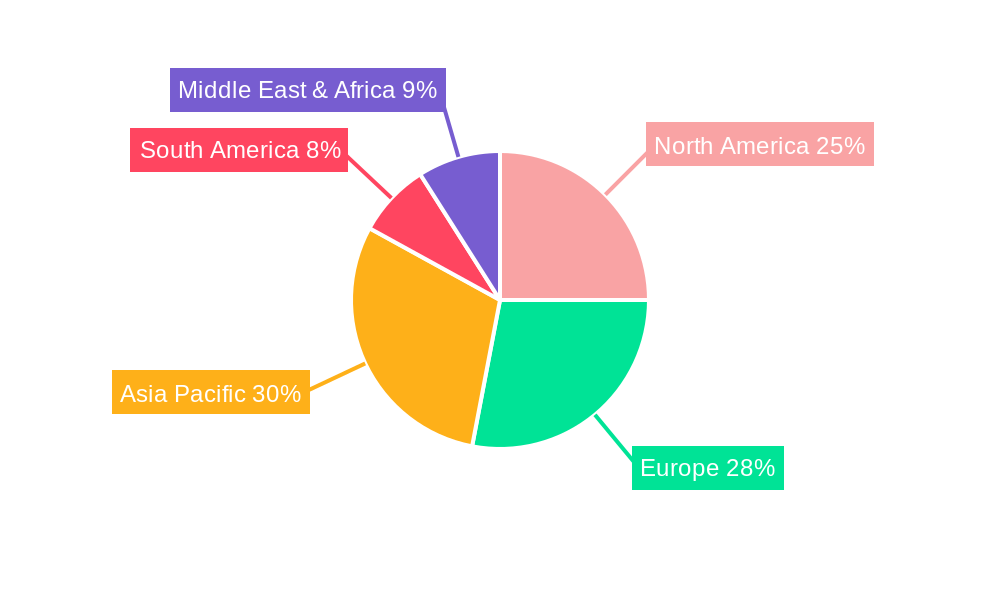
Dominant Regions, Countries, or Segments in Food Grade Fortificants
North America currently holds a dominant position in the global Food Grade Fortificants market, driven by its mature food and beverage industry, high consumer awareness regarding health and wellness, and stringent regulatory standards that encourage high-quality fortification. The United States, in particular, represents a significant market share due to the widespread adoption of fortified products across various applications, including infant formula, breakfast cereals, and dairy products. The Baby Food application segment is a primary growth engine within North America, accounting for an estimated XX% of the total fortificant demand in the region in 2025. This dominance is fueled by government initiatives promoting infant health and a strong consumer base that prioritizes nutrient-rich options for children.
Key Drivers for North American Dominance:
- High Consumer Awareness: Proactive health consciousness and demand for preventative health solutions.
- Robust Regulatory Framework: Strict quality and safety standards foster trust and innovation.
- Established Food & Beverage Industry: Extensive infrastructure for product development and fortification.
- Significant Investment in R&D: Continuous innovation in fortificant delivery systems and bioavailability.
- Strong Demand in Baby Food: Essential fortification for infant development drives market size.
Within the Types segment, Vitamins constitute the largest share, estimated at XX% of the global market value in 2025. This is due to their critical role in numerous bodily functions and their widespread inclusion in various food categories. However, Folic Acid is experiencing particularly rapid growth due to its proven benefits in preventing neural tube defects, leading to mandatory fortification in many countries. The growth potential in emerging economies, such as Asia-Pacific, is substantial, driven by increasing disposable incomes, urbanization, and a growing focus on improving public health and addressing micronutrient deficiencies. As these economies mature, the demand for fortified products, especially in the Other application segment encompassing functional foods and beverages, is expected to surge.
Food Grade Fortificants Product Landscape
The product landscape of Food Grade Fortificants is dynamic, with continuous innovation focused on enhancing bioavailability, stability, and sensory profiles. Key advancements include microencapsulation technologies that protect sensitive nutrients from degradation during processing and storage, leading to improved shelf life and efficacy. Companies are developing novel delivery systems for vitamins and minerals, ensuring better absorption and targeted release within the body. For instance, chelated minerals offer superior absorption compared to their inorganic counterparts. The application of fortificants extends beyond traditional staples to encompass a wide array of functional foods, beverages, and dietary supplements, catering to specific health needs such as immune support, bone health, and cognitive function. The performance metrics are increasingly focused on scientific validation of health benefits and seamless integration into food matrices without compromising taste or texture.
Key Drivers, Barriers & Challenges in Food Grade Fortificants
Key Drivers:
- Increasing Health & Wellness Trends: Growing consumer demand for nutrient-dense foods and beverages.
- Rising Prevalence of Micronutrient Deficiencies: Public health initiatives and government mandates for fortification.
- Advancements in Fortification Technologies: Improved bioavailability, stability, and delivery systems.
- Growth of the Baby Food and Patient Food Segments: Essential role of fortificants in specialized nutrition.
- Expanding Functional Food Market: Integration of fortificants into innovative food products.
Barriers & Challenges:
- Regulatory Hurdles: Navigating diverse and evolving food safety and labeling regulations across regions.
- Cost of Raw Materials & Production: Fluctuations in ingredient prices and manufacturing complexities.
- Consumer Acceptance & Taste Perception: Ensuring fortificants do not negatively impact the sensory attributes of food products.
- Supply Chain Disruptions: Geopolitical factors, natural disasters, and logistics challenges impacting ingredient availability.
- Competition from Alternative Nutritional Solutions: The broad market for dietary supplements and functional ingredients.
Emerging Opportunities in Food Grade Fortificants
Emerging opportunities lie in the development of personalized nutrition solutions, where fortificants can be tailored to meet specific individual dietary needs and health goals. The untapped potential in plant-based food fortification presents a significant avenue for growth, addressing the nutritional gaps often found in these diets. Furthermore, the expanding market for fortified pet food, driven by owners seeking to provide optimal nutrition for their animals, offers a niche but growing opportunity. Innovations in bio-fortification and fermentation-based nutrient production are also poised to create novel and sustainable fortificant sources. The Other application segment, encompassing nutraceuticals and specialized dietary supplements, is expected to witness substantial growth driven by these emerging trends.
Growth Accelerators in the Food Grade Fortificants Industry
Long-term growth in the Food Grade Fortificants industry will be significantly accelerated by ongoing technological breakthroughs in nutrient delivery systems, such as nanotechnology and time-release formulations, enhancing the efficacy and consumer experience. Strategic partnerships between fortificant manufacturers and food & beverage giants will drive market penetration and product innovation, leading to wider adoption of fortified products. Furthermore, market expansion into underserved regions, coupled with supportive government policies promoting fortification for public health, will act as potent catalysts. The increasing demand for clean-label and sustainably sourced fortificants will also shape product development and create new market segments.
Key Players Shaping the Food Grade Fortificants Market
- Vitablend
- Stern Ingredients India
- WATSON-INC
- Glanbia Nutritionals
- Nederland
- Wright
- Fuerst Day Lawson
- Coalescence
- Hexagon Nutrition
- Fermenta Biotech
- Jubilant Life Sciences
- LycoRed
- Pristine Organics
- BASF SE
Notable Milestones in Food Grade Fortificants Sector
- 2019: Launch of enhanced bioavailability Vitamin D formulations by Glanbia Nutritionals, addressing growing demand for immune support.
- 2020: BASF SE introduced a new range of encapsulated iron fortificants with improved palatability and reduced metallic taste, targeting the bakery segment.
- 2021: Jubilant Life Sciences expanded its presence in the Asian market with a new production facility for specialized vitamin premixes.
- 2022: WATSON-INC announced significant investment in R&D for novel mineral fortification techniques, focusing on enhanced absorption.
- 2023: Hexagon Nutrition partnered with a leading infant formula manufacturer to develop custom fortificant solutions.
- 2024: Fermenta Biotech launched a sustainable, plant-derived Vitamin E fortificant, aligning with growing consumer preference for natural ingredients.
In-Depth Food Grade Fortificants Market Outlook
The outlook for the Food Grade Fortificants market is exceptionally promising, driven by the persistent and growing global emphasis on health and nutrition. Growth accelerators, including continuous technological advancements in bioavailability and delivery systems, coupled with strategic collaborations between ingredient suppliers and major food manufacturers, will significantly expand market reach and product innovation. The increasing implementation of public health policies mandating fortification in key regions, particularly for essential micronutrients, will create sustained demand. Furthermore, the burgeoning demand for functional foods and beverages, alongside the expanding baby food and patient nutrition sectors, offers substantial untapped potential. The market is well-positioned for sustained growth, fueled by evolving consumer preferences for healthier, nutrient-enriched food options.
Food Grade Fortificants Segmentation
-
1. Application
- 1.1. Baby Food
- 1.2. Patient Food
- 1.3. Other
-
2. Types
- 2.1. Folic Acid
- 2.2. Vitamins
- 2.3. Other
Food Grade Fortificants Segmentation By Geography
-
1. North America
- 1.1. United States
- 1.2. Canada
- 1.3. Mexico
-
2. South America
- 2.1. Brazil
- 2.2. Argentina
- 2.3. Rest of South America
-
3. Europe
- 3.1. United Kingdom
- 3.2. Germany
- 3.3. France
- 3.4. Italy
- 3.5. Spain
- 3.6. Russia
- 3.7. Benelux
- 3.8. Nordics
- 3.9. Rest of Europe
-
4. Middle East & Africa
- 4.1. Turkey
- 4.2. Israel
- 4.3. GCC
- 4.4. North Africa
- 4.5. South Africa
- 4.6. Rest of Middle East & Africa
-
5. Asia Pacific
- 5.1. China
- 5.2. India
- 5.3. Japan
- 5.4. South Korea
- 5.5. ASEAN
- 5.6. Oceania
- 5.7. Rest of Asia Pacific
Food Grade Fortificants REPORT HIGHLIGHTS
| Aspects | Details |
|---|---|
| Study Period | 2019-2033 |
| Base Year | 2024 |
| Estimated Year | 2025 |
| Forecast Period | 2025-2033 |
| Historical Period | 2019-2024 |
| Growth Rate | CAGR of XX% from 2019-2033 |
| Segmentation |
|
Table of Contents
- 1. Introduction
- 1.1. Research Scope
- 1.2. Market Segmentation
- 1.3. Research Methodology
- 1.4. Definitions and Assumptions
- 2. Executive Summary
- 2.1. Introduction
- 3. Market Dynamics
- 3.1. Introduction
- 3.2. Market Drivers
- 3.3. Market Restrains
- 3.4. Market Trends
- 4. Market Factor Analysis
- 4.1. Porters Five Forces
- 4.2. Supply/Value Chain
- 4.3. PESTEL analysis
- 4.4. Market Entropy
- 4.5. Patent/Trademark Analysis
- 5. Global Food Grade Fortificants Analysis, Insights and Forecast, 2019-2031
- 5.1. Market Analysis, Insights and Forecast - by Application
- 5.1.1. Baby Food
- 5.1.2. Patient Food
- 5.1.3. Other
- 5.2. Market Analysis, Insights and Forecast - by Types
- 5.2.1. Folic Acid
- 5.2.2. Vitamins
- 5.2.3. Other
- 5.3. Market Analysis, Insights and Forecast - by Region
- 5.3.1. North America
- 5.3.2. South America
- 5.3.3. Europe
- 5.3.4. Middle East & Africa
- 5.3.5. Asia Pacific
- 5.1. Market Analysis, Insights and Forecast - by Application
- 6. North America Food Grade Fortificants Analysis, Insights and Forecast, 2019-2031
- 6.1. Market Analysis, Insights and Forecast - by Application
- 6.1.1. Baby Food
- 6.1.2. Patient Food
- 6.1.3. Other
- 6.2. Market Analysis, Insights and Forecast - by Types
- 6.2.1. Folic Acid
- 6.2.2. Vitamins
- 6.2.3. Other
- 6.1. Market Analysis, Insights and Forecast - by Application
- 7. South America Food Grade Fortificants Analysis, Insights and Forecast, 2019-2031
- 7.1. Market Analysis, Insights and Forecast - by Application
- 7.1.1. Baby Food
- 7.1.2. Patient Food
- 7.1.3. Other
- 7.2. Market Analysis, Insights and Forecast - by Types
- 7.2.1. Folic Acid
- 7.2.2. Vitamins
- 7.2.3. Other
- 7.1. Market Analysis, Insights and Forecast - by Application
- 8. Europe Food Grade Fortificants Analysis, Insights and Forecast, 2019-2031
- 8.1. Market Analysis, Insights and Forecast - by Application
- 8.1.1. Baby Food
- 8.1.2. Patient Food
- 8.1.3. Other
- 8.2. Market Analysis, Insights and Forecast - by Types
- 8.2.1. Folic Acid
- 8.2.2. Vitamins
- 8.2.3. Other
- 8.1. Market Analysis, Insights and Forecast - by Application
- 9. Middle East & Africa Food Grade Fortificants Analysis, Insights and Forecast, 2019-2031
- 9.1. Market Analysis, Insights and Forecast - by Application
- 9.1.1. Baby Food
- 9.1.2. Patient Food
- 9.1.3. Other
- 9.2. Market Analysis, Insights and Forecast - by Types
- 9.2.1. Folic Acid
- 9.2.2. Vitamins
- 9.2.3. Other
- 9.1. Market Analysis, Insights and Forecast - by Application
- 10. Asia Pacific Food Grade Fortificants Analysis, Insights and Forecast, 2019-2031
- 10.1. Market Analysis, Insights and Forecast - by Application
- 10.1.1. Baby Food
- 10.1.2. Patient Food
- 10.1.3. Other
- 10.2. Market Analysis, Insights and Forecast - by Types
- 10.2.1. Folic Acid
- 10.2.2. Vitamins
- 10.2.3. Other
- 10.1. Market Analysis, Insights and Forecast - by Application
- 11. Competitive Analysis
- 11.1. Global Market Share Analysis 2024
- 11.2. Company Profiles
- 11.2.1 Vitablend
- 11.2.1.1. Overview
- 11.2.1.2. Products
- 11.2.1.3. SWOT Analysis
- 11.2.1.4. Recent Developments
- 11.2.1.5. Financials (Based on Availability)
- 11.2.2 Stern Ingredients India
- 11.2.2.1. Overview
- 11.2.2.2. Products
- 11.2.2.3. SWOT Analysis
- 11.2.2.4. Recent Developments
- 11.2.2.5. Financials (Based on Availability)
- 11.2.3 WATSON-INC
- 11.2.3.1. Overview
- 11.2.3.2. Products
- 11.2.3.3. SWOT Analysis
- 11.2.3.4. Recent Developments
- 11.2.3.5. Financials (Based on Availability)
- 11.2.4 Glanbia Nutritionals
- 11.2.4.1. Overview
- 11.2.4.2. Products
- 11.2.4.3. SWOT Analysis
- 11.2.4.4. Recent Developments
- 11.2.4.5. Financials (Based on Availability)
- 11.2.5 Nederland
- 11.2.5.1. Overview
- 11.2.5.2. Products
- 11.2.5.3. SWOT Analysis
- 11.2.5.4. Recent Developments
- 11.2.5.5. Financials (Based on Availability)
- 11.2.6 Wright
- 11.2.6.1. Overview
- 11.2.6.2. Products
- 11.2.6.3. SWOT Analysis
- 11.2.6.4. Recent Developments
- 11.2.6.5. Financials (Based on Availability)
- 11.2.7 Fuerst Day Lawson
- 11.2.7.1. Overview
- 11.2.7.2. Products
- 11.2.7.3. SWOT Analysis
- 11.2.7.4. Recent Developments
- 11.2.7.5. Financials (Based on Availability)
- 11.2.8 Coalescence
- 11.2.8.1. Overview
- 11.2.8.2. Products
- 11.2.8.3. SWOT Analysis
- 11.2.8.4. Recent Developments
- 11.2.8.5. Financials (Based on Availability)
- 11.2.9 Hexagon Nutrition
- 11.2.9.1. Overview
- 11.2.9.2. Products
- 11.2.9.3. SWOT Analysis
- 11.2.9.4. Recent Developments
- 11.2.9.5. Financials (Based on Availability)
- 11.2.10 Fermenta Biotech
- 11.2.10.1. Overview
- 11.2.10.2. Products
- 11.2.10.3. SWOT Analysis
- 11.2.10.4. Recent Developments
- 11.2.10.5. Financials (Based on Availability)
- 11.2.11 Jubilant Life Sciences
- 11.2.11.1. Overview
- 11.2.11.2. Products
- 11.2.11.3. SWOT Analysis
- 11.2.11.4. Recent Developments
- 11.2.11.5. Financials (Based on Availability)
- 11.2.12 LycoRed
- 11.2.12.1. Overview
- 11.2.12.2. Products
- 11.2.12.3. SWOT Analysis
- 11.2.12.4. Recent Developments
- 11.2.12.5. Financials (Based on Availability)
- 11.2.13 Pristine Organics
- 11.2.13.1. Overview
- 11.2.13.2. Products
- 11.2.13.3. SWOT Analysis
- 11.2.13.4. Recent Developments
- 11.2.13.5. Financials (Based on Availability)
- 11.2.14 BASF SE
- 11.2.14.1. Overview
- 11.2.14.2. Products
- 11.2.14.3. SWOT Analysis
- 11.2.14.4. Recent Developments
- 11.2.14.5. Financials (Based on Availability)
- 11.2.1 Vitablend
List of Figures
- Figure 1: Global Food Grade Fortificants Revenue Breakdown (million, %) by Region 2024 & 2032
- Figure 2: North America Food Grade Fortificants Revenue (million), by Application 2024 & 2032
- Figure 3: North America Food Grade Fortificants Revenue Share (%), by Application 2024 & 2032
- Figure 4: North America Food Grade Fortificants Revenue (million), by Types 2024 & 2032
- Figure 5: North America Food Grade Fortificants Revenue Share (%), by Types 2024 & 2032
- Figure 6: North America Food Grade Fortificants Revenue (million), by Country 2024 & 2032
- Figure 7: North America Food Grade Fortificants Revenue Share (%), by Country 2024 & 2032
- Figure 8: South America Food Grade Fortificants Revenue (million), by Application 2024 & 2032
- Figure 9: South America Food Grade Fortificants Revenue Share (%), by Application 2024 & 2032
- Figure 10: South America Food Grade Fortificants Revenue (million), by Types 2024 & 2032
- Figure 11: South America Food Grade Fortificants Revenue Share (%), by Types 2024 & 2032
- Figure 12: South America Food Grade Fortificants Revenue (million), by Country 2024 & 2032
- Figure 13: South America Food Grade Fortificants Revenue Share (%), by Country 2024 & 2032
- Figure 14: Europe Food Grade Fortificants Revenue (million), by Application 2024 & 2032
- Figure 15: Europe Food Grade Fortificants Revenue Share (%), by Application 2024 & 2032
- Figure 16: Europe Food Grade Fortificants Revenue (million), by Types 2024 & 2032
- Figure 17: Europe Food Grade Fortificants Revenue Share (%), by Types 2024 & 2032
- Figure 18: Europe Food Grade Fortificants Revenue (million), by Country 2024 & 2032
- Figure 19: Europe Food Grade Fortificants Revenue Share (%), by Country 2024 & 2032
- Figure 20: Middle East & Africa Food Grade Fortificants Revenue (million), by Application 2024 & 2032
- Figure 21: Middle East & Africa Food Grade Fortificants Revenue Share (%), by Application 2024 & 2032
- Figure 22: Middle East & Africa Food Grade Fortificants Revenue (million), by Types 2024 & 2032
- Figure 23: Middle East & Africa Food Grade Fortificants Revenue Share (%), by Types 2024 & 2032
- Figure 24: Middle East & Africa Food Grade Fortificants Revenue (million), by Country 2024 & 2032
- Figure 25: Middle East & Africa Food Grade Fortificants Revenue Share (%), by Country 2024 & 2032
- Figure 26: Asia Pacific Food Grade Fortificants Revenue (million), by Application 2024 & 2032
- Figure 27: Asia Pacific Food Grade Fortificants Revenue Share (%), by Application 2024 & 2032
- Figure 28: Asia Pacific Food Grade Fortificants Revenue (million), by Types 2024 & 2032
- Figure 29: Asia Pacific Food Grade Fortificants Revenue Share (%), by Types 2024 & 2032
- Figure 30: Asia Pacific Food Grade Fortificants Revenue (million), by Country 2024 & 2032
- Figure 31: Asia Pacific Food Grade Fortificants Revenue Share (%), by Country 2024 & 2032
List of Tables
- Table 1: Global Food Grade Fortificants Revenue million Forecast, by Region 2019 & 2032
- Table 2: Global Food Grade Fortificants Revenue million Forecast, by Application 2019 & 2032
- Table 3: Global Food Grade Fortificants Revenue million Forecast, by Types 2019 & 2032
- Table 4: Global Food Grade Fortificants Revenue million Forecast, by Region 2019 & 2032
- Table 5: Global Food Grade Fortificants Revenue million Forecast, by Application 2019 & 2032
- Table 6: Global Food Grade Fortificants Revenue million Forecast, by Types 2019 & 2032
- Table 7: Global Food Grade Fortificants Revenue million Forecast, by Country 2019 & 2032
- Table 8: United States Food Grade Fortificants Revenue (million) Forecast, by Application 2019 & 2032
- Table 9: Canada Food Grade Fortificants Revenue (million) Forecast, by Application 2019 & 2032
- Table 10: Mexico Food Grade Fortificants Revenue (million) Forecast, by Application 2019 & 2032
- Table 11: Global Food Grade Fortificants Revenue million Forecast, by Application 2019 & 2032
- Table 12: Global Food Grade Fortificants Revenue million Forecast, by Types 2019 & 2032
- Table 13: Global Food Grade Fortificants Revenue million Forecast, by Country 2019 & 2032
- Table 14: Brazil Food Grade Fortificants Revenue (million) Forecast, by Application 2019 & 2032
- Table 15: Argentina Food Grade Fortificants Revenue (million) Forecast, by Application 2019 & 2032
- Table 16: Rest of South America Food Grade Fortificants Revenue (million) Forecast, by Application 2019 & 2032
- Table 17: Global Food Grade Fortificants Revenue million Forecast, by Application 2019 & 2032
- Table 18: Global Food Grade Fortificants Revenue million Forecast, by Types 2019 & 2032
- Table 19: Global Food Grade Fortificants Revenue million Forecast, by Country 2019 & 2032
- Table 20: United Kingdom Food Grade Fortificants Revenue (million) Forecast, by Application 2019 & 2032
- Table 21: Germany Food Grade Fortificants Revenue (million) Forecast, by Application 2019 & 2032
- Table 22: France Food Grade Fortificants Revenue (million) Forecast, by Application 2019 & 2032
- Table 23: Italy Food Grade Fortificants Revenue (million) Forecast, by Application 2019 & 2032
- Table 24: Spain Food Grade Fortificants Revenue (million) Forecast, by Application 2019 & 2032
- Table 25: Russia Food Grade Fortificants Revenue (million) Forecast, by Application 2019 & 2032
- Table 26: Benelux Food Grade Fortificants Revenue (million) Forecast, by Application 2019 & 2032
- Table 27: Nordics Food Grade Fortificants Revenue (million) Forecast, by Application 2019 & 2032
- Table 28: Rest of Europe Food Grade Fortificants Revenue (million) Forecast, by Application 2019 & 2032
- Table 29: Global Food Grade Fortificants Revenue million Forecast, by Application 2019 & 2032
- Table 30: Global Food Grade Fortificants Revenue million Forecast, by Types 2019 & 2032
- Table 31: Global Food Grade Fortificants Revenue million Forecast, by Country 2019 & 2032
- Table 32: Turkey Food Grade Fortificants Revenue (million) Forecast, by Application 2019 & 2032
- Table 33: Israel Food Grade Fortificants Revenue (million) Forecast, by Application 2019 & 2032
- Table 34: GCC Food Grade Fortificants Revenue (million) Forecast, by Application 2019 & 2032
- Table 35: North Africa Food Grade Fortificants Revenue (million) Forecast, by Application 2019 & 2032
- Table 36: South Africa Food Grade Fortificants Revenue (million) Forecast, by Application 2019 & 2032
- Table 37: Rest of Middle East & Africa Food Grade Fortificants Revenue (million) Forecast, by Application 2019 & 2032
- Table 38: Global Food Grade Fortificants Revenue million Forecast, by Application 2019 & 2032
- Table 39: Global Food Grade Fortificants Revenue million Forecast, by Types 2019 & 2032
- Table 40: Global Food Grade Fortificants Revenue million Forecast, by Country 2019 & 2032
- Table 41: China Food Grade Fortificants Revenue (million) Forecast, by Application 2019 & 2032
- Table 42: India Food Grade Fortificants Revenue (million) Forecast, by Application 2019 & 2032
- Table 43: Japan Food Grade Fortificants Revenue (million) Forecast, by Application 2019 & 2032
- Table 44: South Korea Food Grade Fortificants Revenue (million) Forecast, by Application 2019 & 2032
- Table 45: ASEAN Food Grade Fortificants Revenue (million) Forecast, by Application 2019 & 2032
- Table 46: Oceania Food Grade Fortificants Revenue (million) Forecast, by Application 2019 & 2032
- Table 47: Rest of Asia Pacific Food Grade Fortificants Revenue (million) Forecast, by Application 2019 & 2032
Frequently Asked Questions
1. What is the projected Compound Annual Growth Rate (CAGR) of the Food Grade Fortificants?
The projected CAGR is approximately XX%.
2. Which companies are prominent players in the Food Grade Fortificants?
Key companies in the market include Vitablend, Stern Ingredients India, WATSON-INC, Glanbia Nutritionals, Nederland, Wright, Fuerst Day Lawson, Coalescence, Hexagon Nutrition, Fermenta Biotech, Jubilant Life Sciences, LycoRed, Pristine Organics, BASF SE.
3. What are the main segments of the Food Grade Fortificants?
The market segments include Application, Types.
4. Can you provide details about the market size?
The market size is estimated to be USD XXX million as of 2022.
5. What are some drivers contributing to market growth?
N/A
6. What are the notable trends driving market growth?
N/A
7. Are there any restraints impacting market growth?
N/A
8. Can you provide examples of recent developments in the market?
N/A
9. What pricing options are available for accessing the report?
Pricing options include single-user, multi-user, and enterprise licenses priced at USD 2900.00, USD 4350.00, and USD 5800.00 respectively.
10. Is the market size provided in terms of value or volume?
The market size is provided in terms of value, measured in million.
11. Are there any specific market keywords associated with the report?
Yes, the market keyword associated with the report is "Food Grade Fortificants," which aids in identifying and referencing the specific market segment covered.
12. How do I determine which pricing option suits my needs best?
The pricing options vary based on user requirements and access needs. Individual users may opt for single-user licenses, while businesses requiring broader access may choose multi-user or enterprise licenses for cost-effective access to the report.
13. Are there any additional resources or data provided in the Food Grade Fortificants report?
While the report offers comprehensive insights, it's advisable to review the specific contents or supplementary materials provided to ascertain if additional resources or data are available.
14. How can I stay updated on further developments or reports in the Food Grade Fortificants?
To stay informed about further developments, trends, and reports in the Food Grade Fortificants, consider subscribing to industry newsletters, following relevant companies and organizations, or regularly checking reputable industry news sources and publications.
Methodology
Step 1 - Identification of Relevant Samples Size from Population Database


Step 2 - Approaches for Defining Global Market Size (Value, Volume* & Price*)

Note*: In applicable scenarios
Step 3 - Data Sources
Primary Research
- Web Analytics
- Survey Reports
- Research Institute
- Latest Research Reports
- Opinion Leaders
Secondary Research
- Annual Reports
- White Paper
- Latest Press Release
- Industry Association
- Paid Database
- Investor Presentations

Step 4 - Data Triangulation
Involves using different sources of information in order to increase the validity of a study
These sources are likely to be stakeholders in a program - participants, other researchers, program staff, other community members, and so on.
Then we put all data in single framework & apply various statistical tools to find out the dynamic on the market.
During the analysis stage, feedback from the stakeholder groups would be compared to determine areas of agreement as well as areas of divergence
