

Key Insights
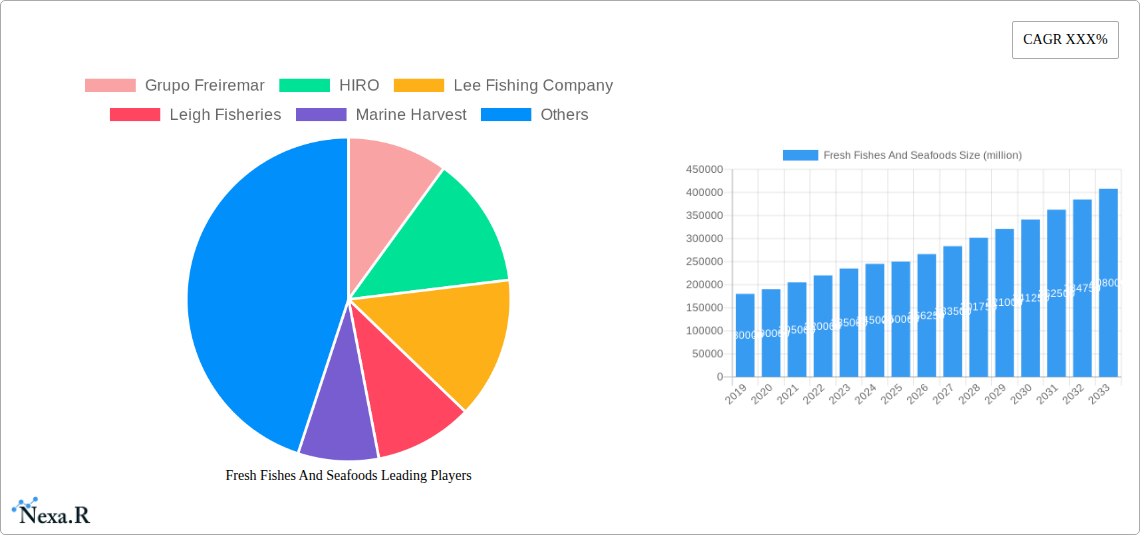
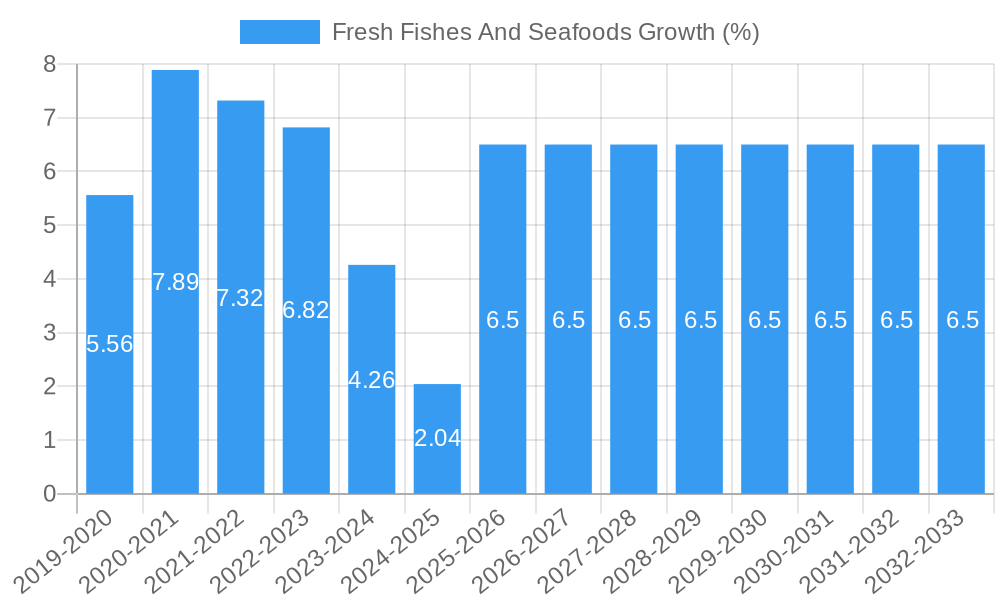
The global market for Fresh Fishes and Seafoods is experiencing robust growth, projected to reach a substantial market size of approximately $250 billion by 2025, with an estimated Compound Annual Growth Rate (CAGR) of 6.5% between 2025 and 2033. This upward trajectory is primarily driven by increasing consumer awareness regarding the health benefits of seafood, including its rich protein content and omega-3 fatty acid profile. Furthermore, a growing global population, coupled with rising disposable incomes, particularly in emerging economies, is fueling demand across various consumption channels. The market is segmenting effectively, with Supermarkets and Open Markets holding significant shares due to their accessibility and wide product offerings. Within product types, Fishes and Shellfishes constitute the dominant segments, catering to diverse culinary preferences. Key players like Morrisons, Tesco, and Marine Harvest are actively shaping the market through strategic expansions and product innovations, aiming to meet evolving consumer tastes for convenience and sustainability.
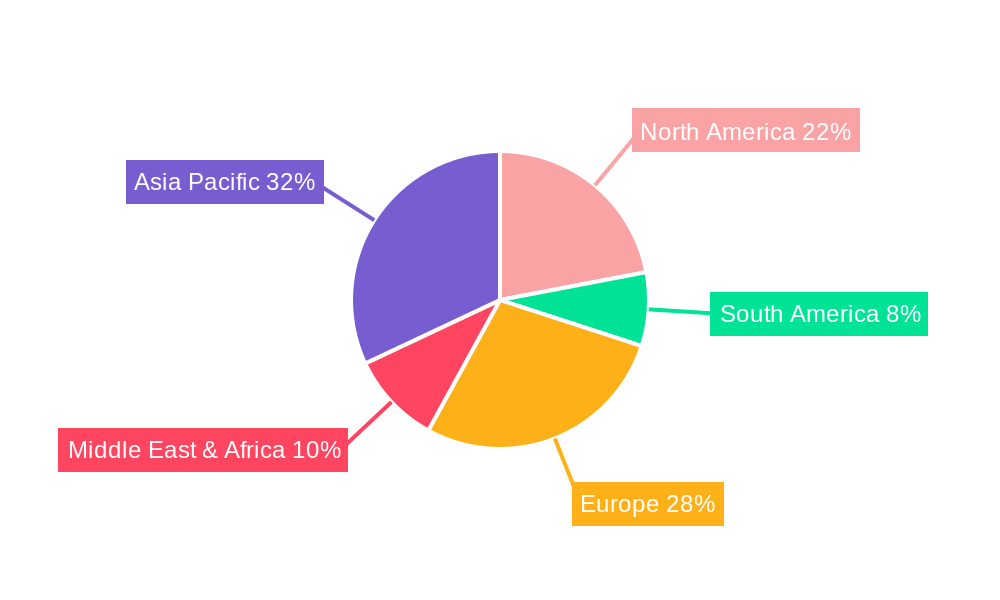
Despite the positive outlook, the market faces certain restraints, including fluctuating raw material prices due to climate change, overfishing concerns, and stringent regulatory frameworks governing seafood sourcing and safety. However, technological advancements in aquaculture, improved supply chain management, and a growing emphasis on sustainable fishing practices are mitigating these challenges. The Asia Pacific region is emerging as a powerhouse, driven by large populations and a traditional reliance on seafood, alongside significant growth in China and India. Europe and North America remain crucial markets, with established consumption patterns and a strong preference for high-quality, sustainably sourced seafood. The Middle East & Africa and South America represent significant growth opportunities, with increasing adoption of Western dietary habits and expanding retail infrastructure. The continued focus on premiumization, ready-to-cook seafood options, and online sales channels will further propel the market forward in the coming years.
Fresh Fishes And Seafoods Market: Comprehensive Industry Analysis Report (2019-2033)
This in-depth report provides a detailed analysis of the global Fresh Fishes and Seafoods market, offering critical insights into its dynamics, growth trajectories, and future outlook. Covering a comprehensive study period from 2019 to 2033, with a base year of 2025, this report is an indispensable resource for industry stakeholders, investors, and market researchers seeking to navigate the complexities and capitalize on the opportunities within this vital sector. We delve into market structure, growth trends, regional dominance, product landscape, key drivers and challenges, emerging opportunities, and the competitive strategies of leading players.
Fresh Fishes And Seafoods Market Dynamics & Structure
The global Fresh Fishes and Seafoods market exhibits a moderate to high concentration, with key players dominating significant portions of the supply chain. Technological innovation is a significant driver, focusing on improved preservation techniques, sustainable fishing practices, and advanced traceability systems. Regulatory frameworks, particularly concerning food safety, sustainability, and import/export regulations, play a crucial role in shaping market access and operational compliance. Competitive product substitutes, while present in the form of processed seafood or alternative protein sources, have limited impact on the core fresh segment due to consumer preference for quality and naturalness. End-user demographics are diverse, encompassing health-conscious consumers, culinary enthusiasts, and institutional buyers such as restaurants and catering services. Merger and acquisition (M&A) trends indicate a strategic consolidation, aimed at expanding market reach, securing supply chains, and acquiring innovative technologies. For instance, recent M&A activity has seen larger companies acquiring smaller, specialized seafood producers to enhance their product portfolios and geographical presence.
- Market Concentration: Dominated by a blend of large multinational corporations and regional specialists.
- Technological Innovation: Focus on cold chain logistics, aquaculture advancements, and digital traceability solutions.
- Regulatory Impact: Strict adherence to food safety (e.g., HACCP, BRC) and sustainability certifications (e.g., MSC, ASC) is paramount.
- Competitive Landscape: Limited direct substitutes for premium fresh offerings, but pressure from frozen and plant-based alternatives exists.
- End-User Segmentation: Growing demand from the health and wellness sector and the premium dining segment.
- M&A Activity: Strategic acquisitions for market expansion and vertical integration.
Fresh Fishes And Seafoods Growth Trends & Insights
The Fresh Fishes and Seafoods market has witnessed robust growth throughout the historical period (2019-2024) and is poised for sustained expansion. Market size evolution is a testament to increasing global demand for protein-rich foods and a growing awareness of the health benefits associated with seafood consumption. Adoption rates of sustainable sourcing and aquaculture practices are steadily rising, driven by consumer pressure and regulatory incentives. Technological disruptions, such as advanced freezing techniques, improved logistics, and online retail platforms, are significantly impacting accessibility and product quality. Consumer behavior shifts are characterized by a greater emphasis on provenance, sustainability, and traceability, leading to a premium placed on ethically sourced and transparently produced seafood. The estimated market size for 2025 stands at $185.5 million, with a projected Compound Annual Growth Rate (CAGR) of 7.2% during the forecast period of 2025–2033. This growth is further bolstered by the increasing penetration of fresh seafood in emerging economies and the expansion of direct-to-consumer models.
Dominant Regions, Countries, or Segments in Fresh Fishes And Seafoods
The Supermarkets segment, within the Application category, is currently the dominant force driving market growth for Fresh Fishes and Seafoods. This dominance is attributed to several key factors. Firstly, supermarkets offer unparalleled accessibility and convenience to a broad consumer base, making fresh seafood a readily available option for daily consumption. Secondly, the increasing focus of major supermarket chains on offering a diverse and high-quality selection of fresh produce, including a wide variety of fish and shellfish, has significantly boosted sales. This trend is further amplified by strategic in-store promotions, ready-to-cook seafood options, and partnerships with reputable seafood suppliers, enhancing consumer trust and purchase intent.
- Application Dominance: Supermarkets command a significant market share due to convenience and wide consumer reach.
- Market Share (Supermarkets): Estimated at 55.8% in 2025.
- Growth Potential: Moderate to high, driven by evolving consumer shopping habits and retailer focus on fresh offerings.
- Type Segmentation Insights: Fishes remain the largest sub-segment, but Shellfishes and Shrimps are experiencing rapid growth, particularly in premium markets.
- Fishes Market Share: Estimated at 48.9% in 2025.
- Shellfishes Market Share: Estimated at 28.3% in 2025, with a higher CAGR.
- Shrimps Market Share: Estimated at 19.1% in 2025, driven by aquaculture advancements.
- Regional Influence: Asia-Pacific, particularly countries like China and Japan, continues to be a major consumption hub for fresh seafood, influencing global supply chains. North America and Europe show strong demand for sustainably sourced and premium varieties.
- Economic Policies: Government initiatives promoting aquaculture development and sustainable fishing practices in key regions are significant growth enablers.
- Infrastructure Development: Investment in cold chain logistics and improved transportation networks are crucial for the efficient delivery of fresh seafood to market.
Fresh Fishes And Seafoods Product Landscape
The product landscape of the Fresh Fishes and Seafoods market is characterized by an increasing emphasis on value-added products and premium offerings. Innovations are focused on enhancing shelf life through advanced packaging technologies, such as modified atmosphere packaging (MAP) and vacuum sealing, without compromising freshness. The application of these products spans retail channels, directly reaching consumers through supermarkets and fish shops, as well as the foodservice industry. Performance metrics are primarily measured by freshness, quality, nutritional value, and traceability. Unique selling propositions often revolve around specific species, sustainable sourcing certifications, or regional specialties. Technological advancements in aquaculture, such as selective breeding and disease management, are also contributing to higher quality and more consistent product availability.
Key Drivers, Barriers & Challenges in Fresh Fishes And Seafoods
Key Drivers:
- Growing Health Consciousness: Increased consumer awareness of the health benefits of omega-3 fatty acids and lean protein found in fish and seafood.
- Rising Disposable Incomes: Particularly in emerging economies, leading to greater demand for premium food products like fresh seafood.
- Technological Advancements: Improved aquaculture techniques, efficient cold chain logistics, and enhanced processing methods that maintain freshness and quality.
- Sustainable Sourcing Initiatives: Growing consumer preference and regulatory pressure for ethically and sustainably sourced seafood.
Barriers & Challenges:
- Supply Chain Volatility: Susceptibility to weather conditions, overfishing, and geopolitical issues that can disrupt supply and increase prices.
- Regulatory Hurdles: Stringent food safety regulations, import/export restrictions, and varying sustainability standards across different regions.
- Perishable Nature: The inherent perishability of fresh seafood necessitates sophisticated logistics and cold chain management, leading to higher operational costs.
- Competition from Alternatives: Increasing availability of plant-based protein alternatives and processed seafood products.
- Fluctuating Raw Material Prices: Volatility in the cost of feed for farmed seafood and fuel for fishing vessels impacts profitability.
Emerging Opportunities in Fresh Fishes And Seafoods
Emerging opportunities in the Fresh Fishes and Seafoods market are predominantly driven by evolving consumer preferences and technological advancements. The growing demand for ready-to-cook and value-added seafood products presents a significant avenue for growth, catering to busy lifestyles. Furthermore, the expansion of e-commerce platforms for fresh seafood, offering direct-to-consumer delivery, is unlocking new market potential and enhancing consumer accessibility. Innovative aquaculture technologies, such as land-based recirculating aquaculture systems (RAS), offer the potential for more controlled and sustainable production, reducing reliance on wild catch and minimizing environmental impact. The increasing interest in traceable and transparent supply chains also opens doors for premium branding and marketing strategies focused on provenance and sustainability.
Growth Accelerators in the Fresh Fishes And Seafoods Industry
The Fresh Fishes and Seafoods industry is being propelled by several key growth accelerators. Technological breakthroughs in aquaculture, including genetic improvements and disease prevention, are enhancing yield and sustainability. Strategic partnerships between fishing cooperatives, processing companies, and retail chains are streamlining supply chains and improving market access. Furthermore, market expansion strategies, such as the development of new product lines catering to specific dietary needs or culinary preferences, are broadening consumer appeal. The increasing global demand for sustainable and ethically sourced seafood is also a significant accelerator, driving investment in certifications and responsible fishing practices.
Key Players Shaping the Fresh Fishes And Seafoods Market
- Grupo Freiremar
- HIRO
- Lee Fishing Company
- Leigh Fisheries
- Marine Harvest
- Morrisons
- Seattle Fish Company
- Tesco
- True World Foods
- All Seas Wholesale
Notable Milestones in Fresh Fishes And Seafoods Sector
- 2019: Increased adoption of traceability technologies, leveraging blockchain for supply chain transparency.
- 2020: Surge in online seafood sales due to pandemic-related restrictions, accelerating e-commerce adoption.
- 2021: Growing emphasis on sustainable aquaculture certifications (e.g., ASC) and responsible fishing practices.
- 2022: Innovations in extended shelf-life technologies and advanced packaging solutions gain traction.
- 2023: Significant M&A activity aimed at consolidating market share and expanding product portfolios in key regions.
- 2024: Increased investment in land-based aquaculture systems for localized and controlled production.
In-Depth Fresh Fishes And Seafoods Market Outlook
The future market potential for Fresh Fishes and Seafoods remains exceptionally strong, fueled by a confluence of expanding global populations, rising health consciousness, and a growing appreciation for sustainable and ethically sourced products. Strategic opportunities lie in further leveraging e-commerce channels for direct-to-consumer sales and expanding the availability of convenient, value-added seafood products. Continuous innovation in aquaculture and fishing technologies will be critical to ensuring a consistent and sustainable supply. The increasing demand for transparency and traceability will continue to shape consumer purchasing decisions, creating opportunities for brands that prioritize these aspects. Overall, the industry is poised for sustained growth, driven by both evolving consumer preferences and proactive industry strategies.
Fresh Fishes And Seafoods Segmentation
-
1. Application
- 1.1. Supermarkets
- 1.2. Open Markets
- 1.3. Fish Shops
-
2. Type
- 2.1. Fishes
- 2.2. Shellfishes
- 2.3. Shrimps
- 2.4. Others
Fresh Fishes And Seafoods Segmentation By Geography
-
1. North America
- 1.1. United States
- 1.2. Canada
- 1.3. Mexico
-
2. South America
- 2.1. Brazil
- 2.2. Argentina
- 2.3. Rest of South America
-
3. Europe
- 3.1. United Kingdom
- 3.2. Germany
- 3.3. France
- 3.4. Italy
- 3.5. Spain
- 3.6. Russia
- 3.7. Benelux
- 3.8. Nordics
- 3.9. Rest of Europe
-
4. Middle East & Africa
- 4.1. Turkey
- 4.2. Israel
- 4.3. GCC
- 4.4. North Africa
- 4.5. South Africa
- 4.6. Rest of Middle East & Africa
-
5. Asia Pacific
- 5.1. China
- 5.2. India
- 5.3. Japan
- 5.4. South Korea
- 5.5. ASEAN
- 5.6. Oceania
- 5.7. Rest of Asia Pacific
Fresh Fishes And Seafoods REPORT HIGHLIGHTS
| Aspects | Details |
|---|---|
| Study Period | 2019-2033 |
| Base Year | 2024 |
| Estimated Year | 2025 |
| Forecast Period | 2025-2033 |
| Historical Period | 2019-2024 |
| Growth Rate | CAGR of XXX% from 2019-2033 |
| Segmentation |
|
Table of Contents
- 1. Introduction
- 1.1. Research Scope
- 1.2. Market Segmentation
- 1.3. Research Methodology
- 1.4. Definitions and Assumptions
- 2. Executive Summary
- 2.1. Introduction
- 3. Market Dynamics
- 3.1. Introduction
- 3.2. Market Drivers
- 3.3. Market Restrains
- 3.4. Market Trends
- 4. Market Factor Analysis
- 4.1. Porters Five Forces
- 4.2. Supply/Value Chain
- 4.3. PESTEL analysis
- 4.4. Market Entropy
- 4.5. Patent/Trademark Analysis
- 5. Global Fresh Fishes And Seafoods Analysis, Insights and Forecast, 2019-2031
- 5.1. Market Analysis, Insights and Forecast - by Application
- 5.1.1. Supermarkets
- 5.1.2. Open Markets
- 5.1.3. Fish Shops
- 5.2. Market Analysis, Insights and Forecast - by Type
- 5.2.1. Fishes
- 5.2.2. Shellfishes
- 5.2.3. Shrimps
- 5.2.4. Others
- 5.3. Market Analysis, Insights and Forecast - by Region
- 5.3.1. North America
- 5.3.2. South America
- 5.3.3. Europe
- 5.3.4. Middle East & Africa
- 5.3.5. Asia Pacific
- 5.1. Market Analysis, Insights and Forecast - by Application
- 6. North America Fresh Fishes And Seafoods Analysis, Insights and Forecast, 2019-2031
- 6.1. Market Analysis, Insights and Forecast - by Application
- 6.1.1. Supermarkets
- 6.1.2. Open Markets
- 6.1.3. Fish Shops
- 6.2. Market Analysis, Insights and Forecast - by Type
- 6.2.1. Fishes
- 6.2.2. Shellfishes
- 6.2.3. Shrimps
- 6.2.4. Others
- 6.1. Market Analysis, Insights and Forecast - by Application
- 7. South America Fresh Fishes And Seafoods Analysis, Insights and Forecast, 2019-2031
- 7.1. Market Analysis, Insights and Forecast - by Application
- 7.1.1. Supermarkets
- 7.1.2. Open Markets
- 7.1.3. Fish Shops
- 7.2. Market Analysis, Insights and Forecast - by Type
- 7.2.1. Fishes
- 7.2.2. Shellfishes
- 7.2.3. Shrimps
- 7.2.4. Others
- 7.1. Market Analysis, Insights and Forecast - by Application
- 8. Europe Fresh Fishes And Seafoods Analysis, Insights and Forecast, 2019-2031
- 8.1. Market Analysis, Insights and Forecast - by Application
- 8.1.1. Supermarkets
- 8.1.2. Open Markets
- 8.1.3. Fish Shops
- 8.2. Market Analysis, Insights and Forecast - by Type
- 8.2.1. Fishes
- 8.2.2. Shellfishes
- 8.2.3. Shrimps
- 8.2.4. Others
- 8.1. Market Analysis, Insights and Forecast - by Application
- 9. Middle East & Africa Fresh Fishes And Seafoods Analysis, Insights and Forecast, 2019-2031
- 9.1. Market Analysis, Insights and Forecast - by Application
- 9.1.1. Supermarkets
- 9.1.2. Open Markets
- 9.1.3. Fish Shops
- 9.2. Market Analysis, Insights and Forecast - by Type
- 9.2.1. Fishes
- 9.2.2. Shellfishes
- 9.2.3. Shrimps
- 9.2.4. Others
- 9.1. Market Analysis, Insights and Forecast - by Application
- 10. Asia Pacific Fresh Fishes And Seafoods Analysis, Insights and Forecast, 2019-2031
- 10.1. Market Analysis, Insights and Forecast - by Application
- 10.1.1. Supermarkets
- 10.1.2. Open Markets
- 10.1.3. Fish Shops
- 10.2. Market Analysis, Insights and Forecast - by Type
- 10.2.1. Fishes
- 10.2.2. Shellfishes
- 10.2.3. Shrimps
- 10.2.4. Others
- 10.1. Market Analysis, Insights and Forecast - by Application
- 11. Competitive Analysis
- 11.1. Global Market Share Analysis 2024
- 11.2. Company Profiles
- 11.2.1 Grupo Freiremar
- 11.2.1.1. Overview
- 11.2.1.2. Products
- 11.2.1.3. SWOT Analysis
- 11.2.1.4. Recent Developments
- 11.2.1.5. Financials (Based on Availability)
- 11.2.2 HIRO
- 11.2.2.1. Overview
- 11.2.2.2. Products
- 11.2.2.3. SWOT Analysis
- 11.2.2.4. Recent Developments
- 11.2.2.5. Financials (Based on Availability)
- 11.2.3 Lee Fishing Company
- 11.2.3.1. Overview
- 11.2.3.2. Products
- 11.2.3.3. SWOT Analysis
- 11.2.3.4. Recent Developments
- 11.2.3.5. Financials (Based on Availability)
- 11.2.4 Leigh Fisheries
- 11.2.4.1. Overview
- 11.2.4.2. Products
- 11.2.4.3. SWOT Analysis
- 11.2.4.4. Recent Developments
- 11.2.4.5. Financials (Based on Availability)
- 11.2.5 Marine Harvest
- 11.2.5.1. Overview
- 11.2.5.2. Products
- 11.2.5.3. SWOT Analysis
- 11.2.5.4. Recent Developments
- 11.2.5.5. Financials (Based on Availability)
- 11.2.6 Morrisons
- 11.2.6.1. Overview
- 11.2.6.2. Products
- 11.2.6.3. SWOT Analysis
- 11.2.6.4. Recent Developments
- 11.2.6.5. Financials (Based on Availability)
- 11.2.7 Seattle Fish Company
- 11.2.7.1. Overview
- 11.2.7.2. Products
- 11.2.7.3. SWOT Analysis
- 11.2.7.4. Recent Developments
- 11.2.7.5. Financials (Based on Availability)
- 11.2.8 Tesco
- 11.2.8.1. Overview
- 11.2.8.2. Products
- 11.2.8.3. SWOT Analysis
- 11.2.8.4. Recent Developments
- 11.2.8.5. Financials (Based on Availability)
- 11.2.9 True World Foods
- 11.2.9.1. Overview
- 11.2.9.2. Products
- 11.2.9.3. SWOT Analysis
- 11.2.9.4. Recent Developments
- 11.2.9.5. Financials (Based on Availability)
- 11.2.10 All Seas Wholesale
- 11.2.10.1. Overview
- 11.2.10.2. Products
- 11.2.10.3. SWOT Analysis
- 11.2.10.4. Recent Developments
- 11.2.10.5. Financials (Based on Availability)
- 11.2.1 Grupo Freiremar
List of Figures
- Figure 1: Global Fresh Fishes And Seafoods Revenue Breakdown (million, %) by Region 2024 & 2032
- Figure 2: Global Fresh Fishes And Seafoods Volume Breakdown (K, %) by Region 2024 & 2032
- Figure 3: North America Fresh Fishes And Seafoods Revenue (million), by Application 2024 & 2032
- Figure 4: North America Fresh Fishes And Seafoods Volume (K), by Application 2024 & 2032
- Figure 5: North America Fresh Fishes And Seafoods Revenue Share (%), by Application 2024 & 2032
- Figure 6: North America Fresh Fishes And Seafoods Volume Share (%), by Application 2024 & 2032
- Figure 7: North America Fresh Fishes And Seafoods Revenue (million), by Type 2024 & 2032
- Figure 8: North America Fresh Fishes And Seafoods Volume (K), by Type 2024 & 2032
- Figure 9: North America Fresh Fishes And Seafoods Revenue Share (%), by Type 2024 & 2032
- Figure 10: North America Fresh Fishes And Seafoods Volume Share (%), by Type 2024 & 2032
- Figure 11: North America Fresh Fishes And Seafoods Revenue (million), by Country 2024 & 2032
- Figure 12: North America Fresh Fishes And Seafoods Volume (K), by Country 2024 & 2032
- Figure 13: North America Fresh Fishes And Seafoods Revenue Share (%), by Country 2024 & 2032
- Figure 14: North America Fresh Fishes And Seafoods Volume Share (%), by Country 2024 & 2032
- Figure 15: South America Fresh Fishes And Seafoods Revenue (million), by Application 2024 & 2032
- Figure 16: South America Fresh Fishes And Seafoods Volume (K), by Application 2024 & 2032
- Figure 17: South America Fresh Fishes And Seafoods Revenue Share (%), by Application 2024 & 2032
- Figure 18: South America Fresh Fishes And Seafoods Volume Share (%), by Application 2024 & 2032
- Figure 19: South America Fresh Fishes And Seafoods Revenue (million), by Type 2024 & 2032
- Figure 20: South America Fresh Fishes And Seafoods Volume (K), by Type 2024 & 2032
- Figure 21: South America Fresh Fishes And Seafoods Revenue Share (%), by Type 2024 & 2032
- Figure 22: South America Fresh Fishes And Seafoods Volume Share (%), by Type 2024 & 2032
- Figure 23: South America Fresh Fishes And Seafoods Revenue (million), by Country 2024 & 2032
- Figure 24: South America Fresh Fishes And Seafoods Volume (K), by Country 2024 & 2032
- Figure 25: South America Fresh Fishes And Seafoods Revenue Share (%), by Country 2024 & 2032
- Figure 26: South America Fresh Fishes And Seafoods Volume Share (%), by Country 2024 & 2032
- Figure 27: Europe Fresh Fishes And Seafoods Revenue (million), by Application 2024 & 2032
- Figure 28: Europe Fresh Fishes And Seafoods Volume (K), by Application 2024 & 2032
- Figure 29: Europe Fresh Fishes And Seafoods Revenue Share (%), by Application 2024 & 2032
- Figure 30: Europe Fresh Fishes And Seafoods Volume Share (%), by Application 2024 & 2032
- Figure 31: Europe Fresh Fishes And Seafoods Revenue (million), by Type 2024 & 2032
- Figure 32: Europe Fresh Fishes And Seafoods Volume (K), by Type 2024 & 2032
- Figure 33: Europe Fresh Fishes And Seafoods Revenue Share (%), by Type 2024 & 2032
- Figure 34: Europe Fresh Fishes And Seafoods Volume Share (%), by Type 2024 & 2032
- Figure 35: Europe Fresh Fishes And Seafoods Revenue (million), by Country 2024 & 2032
- Figure 36: Europe Fresh Fishes And Seafoods Volume (K), by Country 2024 & 2032
- Figure 37: Europe Fresh Fishes And Seafoods Revenue Share (%), by Country 2024 & 2032
- Figure 38: Europe Fresh Fishes And Seafoods Volume Share (%), by Country 2024 & 2032
- Figure 39: Middle East & Africa Fresh Fishes And Seafoods Revenue (million), by Application 2024 & 2032
- Figure 40: Middle East & Africa Fresh Fishes And Seafoods Volume (K), by Application 2024 & 2032
- Figure 41: Middle East & Africa Fresh Fishes And Seafoods Revenue Share (%), by Application 2024 & 2032
- Figure 42: Middle East & Africa Fresh Fishes And Seafoods Volume Share (%), by Application 2024 & 2032
- Figure 43: Middle East & Africa Fresh Fishes And Seafoods Revenue (million), by Type 2024 & 2032
- Figure 44: Middle East & Africa Fresh Fishes And Seafoods Volume (K), by Type 2024 & 2032
- Figure 45: Middle East & Africa Fresh Fishes And Seafoods Revenue Share (%), by Type 2024 & 2032
- Figure 46: Middle East & Africa Fresh Fishes And Seafoods Volume Share (%), by Type 2024 & 2032
- Figure 47: Middle East & Africa Fresh Fishes And Seafoods Revenue (million), by Country 2024 & 2032
- Figure 48: Middle East & Africa Fresh Fishes And Seafoods Volume (K), by Country 2024 & 2032
- Figure 49: Middle East & Africa Fresh Fishes And Seafoods Revenue Share (%), by Country 2024 & 2032
- Figure 50: Middle East & Africa Fresh Fishes And Seafoods Volume Share (%), by Country 2024 & 2032
- Figure 51: Asia Pacific Fresh Fishes And Seafoods Revenue (million), by Application 2024 & 2032
- Figure 52: Asia Pacific Fresh Fishes And Seafoods Volume (K), by Application 2024 & 2032
- Figure 53: Asia Pacific Fresh Fishes And Seafoods Revenue Share (%), by Application 2024 & 2032
- Figure 54: Asia Pacific Fresh Fishes And Seafoods Volume Share (%), by Application 2024 & 2032
- Figure 55: Asia Pacific Fresh Fishes And Seafoods Revenue (million), by Type 2024 & 2032
- Figure 56: Asia Pacific Fresh Fishes And Seafoods Volume (K), by Type 2024 & 2032
- Figure 57: Asia Pacific Fresh Fishes And Seafoods Revenue Share (%), by Type 2024 & 2032
- Figure 58: Asia Pacific Fresh Fishes And Seafoods Volume Share (%), by Type 2024 & 2032
- Figure 59: Asia Pacific Fresh Fishes And Seafoods Revenue (million), by Country 2024 & 2032
- Figure 60: Asia Pacific Fresh Fishes And Seafoods Volume (K), by Country 2024 & 2032
- Figure 61: Asia Pacific Fresh Fishes And Seafoods Revenue Share (%), by Country 2024 & 2032
- Figure 62: Asia Pacific Fresh Fishes And Seafoods Volume Share (%), by Country 2024 & 2032
List of Tables
- Table 1: Global Fresh Fishes And Seafoods Revenue million Forecast, by Region 2019 & 2032
- Table 2: Global Fresh Fishes And Seafoods Volume K Forecast, by Region 2019 & 2032
- Table 3: Global Fresh Fishes And Seafoods Revenue million Forecast, by Application 2019 & 2032
- Table 4: Global Fresh Fishes And Seafoods Volume K Forecast, by Application 2019 & 2032
- Table 5: Global Fresh Fishes And Seafoods Revenue million Forecast, by Type 2019 & 2032
- Table 6: Global Fresh Fishes And Seafoods Volume K Forecast, by Type 2019 & 2032
- Table 7: Global Fresh Fishes And Seafoods Revenue million Forecast, by Region 2019 & 2032
- Table 8: Global Fresh Fishes And Seafoods Volume K Forecast, by Region 2019 & 2032
- Table 9: Global Fresh Fishes And Seafoods Revenue million Forecast, by Application 2019 & 2032
- Table 10: Global Fresh Fishes And Seafoods Volume K Forecast, by Application 2019 & 2032
- Table 11: Global Fresh Fishes And Seafoods Revenue million Forecast, by Type 2019 & 2032
- Table 12: Global Fresh Fishes And Seafoods Volume K Forecast, by Type 2019 & 2032
- Table 13: Global Fresh Fishes And Seafoods Revenue million Forecast, by Country 2019 & 2032
- Table 14: Global Fresh Fishes And Seafoods Volume K Forecast, by Country 2019 & 2032
- Table 15: United States Fresh Fishes And Seafoods Revenue (million) Forecast, by Application 2019 & 2032
- Table 16: United States Fresh Fishes And Seafoods Volume (K) Forecast, by Application 2019 & 2032
- Table 17: Canada Fresh Fishes And Seafoods Revenue (million) Forecast, by Application 2019 & 2032
- Table 18: Canada Fresh Fishes And Seafoods Volume (K) Forecast, by Application 2019 & 2032
- Table 19: Mexico Fresh Fishes And Seafoods Revenue (million) Forecast, by Application 2019 & 2032
- Table 20: Mexico Fresh Fishes And Seafoods Volume (K) Forecast, by Application 2019 & 2032
- Table 21: Global Fresh Fishes And Seafoods Revenue million Forecast, by Application 2019 & 2032
- Table 22: Global Fresh Fishes And Seafoods Volume K Forecast, by Application 2019 & 2032
- Table 23: Global Fresh Fishes And Seafoods Revenue million Forecast, by Type 2019 & 2032
- Table 24: Global Fresh Fishes And Seafoods Volume K Forecast, by Type 2019 & 2032
- Table 25: Global Fresh Fishes And Seafoods Revenue million Forecast, by Country 2019 & 2032
- Table 26: Global Fresh Fishes And Seafoods Volume K Forecast, by Country 2019 & 2032
- Table 27: Brazil Fresh Fishes And Seafoods Revenue (million) Forecast, by Application 2019 & 2032
- Table 28: Brazil Fresh Fishes And Seafoods Volume (K) Forecast, by Application 2019 & 2032
- Table 29: Argentina Fresh Fishes And Seafoods Revenue (million) Forecast, by Application 2019 & 2032
- Table 30: Argentina Fresh Fishes And Seafoods Volume (K) Forecast, by Application 2019 & 2032
- Table 31: Rest of South America Fresh Fishes And Seafoods Revenue (million) Forecast, by Application 2019 & 2032
- Table 32: Rest of South America Fresh Fishes And Seafoods Volume (K) Forecast, by Application 2019 & 2032
- Table 33: Global Fresh Fishes And Seafoods Revenue million Forecast, by Application 2019 & 2032
- Table 34: Global Fresh Fishes And Seafoods Volume K Forecast, by Application 2019 & 2032
- Table 35: Global Fresh Fishes And Seafoods Revenue million Forecast, by Type 2019 & 2032
- Table 36: Global Fresh Fishes And Seafoods Volume K Forecast, by Type 2019 & 2032
- Table 37: Global Fresh Fishes And Seafoods Revenue million Forecast, by Country 2019 & 2032
- Table 38: Global Fresh Fishes And Seafoods Volume K Forecast, by Country 2019 & 2032
- Table 39: United Kingdom Fresh Fishes And Seafoods Revenue (million) Forecast, by Application 2019 & 2032
- Table 40: United Kingdom Fresh Fishes And Seafoods Volume (K) Forecast, by Application 2019 & 2032
- Table 41: Germany Fresh Fishes And Seafoods Revenue (million) Forecast, by Application 2019 & 2032
- Table 42: Germany Fresh Fishes And Seafoods Volume (K) Forecast, by Application 2019 & 2032
- Table 43: France Fresh Fishes And Seafoods Revenue (million) Forecast, by Application 2019 & 2032
- Table 44: France Fresh Fishes And Seafoods Volume (K) Forecast, by Application 2019 & 2032
- Table 45: Italy Fresh Fishes And Seafoods Revenue (million) Forecast, by Application 2019 & 2032
- Table 46: Italy Fresh Fishes And Seafoods Volume (K) Forecast, by Application 2019 & 2032
- Table 47: Spain Fresh Fishes And Seafoods Revenue (million) Forecast, by Application 2019 & 2032
- Table 48: Spain Fresh Fishes And Seafoods Volume (K) Forecast, by Application 2019 & 2032
- Table 49: Russia Fresh Fishes And Seafoods Revenue (million) Forecast, by Application 2019 & 2032
- Table 50: Russia Fresh Fishes And Seafoods Volume (K) Forecast, by Application 2019 & 2032
- Table 51: Benelux Fresh Fishes And Seafoods Revenue (million) Forecast, by Application 2019 & 2032
- Table 52: Benelux Fresh Fishes And Seafoods Volume (K) Forecast, by Application 2019 & 2032
- Table 53: Nordics Fresh Fishes And Seafoods Revenue (million) Forecast, by Application 2019 & 2032
- Table 54: Nordics Fresh Fishes And Seafoods Volume (K) Forecast, by Application 2019 & 2032
- Table 55: Rest of Europe Fresh Fishes And Seafoods Revenue (million) Forecast, by Application 2019 & 2032
- Table 56: Rest of Europe Fresh Fishes And Seafoods Volume (K) Forecast, by Application 2019 & 2032
- Table 57: Global Fresh Fishes And Seafoods Revenue million Forecast, by Application 2019 & 2032
- Table 58: Global Fresh Fishes And Seafoods Volume K Forecast, by Application 2019 & 2032
- Table 59: Global Fresh Fishes And Seafoods Revenue million Forecast, by Type 2019 & 2032
- Table 60: Global Fresh Fishes And Seafoods Volume K Forecast, by Type 2019 & 2032
- Table 61: Global Fresh Fishes And Seafoods Revenue million Forecast, by Country 2019 & 2032
- Table 62: Global Fresh Fishes And Seafoods Volume K Forecast, by Country 2019 & 2032
- Table 63: Turkey Fresh Fishes And Seafoods Revenue (million) Forecast, by Application 2019 & 2032
- Table 64: Turkey Fresh Fishes And Seafoods Volume (K) Forecast, by Application 2019 & 2032
- Table 65: Israel Fresh Fishes And Seafoods Revenue (million) Forecast, by Application 2019 & 2032
- Table 66: Israel Fresh Fishes And Seafoods Volume (K) Forecast, by Application 2019 & 2032
- Table 67: GCC Fresh Fishes And Seafoods Revenue (million) Forecast, by Application 2019 & 2032
- Table 68: GCC Fresh Fishes And Seafoods Volume (K) Forecast, by Application 2019 & 2032
- Table 69: North Africa Fresh Fishes And Seafoods Revenue (million) Forecast, by Application 2019 & 2032
- Table 70: North Africa Fresh Fishes And Seafoods Volume (K) Forecast, by Application 2019 & 2032
- Table 71: South Africa Fresh Fishes And Seafoods Revenue (million) Forecast, by Application 2019 & 2032
- Table 72: South Africa Fresh Fishes And Seafoods Volume (K) Forecast, by Application 2019 & 2032
- Table 73: Rest of Middle East & Africa Fresh Fishes And Seafoods Revenue (million) Forecast, by Application 2019 & 2032
- Table 74: Rest of Middle East & Africa Fresh Fishes And Seafoods Volume (K) Forecast, by Application 2019 & 2032
- Table 75: Global Fresh Fishes And Seafoods Revenue million Forecast, by Application 2019 & 2032
- Table 76: Global Fresh Fishes And Seafoods Volume K Forecast, by Application 2019 & 2032
- Table 77: Global Fresh Fishes And Seafoods Revenue million Forecast, by Type 2019 & 2032
- Table 78: Global Fresh Fishes And Seafoods Volume K Forecast, by Type 2019 & 2032
- Table 79: Global Fresh Fishes And Seafoods Revenue million Forecast, by Country 2019 & 2032
- Table 80: Global Fresh Fishes And Seafoods Volume K Forecast, by Country 2019 & 2032
- Table 81: China Fresh Fishes And Seafoods Revenue (million) Forecast, by Application 2019 & 2032
- Table 82: China Fresh Fishes And Seafoods Volume (K) Forecast, by Application 2019 & 2032
- Table 83: India Fresh Fishes And Seafoods Revenue (million) Forecast, by Application 2019 & 2032
- Table 84: India Fresh Fishes And Seafoods Volume (K) Forecast, by Application 2019 & 2032
- Table 85: Japan Fresh Fishes And Seafoods Revenue (million) Forecast, by Application 2019 & 2032
- Table 86: Japan Fresh Fishes And Seafoods Volume (K) Forecast, by Application 2019 & 2032
- Table 87: South Korea Fresh Fishes And Seafoods Revenue (million) Forecast, by Application 2019 & 2032
- Table 88: South Korea Fresh Fishes And Seafoods Volume (K) Forecast, by Application 2019 & 2032
- Table 89: ASEAN Fresh Fishes And Seafoods Revenue (million) Forecast, by Application 2019 & 2032
- Table 90: ASEAN Fresh Fishes And Seafoods Volume (K) Forecast, by Application 2019 & 2032
- Table 91: Oceania Fresh Fishes And Seafoods Revenue (million) Forecast, by Application 2019 & 2032
- Table 92: Oceania Fresh Fishes And Seafoods Volume (K) Forecast, by Application 2019 & 2032
- Table 93: Rest of Asia Pacific Fresh Fishes And Seafoods Revenue (million) Forecast, by Application 2019 & 2032
- Table 94: Rest of Asia Pacific Fresh Fishes And Seafoods Volume (K) Forecast, by Application 2019 & 2032
Frequently Asked Questions
1. What is the projected Compound Annual Growth Rate (CAGR) of the Fresh Fishes And Seafoods?
The projected CAGR is approximately XXX%.
2. Which companies are prominent players in the Fresh Fishes And Seafoods?
Key companies in the market include Grupo Freiremar, HIRO, Lee Fishing Company, Leigh Fisheries, Marine Harvest, Morrisons, Seattle Fish Company, Tesco, True World Foods, All Seas Wholesale.
3. What are the main segments of the Fresh Fishes And Seafoods?
The market segments include Application, Type.
4. Can you provide details about the market size?
The market size is estimated to be USD XXX million as of 2022.
5. What are some drivers contributing to market growth?
N/A
6. What are the notable trends driving market growth?
N/A
7. Are there any restraints impacting market growth?
N/A
8. Can you provide examples of recent developments in the market?
N/A
9. What pricing options are available for accessing the report?
Pricing options include single-user, multi-user, and enterprise licenses priced at USD 3950.00, USD 5925.00, and USD 7900.00 respectively.
10. Is the market size provided in terms of value or volume?
The market size is provided in terms of value, measured in million and volume, measured in K.
11. Are there any specific market keywords associated with the report?
Yes, the market keyword associated with the report is "Fresh Fishes And Seafoods," which aids in identifying and referencing the specific market segment covered.
12. How do I determine which pricing option suits my needs best?
The pricing options vary based on user requirements and access needs. Individual users may opt for single-user licenses, while businesses requiring broader access may choose multi-user or enterprise licenses for cost-effective access to the report.
13. Are there any additional resources or data provided in the Fresh Fishes And Seafoods report?
While the report offers comprehensive insights, it's advisable to review the specific contents or supplementary materials provided to ascertain if additional resources or data are available.
14. How can I stay updated on further developments or reports in the Fresh Fishes And Seafoods?
To stay informed about further developments, trends, and reports in the Fresh Fishes And Seafoods, consider subscribing to industry newsletters, following relevant companies and organizations, or regularly checking reputable industry news sources and publications.
Methodology
Step 1 - Identification of Relevant Samples Size from Population Database


Step 2 - Approaches for Defining Global Market Size (Value, Volume* & Price*)

Note*: In applicable scenarios
Step 3 - Data Sources
Primary Research
- Web Analytics
- Survey Reports
- Research Institute
- Latest Research Reports
- Opinion Leaders
Secondary Research
- Annual Reports
- White Paper
- Latest Press Release
- Industry Association
- Paid Database
- Investor Presentations

Step 4 - Data Triangulation
Involves using different sources of information in order to increase the validity of a study
These sources are likely to be stakeholders in a program - participants, other researchers, program staff, other community members, and so on.
Then we put all data in single framework & apply various statistical tools to find out the dynamic on the market.
During the analysis stage, feedback from the stakeholder groups would be compared to determine areas of agreement as well as areas of divergence
