

Key Insights
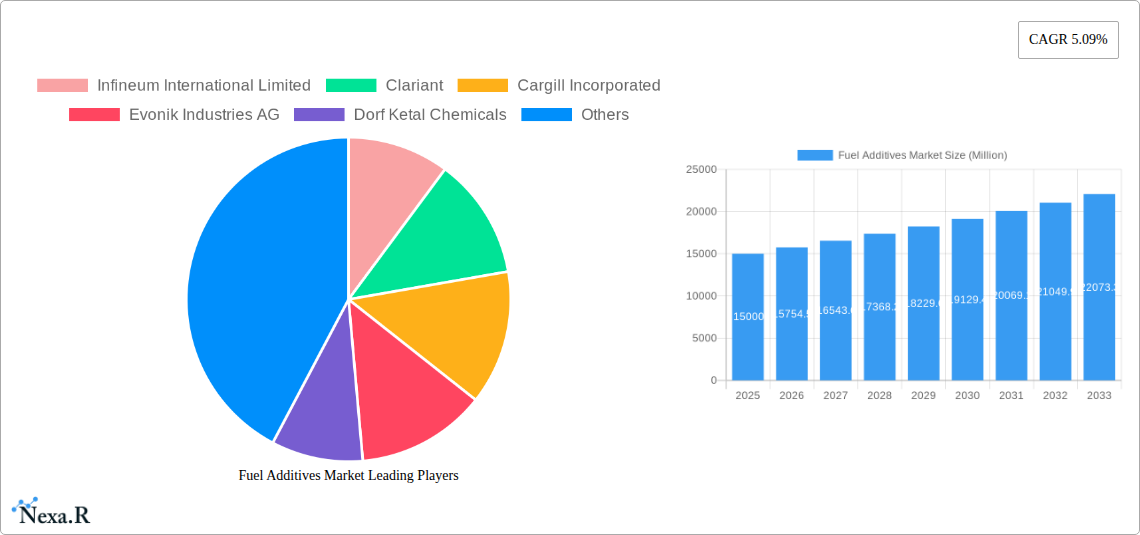
The global fuel additives market is experiencing robust growth, projected to reach a substantial size driven by increasing demand for improved fuel efficiency, stricter emission regulations, and the expanding automotive and aviation sectors. The market's Compound Annual Growth Rate (CAGR) of 5.09% from 2019 to 2024 suggests a consistent upward trajectory. Key drivers include the rising adoption of advanced fuel additives that enhance engine performance, extend engine lifespan, and minimize harmful emissions. The stringent environmental regulations globally, particularly in developed economies, are compelling manufacturers to incorporate fuel additives to meet compliance standards. Furthermore, the increasing penetration of vehicles and aircraft globally, especially in developing nations, further fuels market expansion. The market segmentation by application (diesel, gasoline, jet fuel, others) and product type (deposit control, cetane improvers, lubricity additives, antioxidants, anticorrosion, cold flow improvers, antiknock agents, others) highlights the diverse range of additive types tailored to specific fuel types and engine requirements. The competitive landscape, featuring major players like Infineum, Clariant, Cargill, and BASF, reflects the market's maturity and the significant investments in R&D to develop next-generation fuel additives.
The market's future growth will be influenced by several factors. Technological advancements in additive formulations are expected to create new opportunities, such as the development of bio-based fuel additives to reduce the environmental impact. However, fluctuating crude oil prices and potential economic downturns could act as restraints on market expansion. Regional variations in growth are anticipated, with developing economies in Asia-Pacific projected to experience faster growth compared to mature markets in North America and Europe due to rising vehicle sales and infrastructure development. The continued emphasis on sustainability and the transition towards cleaner fuels will likely shape product innovation and market penetration of eco-friendly fuel additives in the coming years. This growth will be further influenced by government incentives for cleaner energy and stricter enforcement of emission control standards.
Fuel Additives Market: A Comprehensive Report (2019-2033)
This comprehensive report provides an in-depth analysis of the global Fuel Additives Market, encompassing market dynamics, growth trends, regional dominance, product landscape, key players, and future outlook. The study period spans from 2019 to 2033, with 2025 serving as the base and estimated year. The report utilizes data from the historical period (2019-2024) to forecast market trends from 2025 to 2033, offering valuable insights for industry professionals and investors. The parent market is the Automotive Chemical Additives market, while the child market focuses specifically on Fuel Additives. Market values are presented in million units.
Fuel Additives Market Dynamics & Structure
The Fuel Additives market is moderately concentrated, with several major players holding significant market share. Technological innovation, particularly in areas like bio-based additives and enhanced performance characteristics, is a key driver. Stringent environmental regulations, especially concerning emissions, are shaping product development and adoption. Competition from alternative technologies and substitutes is present, but the overall demand remains strong due to the essential role fuel additives play in engine performance and longevity. Mergers and acquisitions (M&A) activity has been moderate, with companies focusing on expanding their geographic reach and product portfolios.
- Market Concentration: Moderately concentrated, with top 5 players holding approximately xx% market share in 2025.
- Technological Innovation: Focus on bio-based additives, improved fuel efficiency, and reduced emissions.
- Regulatory Framework: Stringent emission standards driving demand for advanced additives.
- Competitive Substitutes: Limited direct substitutes, but alternative technologies pose indirect competition.
- M&A Activity: Moderate level of M&A activity, focused on geographic expansion and product diversification. Approximately xx M&A deals occurred between 2019-2024.
- Innovation Barriers: High R&D costs and stringent regulatory approvals pose challenges.
Fuel Additives Market Growth Trends & Insights
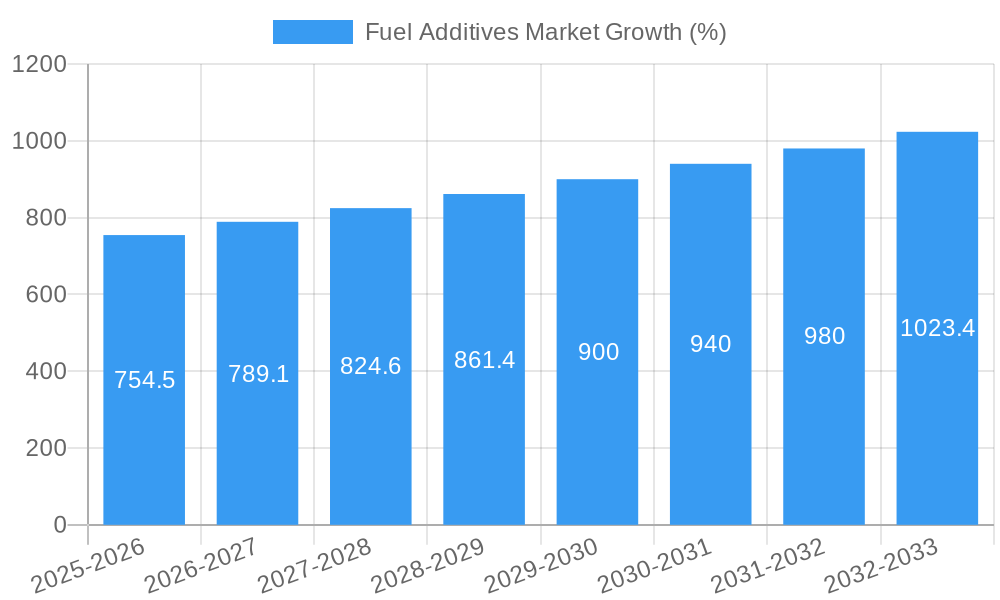
The global Fuel Additives market experienced a CAGR of xx% during the historical period (2019-2024) and is projected to maintain a CAGR of xx% during the forecast period (2025-2033), reaching a market size of xx million units by 2033. This growth is fueled by increasing vehicle ownership globally, especially in developing economies, coupled with stricter emission regulations driving demand for higher-performance additives. Technological advancements, such as the introduction of bio-based fuel additives and improved formulations for specific engine types, are also contributing factors. Consumer preferences are shifting towards enhanced fuel efficiency and reduced environmental impact, further boosting the demand for innovative fuel additives. Market penetration is expected to reach xx% by 2033, particularly within the Diesel and Gasoline segments.
Dominant Regions, Countries, or Segments in Fuel Additives Market
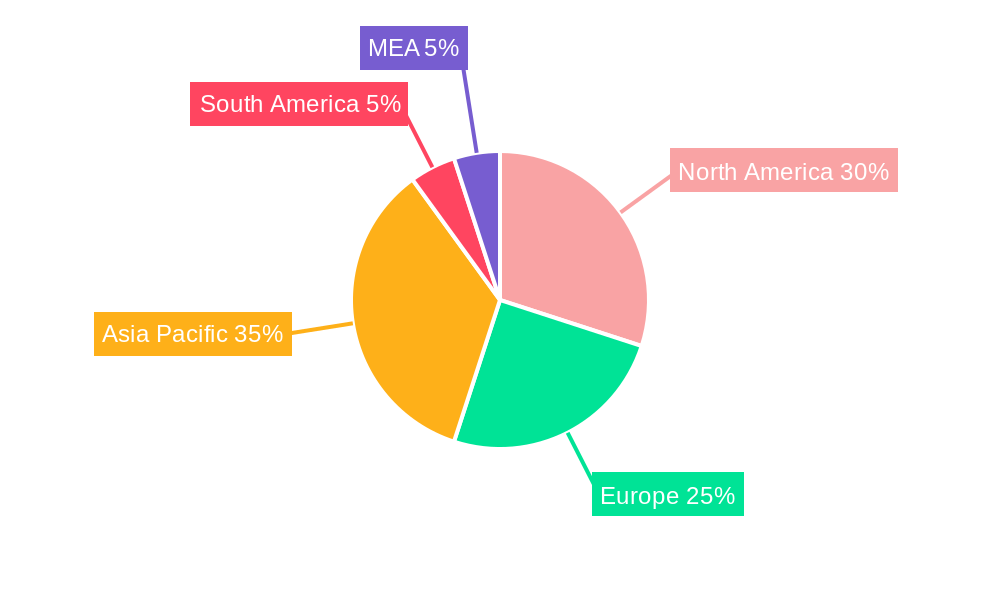
The Asia-Pacific region is currently the dominant market for fuel additives, driven by rapid economic growth, expanding vehicle ownership, and increasing industrialization. North America and Europe also hold significant market shares, fueled by stringent emission regulations and a well-established automotive industry. Within product types, Deposit Control and Cetane Improvers dominate the market, while the Diesel application segment exhibits the highest growth rate.
- Key Drivers in Asia-Pacific: Rapid economic growth, rising vehicle sales, and industrialization.
- Key Drivers in North America: Stringent emission regulations and well-established automotive industry.
- Key Drivers in Europe: Similar to North America, with a focus on sustainable transportation and environmental regulations.
- Dominant Product Type: Deposit Control and Cetane Improvers.
- Dominant Application: Diesel fuel.
Fuel Additives Market Product Landscape
The Fuel Additives market showcases a diverse product landscape with continuous innovation. Products are categorized by their function (e.g., deposit control, cetane improvement, lubricity enhancement) and target fuel type (diesel, gasoline, jet fuel). Recent advancements focus on bio-based formulations, improved performance at lower concentrations, and enhanced compatibility with emerging fuel technologies. Unique selling propositions often center around environmental benefits, cost-effectiveness, and improved engine performance.
Key Drivers, Barriers & Challenges in Fuel Additives Market
Key Drivers: Increasing vehicle sales globally, stringent emission regulations, demand for improved fuel efficiency, and technological advancements in additive formulations.
Challenges: Fluctuating crude oil prices, supply chain disruptions, stringent regulatory compliance, and intense competition among established players. These challenges can lead to price volatility and impact profit margins. The increasing pressure to develop sustainable, bio-based alternatives also presents both opportunities and complexities.
Emerging Opportunities in Fuel Additives Market
Untapped markets in developing economies, particularly in Africa and South America, represent significant growth potential. The rising demand for biofuels and alternative fuels creates opportunities for specialized additives. Furthermore, advancements in engine technology and the growing focus on reducing emissions are driving innovation in additive formulations. The development of highly efficient and environmentally friendly additives is an area of significant interest.
Growth Accelerators in the Fuel Additives Market Industry
Technological breakthroughs in additive chemistry are key growth catalysts, leading to higher efficiency and reduced environmental impact. Strategic partnerships and collaborations between additive manufacturers and fuel producers will further accelerate market growth. Expansion into emerging markets and the development of customized additive solutions for specific engine types and fuel formulations represent significant opportunities.
Key Players Shaping the Fuel Additives Market Market
- Infineum International Limited
- Clariant
- Cargill Incorporated
- Evonik Industries AG
- Dorf Ketal Chemicals
- BASF SE
- Chevron Corporation
- The Lubrizol Corporation
- Baker Hughes Company
- TotalEnergies SE
- Lanxess
- Innospec
- Afton Chemical
- Exxon Mobil corporation
Notable Milestones in Fuel Additives Market Sector
- March 2022: Afton Chemical Corporation completed the expansion of its phase 3 Singapore Chemical Additive Manufacturing Facility, enhancing its Asian supply chain solutions.
- April 2022: Afton Chemical launched Greenclean 3, an advanced diesel fuel detergent technology for heavy-duty fleets and off-road vehicles.
In-Depth Fuel Additives Market Market Outlook
The future of the Fuel Additives market is bright, driven by sustained growth in vehicle sales, the increasing adoption of advanced engine technologies, and the ongoing need to meet stringent emission standards. Strategic investments in R&D, focused on developing sustainable and high-performance additives, will be crucial for capturing market share and achieving long-term growth. The expanding focus on biofuels and alternative energy sources presents exciting opportunities for innovation and market expansion.
Fuel Additives Market Segmentation
-
1. Product Type
- 1.1. Deposit Control
- 1.2. Cetane Improvers
- 1.3. Lubricity Additives
- 1.4. Antioxidants
- 1.5. Anticorrosion
- 1.6. Cold Flow Improvers
- 1.7. Antiknock Agents
- 1.8. Other Product Types
-
2. Application
- 2.1. Diesel
- 2.2. Gasoline
- 2.3. Jet Fuel
- 2.4. Other Applications
Fuel Additives Market Segmentation By Geography
-
1. Asia Pacific
- 1.1. China
- 1.2. India
- 1.3. Japan
- 1.4. South Korea
- 1.5. Rest of Asia Pacific
-
2. North America
- 2.1. United States
- 2.2. Canada
-
3. Europe
- 3.1. Germany
- 3.2. France
- 3.3. United Kingdom
- 3.4. Italy
- 3.5. Rest of Europe
-
4. South America
- 4.1. Brazil
- 4.2. Mexico
- 4.3. Argentina
- 4.4. Rest of South America
-
5. Middle East and Africa
- 5.1. Saudi Arabia
- 5.2. South Africa
- 5.3. Rest of Middle East and Africa
Fuel Additives Market REPORT HIGHLIGHTS
| Aspects | Details |
|---|---|
| Study Period | 2019-2033 |
| Base Year | 2024 |
| Estimated Year | 2025 |
| Forecast Period | 2025-2033 |
| Historical Period | 2019-2024 |
| Growth Rate | CAGR of 5.09% from 2019-2033 |
| Segmentation |
|
Table of Contents
- 1. Introduction
- 1.1. Research Scope
- 1.2. Market Segmentation
- 1.3. Research Methodology
- 1.4. Definitions and Assumptions
- 2. Executive Summary
- 2.1. Introduction
- 3. Market Dynamics
- 3.1. Introduction
- 3.2. Market Drivers
- 3.2.1. Enactment of Stringent Environmental Regulations; Degrading Quality of Crude Oil
- 3.3. Market Restrains
- 3.3.1. Increasing Demand for Battery Electric Vehicles (BEVs); High Costs of R&D Activities
- 3.4. Market Trends
- 3.4.1. Gasoline to Dominate the Market Studied
- 4. Market Factor Analysis
- 4.1. Porters Five Forces
- 4.2. Supply/Value Chain
- 4.3. PESTEL analysis
- 4.4. Market Entropy
- 4.5. Patent/Trademark Analysis
- 5. Global Fuel Additives Market Analysis, Insights and Forecast, 2019-2031
- 5.1. Market Analysis, Insights and Forecast - by Product Type
- 5.1.1. Deposit Control
- 5.1.2. Cetane Improvers
- 5.1.3. Lubricity Additives
- 5.1.4. Antioxidants
- 5.1.5. Anticorrosion
- 5.1.6. Cold Flow Improvers
- 5.1.7. Antiknock Agents
- 5.1.8. Other Product Types
- 5.2. Market Analysis, Insights and Forecast - by Application
- 5.2.1. Diesel
- 5.2.2. Gasoline
- 5.2.3. Jet Fuel
- 5.2.4. Other Applications
- 5.3. Market Analysis, Insights and Forecast - by Region
- 5.3.1. Asia Pacific
- 5.3.2. North America
- 5.3.3. Europe
- 5.3.4. South America
- 5.3.5. Middle East and Africa
- 5.1. Market Analysis, Insights and Forecast - by Product Type
- 6. Asia Pacific Fuel Additives Market Analysis, Insights and Forecast, 2019-2031
- 6.1. Market Analysis, Insights and Forecast - by Product Type
- 6.1.1. Deposit Control
- 6.1.2. Cetane Improvers
- 6.1.3. Lubricity Additives
- 6.1.4. Antioxidants
- 6.1.5. Anticorrosion
- 6.1.6. Cold Flow Improvers
- 6.1.7. Antiknock Agents
- 6.1.8. Other Product Types
- 6.2. Market Analysis, Insights and Forecast - by Application
- 6.2.1. Diesel
- 6.2.2. Gasoline
- 6.2.3. Jet Fuel
- 6.2.4. Other Applications
- 6.1. Market Analysis, Insights and Forecast - by Product Type
- 7. North America Fuel Additives Market Analysis, Insights and Forecast, 2019-2031
- 7.1. Market Analysis, Insights and Forecast - by Product Type
- 7.1.1. Deposit Control
- 7.1.2. Cetane Improvers
- 7.1.3. Lubricity Additives
- 7.1.4. Antioxidants
- 7.1.5. Anticorrosion
- 7.1.6. Cold Flow Improvers
- 7.1.7. Antiknock Agents
- 7.1.8. Other Product Types
- 7.2. Market Analysis, Insights and Forecast - by Application
- 7.2.1. Diesel
- 7.2.2. Gasoline
- 7.2.3. Jet Fuel
- 7.2.4. Other Applications
- 7.1. Market Analysis, Insights and Forecast - by Product Type
- 8. Europe Fuel Additives Market Analysis, Insights and Forecast, 2019-2031
- 8.1. Market Analysis, Insights and Forecast - by Product Type
- 8.1.1. Deposit Control
- 8.1.2. Cetane Improvers
- 8.1.3. Lubricity Additives
- 8.1.4. Antioxidants
- 8.1.5. Anticorrosion
- 8.1.6. Cold Flow Improvers
- 8.1.7. Antiknock Agents
- 8.1.8. Other Product Types
- 8.2. Market Analysis, Insights and Forecast - by Application
- 8.2.1. Diesel
- 8.2.2. Gasoline
- 8.2.3. Jet Fuel
- 8.2.4. Other Applications
- 8.1. Market Analysis, Insights and Forecast - by Product Type
- 9. South America Fuel Additives Market Analysis, Insights and Forecast, 2019-2031
- 9.1. Market Analysis, Insights and Forecast - by Product Type
- 9.1.1. Deposit Control
- 9.1.2. Cetane Improvers
- 9.1.3. Lubricity Additives
- 9.1.4. Antioxidants
- 9.1.5. Anticorrosion
- 9.1.6. Cold Flow Improvers
- 9.1.7. Antiknock Agents
- 9.1.8. Other Product Types
- 9.2. Market Analysis, Insights and Forecast - by Application
- 9.2.1. Diesel
- 9.2.2. Gasoline
- 9.2.3. Jet Fuel
- 9.2.4. Other Applications
- 9.1. Market Analysis, Insights and Forecast - by Product Type
- 10. Middle East and Africa Fuel Additives Market Analysis, Insights and Forecast, 2019-2031
- 10.1. Market Analysis, Insights and Forecast - by Product Type
- 10.1.1. Deposit Control
- 10.1.2. Cetane Improvers
- 10.1.3. Lubricity Additives
- 10.1.4. Antioxidants
- 10.1.5. Anticorrosion
- 10.1.6. Cold Flow Improvers
- 10.1.7. Antiknock Agents
- 10.1.8. Other Product Types
- 10.2. Market Analysis, Insights and Forecast - by Application
- 10.2.1. Diesel
- 10.2.2. Gasoline
- 10.2.3. Jet Fuel
- 10.2.4. Other Applications
- 10.1. Market Analysis, Insights and Forecast - by Product Type
- 11. North America Fuel Additives Market Analysis, Insights and Forecast, 2019-2031
- 11.1. Market Analysis, Insights and Forecast - By Country/Sub-region
- 11.1.1 United States
- 11.1.2 Canada
- 11.1.3 Mexico
- 12. Europe Fuel Additives Market Analysis, Insights and Forecast, 2019-2031
- 12.1. Market Analysis, Insights and Forecast - By Country/Sub-region
- 12.1.1 Germany
- 12.1.2 United Kingdom
- 12.1.3 France
- 12.1.4 Spain
- 12.1.5 Italy
- 12.1.6 Spain
- 12.1.7 Belgium
- 12.1.8 Netherland
- 12.1.9 Nordics
- 12.1.10 Rest of Europe
- 13. Asia Pacific Fuel Additives Market Analysis, Insights and Forecast, 2019-2031
- 13.1. Market Analysis, Insights and Forecast - By Country/Sub-region
- 13.1.1 China
- 13.1.2 Japan
- 13.1.3 India
- 13.1.4 South Korea
- 13.1.5 Southeast Asia
- 13.1.6 Australia
- 13.1.7 Indonesia
- 13.1.8 Phillipes
- 13.1.9 Singapore
- 13.1.10 Thailandc
- 13.1.11 Rest of Asia Pacific
- 14. South America Fuel Additives Market Analysis, Insights and Forecast, 2019-2031
- 14.1. Market Analysis, Insights and Forecast - By Country/Sub-region
- 14.1.1 Brazil
- 14.1.2 Argentina
- 14.1.3 Peru
- 14.1.4 Chile
- 14.1.5 Colombia
- 14.1.6 Ecuador
- 14.1.7 Venezuela
- 14.1.8 Rest of South America
- 15. North America Fuel Additives Market Analysis, Insights and Forecast, 2019-2031
- 15.1. Market Analysis, Insights and Forecast - By Country/Sub-region
- 15.1.1 United States
- 15.1.2 Canada
- 15.1.3 Mexico
- 16. MEA Fuel Additives Market Analysis, Insights and Forecast, 2019-2031
- 16.1. Market Analysis, Insights and Forecast - By Country/Sub-region
- 16.1.1 United Arab Emirates
- 16.1.2 Saudi Arabia
- 16.1.3 South Africa
- 16.1.4 Rest of Middle East and Africa
- 17. Competitive Analysis
- 17.1. Global Market Share Analysis 2024
- 17.2. Company Profiles
- 17.2.1 Infineum International Limited
- 17.2.1.1. Overview
- 17.2.1.2. Products
- 17.2.1.3. SWOT Analysis
- 17.2.1.4. Recent Developments
- 17.2.1.5. Financials (Based on Availability)
- 17.2.2 Clariant
- 17.2.2.1. Overview
- 17.2.2.2. Products
- 17.2.2.3. SWOT Analysis
- 17.2.2.4. Recent Developments
- 17.2.2.5. Financials (Based on Availability)
- 17.2.3 Cargill Incorporated
- 17.2.3.1. Overview
- 17.2.3.2. Products
- 17.2.3.3. SWOT Analysis
- 17.2.3.4. Recent Developments
- 17.2.3.5. Financials (Based on Availability)
- 17.2.4 Evonik Industries AG
- 17.2.4.1. Overview
- 17.2.4.2. Products
- 17.2.4.3. SWOT Analysis
- 17.2.4.4. Recent Developments
- 17.2.4.5. Financials (Based on Availability)
- 17.2.5 Dorf Ketal Chemicals
- 17.2.5.1. Overview
- 17.2.5.2. Products
- 17.2.5.3. SWOT Analysis
- 17.2.5.4. Recent Developments
- 17.2.5.5. Financials (Based on Availability)
- 17.2.6 BASF SE
- 17.2.6.1. Overview
- 17.2.6.2. Products
- 17.2.6.3. SWOT Analysis
- 17.2.6.4. Recent Developments
- 17.2.6.5. Financials (Based on Availability)
- 17.2.7 Chevron Corporation
- 17.2.7.1. Overview
- 17.2.7.2. Products
- 17.2.7.3. SWOT Analysis
- 17.2.7.4. Recent Developments
- 17.2.7.5. Financials (Based on Availability)
- 17.2.8 The Lubrizol Corporation
- 17.2.8.1. Overview
- 17.2.8.2. Products
- 17.2.8.3. SWOT Analysis
- 17.2.8.4. Recent Developments
- 17.2.8.5. Financials (Based on Availability)
- 17.2.9 Baker Hughes Company
- 17.2.9.1. Overview
- 17.2.9.2. Products
- 17.2.9.3. SWOT Analysis
- 17.2.9.4. Recent Developments
- 17.2.9.5. Financials (Based on Availability)
- 17.2.10 TotalEnergies SE *List Not Exhaustive
- 17.2.10.1. Overview
- 17.2.10.2. Products
- 17.2.10.3. SWOT Analysis
- 17.2.10.4. Recent Developments
- 17.2.10.5. Financials (Based on Availability)
- 17.2.11 Lanxess
- 17.2.11.1. Overview
- 17.2.11.2. Products
- 17.2.11.3. SWOT Analysis
- 17.2.11.4. Recent Developments
- 17.2.11.5. Financials (Based on Availability)
- 17.2.12 Innospec
- 17.2.12.1. Overview
- 17.2.12.2. Products
- 17.2.12.3. SWOT Analysis
- 17.2.12.4. Recent Developments
- 17.2.12.5. Financials (Based on Availability)
- 17.2.13 Afton Chemical
- 17.2.13.1. Overview
- 17.2.13.2. Products
- 17.2.13.3. SWOT Analysis
- 17.2.13.4. Recent Developments
- 17.2.13.5. Financials (Based on Availability)
- 17.2.14 Exxon Mobil corporation
- 17.2.14.1. Overview
- 17.2.14.2. Products
- 17.2.14.3. SWOT Analysis
- 17.2.14.4. Recent Developments
- 17.2.14.5. Financials (Based on Availability)
- 17.2.1 Infineum International Limited
List of Figures
- Figure 1: Global Fuel Additives Market Revenue Breakdown (Million, %) by Region 2024 & 2032
- Figure 2: Global Fuel Additives Market Volume Breakdown (Million, %) by Region 2024 & 2032
- Figure 3: North America Fuel Additives Market Revenue (Million), by Country 2024 & 2032
- Figure 4: North America Fuel Additives Market Volume (Million), by Country 2024 & 2032
- Figure 5: North America Fuel Additives Market Revenue Share (%), by Country 2024 & 2032
- Figure 6: North America Fuel Additives Market Volume Share (%), by Country 2024 & 2032
- Figure 7: Europe Fuel Additives Market Revenue (Million), by Country 2024 & 2032
- Figure 8: Europe Fuel Additives Market Volume (Million), by Country 2024 & 2032
- Figure 9: Europe Fuel Additives Market Revenue Share (%), by Country 2024 & 2032
- Figure 10: Europe Fuel Additives Market Volume Share (%), by Country 2024 & 2032
- Figure 11: Asia Pacific Fuel Additives Market Revenue (Million), by Country 2024 & 2032
- Figure 12: Asia Pacific Fuel Additives Market Volume (Million), by Country 2024 & 2032
- Figure 13: Asia Pacific Fuel Additives Market Revenue Share (%), by Country 2024 & 2032
- Figure 14: Asia Pacific Fuel Additives Market Volume Share (%), by Country 2024 & 2032
- Figure 15: South America Fuel Additives Market Revenue (Million), by Country 2024 & 2032
- Figure 16: South America Fuel Additives Market Volume (Million), by Country 2024 & 2032
- Figure 17: South America Fuel Additives Market Revenue Share (%), by Country 2024 & 2032
- Figure 18: South America Fuel Additives Market Volume Share (%), by Country 2024 & 2032
- Figure 19: North America Fuel Additives Market Revenue (Million), by Country 2024 & 2032
- Figure 20: North America Fuel Additives Market Volume (Million), by Country 2024 & 2032
- Figure 21: North America Fuel Additives Market Revenue Share (%), by Country 2024 & 2032
- Figure 22: North America Fuel Additives Market Volume Share (%), by Country 2024 & 2032
- Figure 23: MEA Fuel Additives Market Revenue (Million), by Country 2024 & 2032
- Figure 24: MEA Fuel Additives Market Volume (Million), by Country 2024 & 2032
- Figure 25: MEA Fuel Additives Market Revenue Share (%), by Country 2024 & 2032
- Figure 26: MEA Fuel Additives Market Volume Share (%), by Country 2024 & 2032
- Figure 27: Asia Pacific Fuel Additives Market Revenue (Million), by Product Type 2024 & 2032
- Figure 28: Asia Pacific Fuel Additives Market Volume (Million), by Product Type 2024 & 2032
- Figure 29: Asia Pacific Fuel Additives Market Revenue Share (%), by Product Type 2024 & 2032
- Figure 30: Asia Pacific Fuel Additives Market Volume Share (%), by Product Type 2024 & 2032
- Figure 31: Asia Pacific Fuel Additives Market Revenue (Million), by Application 2024 & 2032
- Figure 32: Asia Pacific Fuel Additives Market Volume (Million), by Application 2024 & 2032
- Figure 33: Asia Pacific Fuel Additives Market Revenue Share (%), by Application 2024 & 2032
- Figure 34: Asia Pacific Fuel Additives Market Volume Share (%), by Application 2024 & 2032
- Figure 35: Asia Pacific Fuel Additives Market Revenue (Million), by Country 2024 & 2032
- Figure 36: Asia Pacific Fuel Additives Market Volume (Million), by Country 2024 & 2032
- Figure 37: Asia Pacific Fuel Additives Market Revenue Share (%), by Country 2024 & 2032
- Figure 38: Asia Pacific Fuel Additives Market Volume Share (%), by Country 2024 & 2032
- Figure 39: North America Fuel Additives Market Revenue (Million), by Product Type 2024 & 2032
- Figure 40: North America Fuel Additives Market Volume (Million), by Product Type 2024 & 2032
- Figure 41: North America Fuel Additives Market Revenue Share (%), by Product Type 2024 & 2032
- Figure 42: North America Fuel Additives Market Volume Share (%), by Product Type 2024 & 2032
- Figure 43: North America Fuel Additives Market Revenue (Million), by Application 2024 & 2032
- Figure 44: North America Fuel Additives Market Volume (Million), by Application 2024 & 2032
- Figure 45: North America Fuel Additives Market Revenue Share (%), by Application 2024 & 2032
- Figure 46: North America Fuel Additives Market Volume Share (%), by Application 2024 & 2032
- Figure 47: North America Fuel Additives Market Revenue (Million), by Country 2024 & 2032
- Figure 48: North America Fuel Additives Market Volume (Million), by Country 2024 & 2032
- Figure 49: North America Fuel Additives Market Revenue Share (%), by Country 2024 & 2032
- Figure 50: North America Fuel Additives Market Volume Share (%), by Country 2024 & 2032
- Figure 51: Europe Fuel Additives Market Revenue (Million), by Product Type 2024 & 2032
- Figure 52: Europe Fuel Additives Market Volume (Million), by Product Type 2024 & 2032
- Figure 53: Europe Fuel Additives Market Revenue Share (%), by Product Type 2024 & 2032
- Figure 54: Europe Fuel Additives Market Volume Share (%), by Product Type 2024 & 2032
- Figure 55: Europe Fuel Additives Market Revenue (Million), by Application 2024 & 2032
- Figure 56: Europe Fuel Additives Market Volume (Million), by Application 2024 & 2032
- Figure 57: Europe Fuel Additives Market Revenue Share (%), by Application 2024 & 2032
- Figure 58: Europe Fuel Additives Market Volume Share (%), by Application 2024 & 2032
- Figure 59: Europe Fuel Additives Market Revenue (Million), by Country 2024 & 2032
- Figure 60: Europe Fuel Additives Market Volume (Million), by Country 2024 & 2032
- Figure 61: Europe Fuel Additives Market Revenue Share (%), by Country 2024 & 2032
- Figure 62: Europe Fuel Additives Market Volume Share (%), by Country 2024 & 2032
- Figure 63: South America Fuel Additives Market Revenue (Million), by Product Type 2024 & 2032
- Figure 64: South America Fuel Additives Market Volume (Million), by Product Type 2024 & 2032
- Figure 65: South America Fuel Additives Market Revenue Share (%), by Product Type 2024 & 2032
- Figure 66: South America Fuel Additives Market Volume Share (%), by Product Type 2024 & 2032
- Figure 67: South America Fuel Additives Market Revenue (Million), by Application 2024 & 2032
- Figure 68: South America Fuel Additives Market Volume (Million), by Application 2024 & 2032
- Figure 69: South America Fuel Additives Market Revenue Share (%), by Application 2024 & 2032
- Figure 70: South America Fuel Additives Market Volume Share (%), by Application 2024 & 2032
- Figure 71: South America Fuel Additives Market Revenue (Million), by Country 2024 & 2032
- Figure 72: South America Fuel Additives Market Volume (Million), by Country 2024 & 2032
- Figure 73: South America Fuel Additives Market Revenue Share (%), by Country 2024 & 2032
- Figure 74: South America Fuel Additives Market Volume Share (%), by Country 2024 & 2032
- Figure 75: Middle East and Africa Fuel Additives Market Revenue (Million), by Product Type 2024 & 2032
- Figure 76: Middle East and Africa Fuel Additives Market Volume (Million), by Product Type 2024 & 2032
- Figure 77: Middle East and Africa Fuel Additives Market Revenue Share (%), by Product Type 2024 & 2032
- Figure 78: Middle East and Africa Fuel Additives Market Volume Share (%), by Product Type 2024 & 2032
- Figure 79: Middle East and Africa Fuel Additives Market Revenue (Million), by Application 2024 & 2032
- Figure 80: Middle East and Africa Fuel Additives Market Volume (Million), by Application 2024 & 2032
- Figure 81: Middle East and Africa Fuel Additives Market Revenue Share (%), by Application 2024 & 2032
- Figure 82: Middle East and Africa Fuel Additives Market Volume Share (%), by Application 2024 & 2032
- Figure 83: Middle East and Africa Fuel Additives Market Revenue (Million), by Country 2024 & 2032
- Figure 84: Middle East and Africa Fuel Additives Market Volume (Million), by Country 2024 & 2032
- Figure 85: Middle East and Africa Fuel Additives Market Revenue Share (%), by Country 2024 & 2032
- Figure 86: Middle East and Africa Fuel Additives Market Volume Share (%), by Country 2024 & 2032
List of Tables
- Table 1: Global Fuel Additives Market Revenue Million Forecast, by Region 2019 & 2032
- Table 2: Global Fuel Additives Market Volume Million Forecast, by Region 2019 & 2032
- Table 3: Global Fuel Additives Market Revenue Million Forecast, by Product Type 2019 & 2032
- Table 4: Global Fuel Additives Market Volume Million Forecast, by Product Type 2019 & 2032
- Table 5: Global Fuel Additives Market Revenue Million Forecast, by Application 2019 & 2032
- Table 6: Global Fuel Additives Market Volume Million Forecast, by Application 2019 & 2032
- Table 7: Global Fuel Additives Market Revenue Million Forecast, by Region 2019 & 2032
- Table 8: Global Fuel Additives Market Volume Million Forecast, by Region 2019 & 2032
- Table 9: Global Fuel Additives Market Revenue Million Forecast, by Country 2019 & 2032
- Table 10: Global Fuel Additives Market Volume Million Forecast, by Country 2019 & 2032
- Table 11: United States Fuel Additives Market Revenue (Million) Forecast, by Application 2019 & 2032
- Table 12: United States Fuel Additives Market Volume (Million) Forecast, by Application 2019 & 2032
- Table 13: Canada Fuel Additives Market Revenue (Million) Forecast, by Application 2019 & 2032
- Table 14: Canada Fuel Additives Market Volume (Million) Forecast, by Application 2019 & 2032
- Table 15: Mexico Fuel Additives Market Revenue (Million) Forecast, by Application 2019 & 2032
- Table 16: Mexico Fuel Additives Market Volume (Million) Forecast, by Application 2019 & 2032
- Table 17: Global Fuel Additives Market Revenue Million Forecast, by Country 2019 & 2032
- Table 18: Global Fuel Additives Market Volume Million Forecast, by Country 2019 & 2032
- Table 19: Germany Fuel Additives Market Revenue (Million) Forecast, by Application 2019 & 2032
- Table 20: Germany Fuel Additives Market Volume (Million) Forecast, by Application 2019 & 2032
- Table 21: United Kingdom Fuel Additives Market Revenue (Million) Forecast, by Application 2019 & 2032
- Table 22: United Kingdom Fuel Additives Market Volume (Million) Forecast, by Application 2019 & 2032
- Table 23: France Fuel Additives Market Revenue (Million) Forecast, by Application 2019 & 2032
- Table 24: France Fuel Additives Market Volume (Million) Forecast, by Application 2019 & 2032
- Table 25: Spain Fuel Additives Market Revenue (Million) Forecast, by Application 2019 & 2032
- Table 26: Spain Fuel Additives Market Volume (Million) Forecast, by Application 2019 & 2032
- Table 27: Italy Fuel Additives Market Revenue (Million) Forecast, by Application 2019 & 2032
- Table 28: Italy Fuel Additives Market Volume (Million) Forecast, by Application 2019 & 2032
- Table 29: Spain Fuel Additives Market Revenue (Million) Forecast, by Application 2019 & 2032
- Table 30: Spain Fuel Additives Market Volume (Million) Forecast, by Application 2019 & 2032
- Table 31: Belgium Fuel Additives Market Revenue (Million) Forecast, by Application 2019 & 2032
- Table 32: Belgium Fuel Additives Market Volume (Million) Forecast, by Application 2019 & 2032
- Table 33: Netherland Fuel Additives Market Revenue (Million) Forecast, by Application 2019 & 2032
- Table 34: Netherland Fuel Additives Market Volume (Million) Forecast, by Application 2019 & 2032
- Table 35: Nordics Fuel Additives Market Revenue (Million) Forecast, by Application 2019 & 2032
- Table 36: Nordics Fuel Additives Market Volume (Million) Forecast, by Application 2019 & 2032
- Table 37: Rest of Europe Fuel Additives Market Revenue (Million) Forecast, by Application 2019 & 2032
- Table 38: Rest of Europe Fuel Additives Market Volume (Million) Forecast, by Application 2019 & 2032
- Table 39: Global Fuel Additives Market Revenue Million Forecast, by Country 2019 & 2032
- Table 40: Global Fuel Additives Market Volume Million Forecast, by Country 2019 & 2032
- Table 41: China Fuel Additives Market Revenue (Million) Forecast, by Application 2019 & 2032
- Table 42: China Fuel Additives Market Volume (Million) Forecast, by Application 2019 & 2032
- Table 43: Japan Fuel Additives Market Revenue (Million) Forecast, by Application 2019 & 2032
- Table 44: Japan Fuel Additives Market Volume (Million) Forecast, by Application 2019 & 2032
- Table 45: India Fuel Additives Market Revenue (Million) Forecast, by Application 2019 & 2032
- Table 46: India Fuel Additives Market Volume (Million) Forecast, by Application 2019 & 2032
- Table 47: South Korea Fuel Additives Market Revenue (Million) Forecast, by Application 2019 & 2032
- Table 48: South Korea Fuel Additives Market Volume (Million) Forecast, by Application 2019 & 2032
- Table 49: Southeast Asia Fuel Additives Market Revenue (Million) Forecast, by Application 2019 & 2032
- Table 50: Southeast Asia Fuel Additives Market Volume (Million) Forecast, by Application 2019 & 2032
- Table 51: Australia Fuel Additives Market Revenue (Million) Forecast, by Application 2019 & 2032
- Table 52: Australia Fuel Additives Market Volume (Million) Forecast, by Application 2019 & 2032
- Table 53: Indonesia Fuel Additives Market Revenue (Million) Forecast, by Application 2019 & 2032
- Table 54: Indonesia Fuel Additives Market Volume (Million) Forecast, by Application 2019 & 2032
- Table 55: Phillipes Fuel Additives Market Revenue (Million) Forecast, by Application 2019 & 2032
- Table 56: Phillipes Fuel Additives Market Volume (Million) Forecast, by Application 2019 & 2032
- Table 57: Singapore Fuel Additives Market Revenue (Million) Forecast, by Application 2019 & 2032
- Table 58: Singapore Fuel Additives Market Volume (Million) Forecast, by Application 2019 & 2032
- Table 59: Thailandc Fuel Additives Market Revenue (Million) Forecast, by Application 2019 & 2032
- Table 60: Thailandc Fuel Additives Market Volume (Million) Forecast, by Application 2019 & 2032
- Table 61: Rest of Asia Pacific Fuel Additives Market Revenue (Million) Forecast, by Application 2019 & 2032
- Table 62: Rest of Asia Pacific Fuel Additives Market Volume (Million) Forecast, by Application 2019 & 2032
- Table 63: Global Fuel Additives Market Revenue Million Forecast, by Country 2019 & 2032
- Table 64: Global Fuel Additives Market Volume Million Forecast, by Country 2019 & 2032
- Table 65: Brazil Fuel Additives Market Revenue (Million) Forecast, by Application 2019 & 2032
- Table 66: Brazil Fuel Additives Market Volume (Million) Forecast, by Application 2019 & 2032
- Table 67: Argentina Fuel Additives Market Revenue (Million) Forecast, by Application 2019 & 2032
- Table 68: Argentina Fuel Additives Market Volume (Million) Forecast, by Application 2019 & 2032
- Table 69: Peru Fuel Additives Market Revenue (Million) Forecast, by Application 2019 & 2032
- Table 70: Peru Fuel Additives Market Volume (Million) Forecast, by Application 2019 & 2032
- Table 71: Chile Fuel Additives Market Revenue (Million) Forecast, by Application 2019 & 2032
- Table 72: Chile Fuel Additives Market Volume (Million) Forecast, by Application 2019 & 2032
- Table 73: Colombia Fuel Additives Market Revenue (Million) Forecast, by Application 2019 & 2032
- Table 74: Colombia Fuel Additives Market Volume (Million) Forecast, by Application 2019 & 2032
- Table 75: Ecuador Fuel Additives Market Revenue (Million) Forecast, by Application 2019 & 2032
- Table 76: Ecuador Fuel Additives Market Volume (Million) Forecast, by Application 2019 & 2032
- Table 77: Venezuela Fuel Additives Market Revenue (Million) Forecast, by Application 2019 & 2032
- Table 78: Venezuela Fuel Additives Market Volume (Million) Forecast, by Application 2019 & 2032
- Table 79: Rest of South America Fuel Additives Market Revenue (Million) Forecast, by Application 2019 & 2032
- Table 80: Rest of South America Fuel Additives Market Volume (Million) Forecast, by Application 2019 & 2032
- Table 81: Global Fuel Additives Market Revenue Million Forecast, by Country 2019 & 2032
- Table 82: Global Fuel Additives Market Volume Million Forecast, by Country 2019 & 2032
- Table 83: United States Fuel Additives Market Revenue (Million) Forecast, by Application 2019 & 2032
- Table 84: United States Fuel Additives Market Volume (Million) Forecast, by Application 2019 & 2032
- Table 85: Canada Fuel Additives Market Revenue (Million) Forecast, by Application 2019 & 2032
- Table 86: Canada Fuel Additives Market Volume (Million) Forecast, by Application 2019 & 2032
- Table 87: Mexico Fuel Additives Market Revenue (Million) Forecast, by Application 2019 & 2032
- Table 88: Mexico Fuel Additives Market Volume (Million) Forecast, by Application 2019 & 2032
- Table 89: Global Fuel Additives Market Revenue Million Forecast, by Country 2019 & 2032
- Table 90: Global Fuel Additives Market Volume Million Forecast, by Country 2019 & 2032
- Table 91: United Arab Emirates Fuel Additives Market Revenue (Million) Forecast, by Application 2019 & 2032
- Table 92: United Arab Emirates Fuel Additives Market Volume (Million) Forecast, by Application 2019 & 2032
- Table 93: Saudi Arabia Fuel Additives Market Revenue (Million) Forecast, by Application 2019 & 2032
- Table 94: Saudi Arabia Fuel Additives Market Volume (Million) Forecast, by Application 2019 & 2032
- Table 95: South Africa Fuel Additives Market Revenue (Million) Forecast, by Application 2019 & 2032
- Table 96: South Africa Fuel Additives Market Volume (Million) Forecast, by Application 2019 & 2032
- Table 97: Rest of Middle East and Africa Fuel Additives Market Revenue (Million) Forecast, by Application 2019 & 2032
- Table 98: Rest of Middle East and Africa Fuel Additives Market Volume (Million) Forecast, by Application 2019 & 2032
- Table 99: Global Fuel Additives Market Revenue Million Forecast, by Product Type 2019 & 2032
- Table 100: Global Fuel Additives Market Volume Million Forecast, by Product Type 2019 & 2032
- Table 101: Global Fuel Additives Market Revenue Million Forecast, by Application 2019 & 2032
- Table 102: Global Fuel Additives Market Volume Million Forecast, by Application 2019 & 2032
- Table 103: Global Fuel Additives Market Revenue Million Forecast, by Country 2019 & 2032
- Table 104: Global Fuel Additives Market Volume Million Forecast, by Country 2019 & 2032
- Table 105: China Fuel Additives Market Revenue (Million) Forecast, by Application 2019 & 2032
- Table 106: China Fuel Additives Market Volume (Million) Forecast, by Application 2019 & 2032
- Table 107: India Fuel Additives Market Revenue (Million) Forecast, by Application 2019 & 2032
- Table 108: India Fuel Additives Market Volume (Million) Forecast, by Application 2019 & 2032
- Table 109: Japan Fuel Additives Market Revenue (Million) Forecast, by Application 2019 & 2032
- Table 110: Japan Fuel Additives Market Volume (Million) Forecast, by Application 2019 & 2032
- Table 111: South Korea Fuel Additives Market Revenue (Million) Forecast, by Application 2019 & 2032
- Table 112: South Korea Fuel Additives Market Volume (Million) Forecast, by Application 2019 & 2032
- Table 113: Rest of Asia Pacific Fuel Additives Market Revenue (Million) Forecast, by Application 2019 & 2032
- Table 114: Rest of Asia Pacific Fuel Additives Market Volume (Million) Forecast, by Application 2019 & 2032
- Table 115: Global Fuel Additives Market Revenue Million Forecast, by Product Type 2019 & 2032
- Table 116: Global Fuel Additives Market Volume Million Forecast, by Product Type 2019 & 2032
- Table 117: Global Fuel Additives Market Revenue Million Forecast, by Application 2019 & 2032
- Table 118: Global Fuel Additives Market Volume Million Forecast, by Application 2019 & 2032
- Table 119: Global Fuel Additives Market Revenue Million Forecast, by Country 2019 & 2032
- Table 120: Global Fuel Additives Market Volume Million Forecast, by Country 2019 & 2032
- Table 121: United States Fuel Additives Market Revenue (Million) Forecast, by Application 2019 & 2032
- Table 122: United States Fuel Additives Market Volume (Million) Forecast, by Application 2019 & 2032
- Table 123: Canada Fuel Additives Market Revenue (Million) Forecast, by Application 2019 & 2032
- Table 124: Canada Fuel Additives Market Volume (Million) Forecast, by Application 2019 & 2032
- Table 125: Global Fuel Additives Market Revenue Million Forecast, by Product Type 2019 & 2032
- Table 126: Global Fuel Additives Market Volume Million Forecast, by Product Type 2019 & 2032
- Table 127: Global Fuel Additives Market Revenue Million Forecast, by Application 2019 & 2032
- Table 128: Global Fuel Additives Market Volume Million Forecast, by Application 2019 & 2032
- Table 129: Global Fuel Additives Market Revenue Million Forecast, by Country 2019 & 2032
- Table 130: Global Fuel Additives Market Volume Million Forecast, by Country 2019 & 2032
- Table 131: Germany Fuel Additives Market Revenue (Million) Forecast, by Application 2019 & 2032
- Table 132: Germany Fuel Additives Market Volume (Million) Forecast, by Application 2019 & 2032
- Table 133: France Fuel Additives Market Revenue (Million) Forecast, by Application 2019 & 2032
- Table 134: France Fuel Additives Market Volume (Million) Forecast, by Application 2019 & 2032
- Table 135: United Kingdom Fuel Additives Market Revenue (Million) Forecast, by Application 2019 & 2032
- Table 136: United Kingdom Fuel Additives Market Volume (Million) Forecast, by Application 2019 & 2032
- Table 137: Italy Fuel Additives Market Revenue (Million) Forecast, by Application 2019 & 2032
- Table 138: Italy Fuel Additives Market Volume (Million) Forecast, by Application 2019 & 2032
- Table 139: Rest of Europe Fuel Additives Market Revenue (Million) Forecast, by Application 2019 & 2032
- Table 140: Rest of Europe Fuel Additives Market Volume (Million) Forecast, by Application 2019 & 2032
- Table 141: Global Fuel Additives Market Revenue Million Forecast, by Product Type 2019 & 2032
- Table 142: Global Fuel Additives Market Volume Million Forecast, by Product Type 2019 & 2032
- Table 143: Global Fuel Additives Market Revenue Million Forecast, by Application 2019 & 2032
- Table 144: Global Fuel Additives Market Volume Million Forecast, by Application 2019 & 2032
- Table 145: Global Fuel Additives Market Revenue Million Forecast, by Country 2019 & 2032
- Table 146: Global Fuel Additives Market Volume Million Forecast, by Country 2019 & 2032
- Table 147: Brazil Fuel Additives Market Revenue (Million) Forecast, by Application 2019 & 2032
- Table 148: Brazil Fuel Additives Market Volume (Million) Forecast, by Application 2019 & 2032
- Table 149: Mexico Fuel Additives Market Revenue (Million) Forecast, by Application 2019 & 2032
- Table 150: Mexico Fuel Additives Market Volume (Million) Forecast, by Application 2019 & 2032
- Table 151: Argentina Fuel Additives Market Revenue (Million) Forecast, by Application 2019 & 2032
- Table 152: Argentina Fuel Additives Market Volume (Million) Forecast, by Application 2019 & 2032
- Table 153: Rest of South America Fuel Additives Market Revenue (Million) Forecast, by Application 2019 & 2032
- Table 154: Rest of South America Fuel Additives Market Volume (Million) Forecast, by Application 2019 & 2032
- Table 155: Global Fuel Additives Market Revenue Million Forecast, by Product Type 2019 & 2032
- Table 156: Global Fuel Additives Market Volume Million Forecast, by Product Type 2019 & 2032
- Table 157: Global Fuel Additives Market Revenue Million Forecast, by Application 2019 & 2032
- Table 158: Global Fuel Additives Market Volume Million Forecast, by Application 2019 & 2032
- Table 159: Global Fuel Additives Market Revenue Million Forecast, by Country 2019 & 2032
- Table 160: Global Fuel Additives Market Volume Million Forecast, by Country 2019 & 2032
- Table 161: Saudi Arabia Fuel Additives Market Revenue (Million) Forecast, by Application 2019 & 2032
- Table 162: Saudi Arabia Fuel Additives Market Volume (Million) Forecast, by Application 2019 & 2032
- Table 163: South Africa Fuel Additives Market Revenue (Million) Forecast, by Application 2019 & 2032
- Table 164: South Africa Fuel Additives Market Volume (Million) Forecast, by Application 2019 & 2032
- Table 165: Rest of Middle East and Africa Fuel Additives Market Revenue (Million) Forecast, by Application 2019 & 2032
- Table 166: Rest of Middle East and Africa Fuel Additives Market Volume (Million) Forecast, by Application 2019 & 2032
Frequently Asked Questions
1. What is the projected Compound Annual Growth Rate (CAGR) of the Fuel Additives Market?
The projected CAGR is approximately 5.09%.
2. Which companies are prominent players in the Fuel Additives Market?
Key companies in the market include Infineum International Limited, Clariant, Cargill Incorporated, Evonik Industries AG, Dorf Ketal Chemicals, BASF SE, Chevron Corporation, The Lubrizol Corporation, Baker Hughes Company, TotalEnergies SE *List Not Exhaustive, Lanxess, Innospec, Afton Chemical, Exxon Mobil corporation.
3. What are the main segments of the Fuel Additives Market?
The market segments include Product Type, Application.
4. Can you provide details about the market size?
The market size is estimated to be USD XX Million as of 2022.
5. What are some drivers contributing to market growth?
Enactment of Stringent Environmental Regulations; Degrading Quality of Crude Oil.
6. What are the notable trends driving market growth?
Gasoline to Dominate the Market Studied.
7. Are there any restraints impacting market growth?
Increasing Demand for Battery Electric Vehicles (BEVs); High Costs of R&D Activities.
8. Can you provide examples of recent developments in the market?
April 2022: Afton Chemical's Greenclean 3 is an advancement in diesel fuel detergent technology launched in North America. This powerful, creative technology will continue to improve the performance of heavy-duty fleets and off-road vehicles equipped with cutting-edge engine technology and pollution control systems.
9. What pricing options are available for accessing the report?
Pricing options include single-user, multi-user, and enterprise licenses priced at USD 4750, USD 5250, and USD 8750 respectively.
10. Is the market size provided in terms of value or volume?
The market size is provided in terms of value, measured in Million and volume, measured in Million.
11. Are there any specific market keywords associated with the report?
Yes, the market keyword associated with the report is "Fuel Additives Market," which aids in identifying and referencing the specific market segment covered.
12. How do I determine which pricing option suits my needs best?
The pricing options vary based on user requirements and access needs. Individual users may opt for single-user licenses, while businesses requiring broader access may choose multi-user or enterprise licenses for cost-effective access to the report.
13. Are there any additional resources or data provided in the Fuel Additives Market report?
While the report offers comprehensive insights, it's advisable to review the specific contents or supplementary materials provided to ascertain if additional resources or data are available.
14. How can I stay updated on further developments or reports in the Fuel Additives Market?
To stay informed about further developments, trends, and reports in the Fuel Additives Market, consider subscribing to industry newsletters, following relevant companies and organizations, or regularly checking reputable industry news sources and publications.
Methodology
Step 1 - Identification of Relevant Samples Size from Population Database


Step 2 - Approaches for Defining Global Market Size (Value, Volume* & Price*)

Note*: In applicable scenarios
Step 3 - Data Sources
Primary Research
- Web Analytics
- Survey Reports
- Research Institute
- Latest Research Reports
- Opinion Leaders
Secondary Research
- Annual Reports
- White Paper
- Latest Press Release
- Industry Association
- Paid Database
- Investor Presentations

Step 4 - Data Triangulation
Involves using different sources of information in order to increase the validity of a study
These sources are likely to be stakeholders in a program - participants, other researchers, program staff, other community members, and so on.
Then we put all data in single framework & apply various statistical tools to find out the dynamic on the market.
During the analysis stage, feedback from the stakeholder groups would be compared to determine areas of agreement as well as areas of divergence
