

Key Insights
The Gallium Nitride (GaN) semiconductor power devices market is poised for substantial expansion, driven by the escalating demand for energy-efficient, high-performance solutions across critical sectors. Key growth catalysts include the burgeoning adoption of electric vehicles (EVs), renewable energy integration, and the rapid development of data centers. GaN technology offers distinct advantages over traditional silicon, including higher switching frequencies, lower on-resistance, and superior thermal management, making it an indispensable component for these demanding applications. We project the global GaN semiconductor power devices market to reach 635.1 million by 2025, with a robust compound annual growth rate (CAGR) of 35.9% anticipated for the forecast period. This optimistic outlook is underpinned by significant investments from industry leaders in expanding production capacity and the widespread integration of GaN devices in consumer electronics and industrial applications. Continued technological advancements are further enhancing device performance and reducing manufacturing costs, while supportive government policies promoting green energy and EV adoption are creating a favorable ecosystem for market growth.
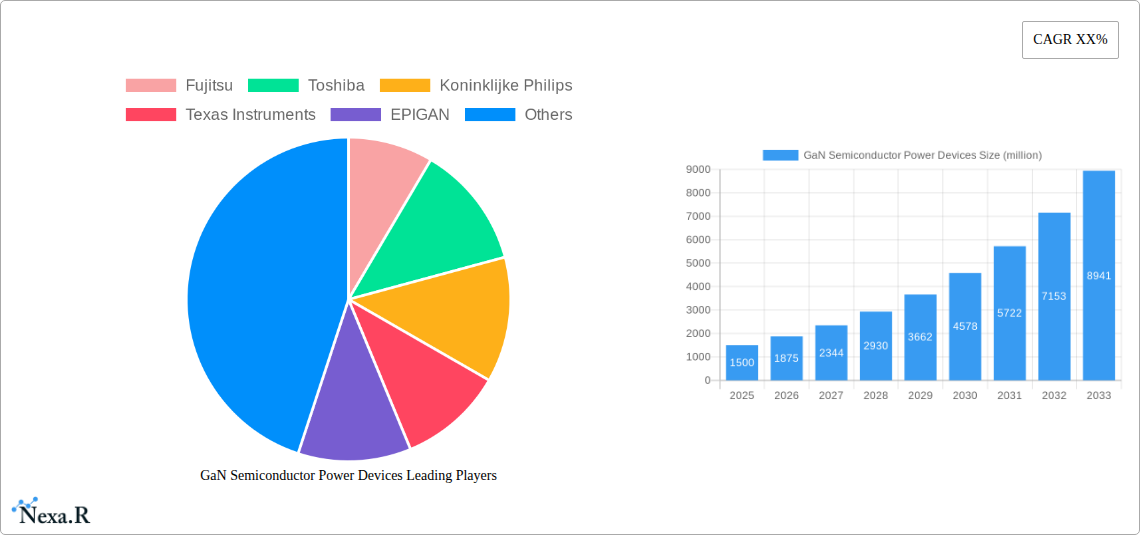
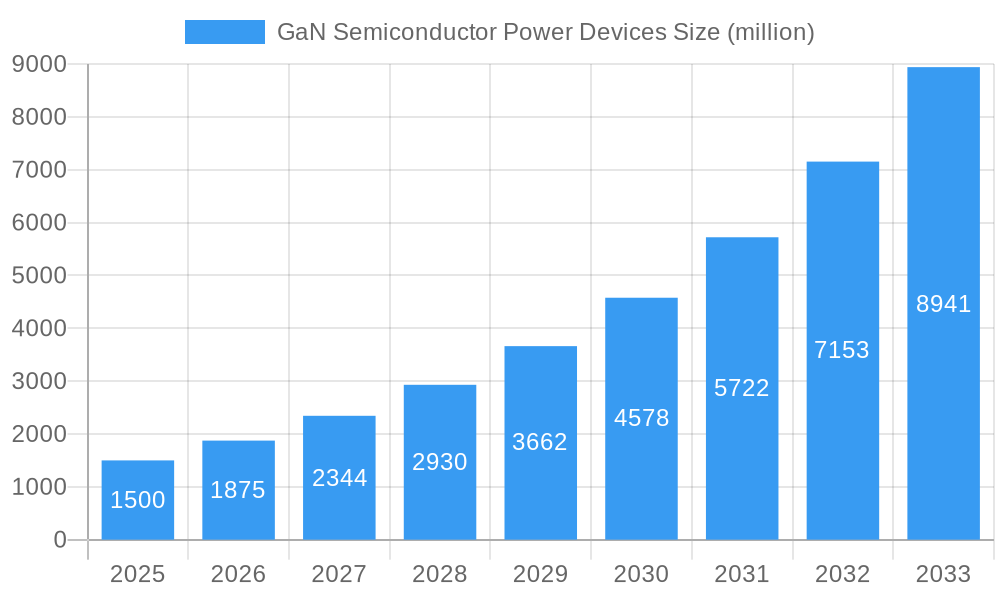
GaN Semiconductor Power Devices Market Size (In Million)
While the market demonstrates a strong growth trajectory, certain challenges persist. The comparatively higher manufacturing costs of GaN devices, though diminishing, present a key restraint. Furthermore, enhancing reliability and establishing industry-wide standardization are crucial for achieving widespread market penetration. Nevertheless, ongoing research and development initiatives are actively addressing these limitations. The market is comprehensively segmented by application, device type, and end-use industry, with key players actively pursuing strategic collaborations to foster innovation and extend their market reach. The convergence of powerful growth drivers and continuous technological innovation signals a highly promising future for the GaN semiconductor power devices market.
GaN Semiconductor Power Devices Company Market Share
GaN Semiconductor Power Devices Market Report: 2019-2033
This comprehensive report provides an in-depth analysis of the GaN Semiconductor Power Devices market, encompassing market dynamics, growth trends, regional analysis, product landscape, key players, and future outlook. The study period covers 2019-2033, with 2025 as the base and estimated year, and a forecast period of 2025-2033. This report is crucial for industry professionals, investors, and stakeholders seeking a clear understanding of this rapidly evolving sector. The parent market is the broader semiconductor market, while the child market is specifically GaN-based power devices.
GaN Semiconductor Power Devices Market Dynamics & Structure
This section analyzes the GaN Semiconductor Power Devices market's competitive landscape, technological advancements, regulatory influences, and market consolidation activities. The market is characterized by moderate concentration, with key players holding significant market share but facing increasing competition from emerging entrants. Technological innovation, driven by advancements in materials science and manufacturing processes, is a primary growth driver. Stringent regulatory frameworks concerning energy efficiency and environmental impact are also shaping market trends. The presence of substitute technologies (e.g., SiC) creates competitive pressure, necessitating continuous innovation. The market's end-user demographics span diverse sectors, including automotive, renewable energy, and consumer electronics. Mergers and acquisitions (M&A) activity is expected to remain moderate, with strategic partnerships and collaborations further shaping the market structure.
- Market Concentration: Moderately concentrated, with top 5 players holding approximately xx% market share in 2025.
- M&A Activity: An estimated xx M&A deals between 2019-2024, with a projected xx deals during 2025-2033.
- Innovation Barriers: High capital expenditure requirements for advanced manufacturing facilities and R&D.
- Key Regulatory Factors: Increasingly stringent energy efficiency standards globally.
- Substitute Technologies: Competition from silicon carbide (SiC) power devices.
GaN Semiconductor Power Devices Growth Trends & Insights
The GaN Semiconductor Power Devices market is experiencing robust growth, driven by increasing demand for energy-efficient power solutions across various industries. The market size is projected to reach xx million units by 2025, exhibiting a Compound Annual Growth Rate (CAGR) of xx% from 2025 to 2033. This growth is attributed to several factors, including the rising adoption of GaN technology in electric vehicles, renewable energy systems, and data centers. The market penetration rate is steadily increasing, with significant growth opportunities in emerging markets. Technological advancements in GaN device design and manufacturing processes are further driving market expansion. Consumer preference for energy-efficient and compact electronic devices also contributes to the increased demand for GaN-based power devices.
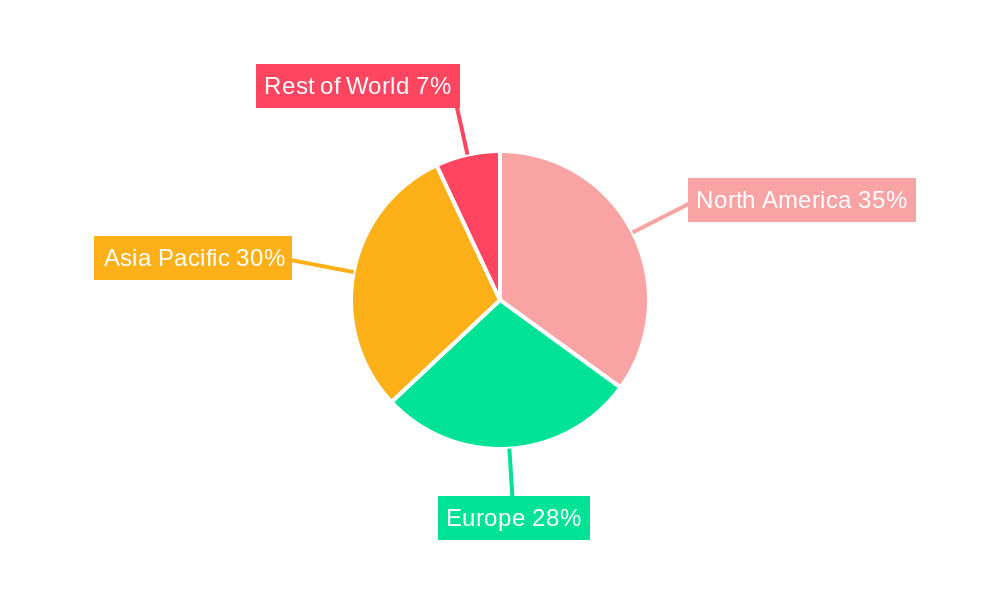
Dominant Regions, Countries, or Segments in GaN Semiconductor Power Devices
North America currently dominates the GaN Semiconductor Power Devices market, driven by strong demand from the automotive and renewable energy sectors, along with a robust technological ecosystem. However, Asia-Pacific is projected to witness the fastest growth rate during the forecast period, fueled by the expansion of the consumer electronics and electric vehicle markets in countries like China and Japan. Europe's market growth will be moderate, primarily driven by increased adoption in industrial applications.
- North America: High adoption rate in automotive and renewable energy sectors; strong R&D investments.
- Asia-Pacific: Rapid growth driven by increasing demand from consumer electronics and electric vehicles.
- Europe: Steady growth driven by industrial applications and government initiatives.
GaN Semiconductor Power Devices Product Landscape
GaN power devices offer superior performance compared to traditional silicon-based devices, exhibiting higher switching speeds, lower power losses, and greater efficiency. These advancements translate to smaller, lighter, and more efficient power systems. The product landscape is continually evolving, with innovations focusing on enhancing power density, improving thermal management, and reducing costs. Key applications include fast chargers, power adapters, and inverters for electric vehicles and renewable energy systems.
Key Drivers, Barriers & Challenges in GaN Semiconductor Power Devices
Key Drivers:
- Increasing demand for energy-efficient power solutions across multiple industries.
- Advancements in GaN materials and manufacturing technologies.
- Growing adoption of electric vehicles and renewable energy systems.
- Stringent government regulations promoting energy efficiency.
Key Challenges:
- High manufacturing costs compared to Si-based devices.
- Limited availability of high-quality GaN substrates.
- Concerns about GaN device reliability and long-term performance.
- Intense competition from other wide-bandgap semiconductor technologies (SiC). This competition impacts market share by approximately xx% annually.
Emerging Opportunities in GaN Semiconductor Power Devices
Emerging opportunities exist in several areas. These include: the expansion into new applications such as 5G infrastructure and data centers; the development of GaN-based integrated circuits; and the exploration of new GaN material structures for improved performance. The growing demand for high-power density applications in aerospace and defense also presents significant growth potential.
Growth Accelerators in the GaN Semiconductor Power Devices Industry
Technological breakthroughs, strategic partnerships, and market expansion strategies are accelerating market growth. Key drivers include advancements in GaN materials science, improved manufacturing processes, and the development of new applications. Strategic collaborations between device manufacturers and end-users are fostering innovation and accelerating market adoption. Government initiatives promoting energy efficiency and sustainable technologies further stimulate growth.
Key Players Shaping the GaN Semiconductor Power Devices Market
- Fujitsu
- Toshiba
- Koninklijke Philips
- Texas Instruments
- EPIGAN
- NTT Advanced Technology
- RF Micro Devices
- Cree Incorporated
- Aixtron
- International Quantum Epitaxy (IQE)
- Mitsubishi Chemical
- AZZURO Semiconductors
- Efficient Power Conversion (EPC)
- GaN Systems
- Infineon
Notable Milestones in GaN Semiconductor Power Devices Sector
- 2020: Infineon launches its first high-power GaN system-in-package solution.
- 2021: Cree announces significant advancements in GaN substrate technology.
- 2022: Several major automotive manufacturers announce plans for increased GaN adoption in electric vehicle powertrains.
- 2023: A strategic partnership between GaN Systems and a major consumer electronics manufacturer is formed.
In-Depth GaN Semiconductor Power Devices Market Outlook
The GaN Semiconductor Power Devices market is poised for continued strong growth, driven by technological advancements, increasing adoption across various industries, and supportive government policies. Strategic investments in research and development, coupled with strategic partnerships and collaborations, will further accelerate market expansion. The long-term outlook is positive, with significant opportunities for growth and innovation in this dynamic sector. New applications in emerging technologies, such as 5G and IoT, will play a key role in shaping the future of this market.
GaN Semiconductor Power Devices Segmentation
-
1. Application
- 1.1. Server and Other IT Equipments
- 1.2. High-Efficiency and Stable Power Supplies
- 1.3. Rapidly Expanding HEV/EV Devices
-
2. Types
- 2.1. 600V
- 2.2. Others
GaN Semiconductor Power Devices Segmentation By Geography
-
1. North America
- 1.1. United States
- 1.2. Canada
- 1.3. Mexico
-
2. South America
- 2.1. Brazil
- 2.2. Argentina
- 2.3. Rest of South America
-
3. Europe
- 3.1. United Kingdom
- 3.2. Germany
- 3.3. France
- 3.4. Italy
- 3.5. Spain
- 3.6. Russia
- 3.7. Benelux
- 3.8. Nordics
- 3.9. Rest of Europe
-
4. Middle East & Africa
- 4.1. Turkey
- 4.2. Israel
- 4.3. GCC
- 4.4. North Africa
- 4.5. South Africa
- 4.6. Rest of Middle East & Africa
-
5. Asia Pacific
- 5.1. China
- 5.2. India
- 5.3. Japan
- 5.4. South Korea
- 5.5. ASEAN
- 5.6. Oceania
- 5.7. Rest of Asia Pacific
GaN Semiconductor Power Devices Regional Market Share
Geographic Coverage of GaN Semiconductor Power Devices
GaN Semiconductor Power Devices REPORT HIGHLIGHTS
| Aspects | Details |
|---|---|
| Study Period | 2020-2034 |
| Base Year | 2025 |
| Estimated Year | 2026 |
| Forecast Period | 2026-2034 |
| Historical Period | 2020-2025 |
| Growth Rate | CAGR of 35.9% from 2020-2034 |
| Segmentation |
|
Table of Contents
- 1. Introduction
- 1.1. Research Scope
- 1.2. Market Segmentation
- 1.3. Research Objective
- 1.4. Definitions and Assumptions
- 2. Executive Summary
- 2.1. Market Snapshot
- 3. Market Dynamics
- 3.1. Market Drivers
- 3.2. Market Restrains
- 3.3. Market Trends
- 3.4. Market Opportunities
- 4. Market Factor Analysis
- 4.1. Porters Five Forces
- 4.1.1. Bargaining Power of Suppliers
- 4.1.2. Bargaining Power of Buyers
- 4.1.3. Threat of New Entrants
- 4.1.4. Threat of Substitutes
- 4.1.5. Competitive Rivalry
- 4.2. PESTEL analysis
- 4.3. BCG Analysis
- 4.3.1. Stars (High Growth, High Market Share)
- 4.3.2. Cash Cows (Low Growth, High Market Share)
- 4.3.3. Question Mark (High Growth, Low Market Share)
- 4.3.4. Dogs (Low Growth, Low Market Share)
- 4.4. Ansoff Matrix Analysis
- 4.5. Supply Chain Analysis
- 4.6. Regulatory Landscape
- 4.7. Current Market Potential and Opportunity Assessment (TAM–SAM–SOM Framework)
- 4.8. NRP Analyst Note
- 4.1. Porters Five Forces
- 5. Market Analysis, Insights and Forecast 2021-2033
- 5.1. Market Analysis, Insights and Forecast - by Application
- 5.1.1. Server and Other IT Equipments
- 5.1.2. High-Efficiency and Stable Power Supplies
- 5.1.3. Rapidly Expanding HEV/EV Devices
- 5.2. Market Analysis, Insights and Forecast - by Types
- 5.2.1. 600V
- 5.2.2. Others
- 5.3. Market Analysis, Insights and Forecast - by Region
- 5.3.1. North America
- 5.3.2. South America
- 5.3.3. Europe
- 5.3.4. Middle East & Africa
- 5.3.5. Asia Pacific
- 5.1. Market Analysis, Insights and Forecast - by Application
- 6. Global GaN Semiconductor Power Devices Analysis, Insights and Forecast, 2021-2033
- 6.1. Market Analysis, Insights and Forecast - by Application
- 6.1.1. Server and Other IT Equipments
- 6.1.2. High-Efficiency and Stable Power Supplies
- 6.1.3. Rapidly Expanding HEV/EV Devices
- 6.2. Market Analysis, Insights and Forecast - by Types
- 6.2.1. 600V
- 6.2.2. Others
- 6.1. Market Analysis, Insights and Forecast - by Application
- 7. North America GaN Semiconductor Power Devices Analysis, Insights and Forecast, 2020-2032
- 7.1. Market Analysis, Insights and Forecast - by Application
- 7.1.1. Server and Other IT Equipments
- 7.1.2. High-Efficiency and Stable Power Supplies
- 7.1.3. Rapidly Expanding HEV/EV Devices
- 7.2. Market Analysis, Insights and Forecast - by Types
- 7.2.1. 600V
- 7.2.2. Others
- 7.1. Market Analysis, Insights and Forecast - by Application
- 8. South America GaN Semiconductor Power Devices Analysis, Insights and Forecast, 2020-2032
- 8.1. Market Analysis, Insights and Forecast - by Application
- 8.1.1. Server and Other IT Equipments
- 8.1.2. High-Efficiency and Stable Power Supplies
- 8.1.3. Rapidly Expanding HEV/EV Devices
- 8.2. Market Analysis, Insights and Forecast - by Types
- 8.2.1. 600V
- 8.2.2. Others
- 8.1. Market Analysis, Insights and Forecast - by Application
- 9. Europe GaN Semiconductor Power Devices Analysis, Insights and Forecast, 2020-2032
- 9.1. Market Analysis, Insights and Forecast - by Application
- 9.1.1. Server and Other IT Equipments
- 9.1.2. High-Efficiency and Stable Power Supplies
- 9.1.3. Rapidly Expanding HEV/EV Devices
- 9.2. Market Analysis, Insights and Forecast - by Types
- 9.2.1. 600V
- 9.2.2. Others
- 9.1. Market Analysis, Insights and Forecast - by Application
- 10. Middle East & Africa GaN Semiconductor Power Devices Analysis, Insights and Forecast, 2020-2032
- 10.1. Market Analysis, Insights and Forecast - by Application
- 10.1.1. Server and Other IT Equipments
- 10.1.2. High-Efficiency and Stable Power Supplies
- 10.1.3. Rapidly Expanding HEV/EV Devices
- 10.2. Market Analysis, Insights and Forecast - by Types
- 10.2.1. 600V
- 10.2.2. Others
- 10.1. Market Analysis, Insights and Forecast - by Application
- 11. Asia Pacific GaN Semiconductor Power Devices Analysis, Insights and Forecast, 2020-2032
- 11.1. Market Analysis, Insights and Forecast - by Application
- 11.1.1. Server and Other IT Equipments
- 11.1.2. High-Efficiency and Stable Power Supplies
- 11.1.3. Rapidly Expanding HEV/EV Devices
- 11.2. Market Analysis, Insights and Forecast - by Types
- 11.2.1. 600V
- 11.2.2. Others
- 11.1. Market Analysis, Insights and Forecast - by Application
- 12. Competitive Analysis
- 12.1. Company Profiles
- 12.1.1 Fujitsu
- 12.1.1.1. Company Overview
- 12.1.1.2. Products
- 12.1.1.3. Company Financials
- 12.1.1.4. SWOT Analysis
- 12.1.2 Toshiba
- 12.1.2.1. Company Overview
- 12.1.2.2. Products
- 12.1.2.3. Company Financials
- 12.1.2.4. SWOT Analysis
- 12.1.3 Koninklijke Philips
- 12.1.3.1. Company Overview
- 12.1.3.2. Products
- 12.1.3.3. Company Financials
- 12.1.3.4. SWOT Analysis
- 12.1.4 Texas Instruments
- 12.1.4.1. Company Overview
- 12.1.4.2. Products
- 12.1.4.3. Company Financials
- 12.1.4.4. SWOT Analysis
- 12.1.5 EPIGAN
- 12.1.5.1. Company Overview
- 12.1.5.2. Products
- 12.1.5.3. Company Financials
- 12.1.5.4. SWOT Analysis
- 12.1.6 NTT Advanced Technology
- 12.1.6.1. Company Overview
- 12.1.6.2. Products
- 12.1.6.3. Company Financials
- 12.1.6.4. SWOT Analysis
- 12.1.7 RF Micro Devices
- 12.1.7.1. Company Overview
- 12.1.7.2. Products
- 12.1.7.3. Company Financials
- 12.1.7.4. SWOT Analysis
- 12.1.8 Cree Incorporated
- 12.1.8.1. Company Overview
- 12.1.8.2. Products
- 12.1.8.3. Company Financials
- 12.1.8.4. SWOT Analysis
- 12.1.9 Aixtron
- 12.1.9.1. Company Overview
- 12.1.9.2. Products
- 12.1.9.3. Company Financials
- 12.1.9.4. SWOT Analysis
- 12.1.10 International Quantum Epitaxy (IQE)
- 12.1.10.1. Company Overview
- 12.1.10.2. Products
- 12.1.10.3. Company Financials
- 12.1.10.4. SWOT Analysis
- 12.1.11 Mitsubishi Chemical
- 12.1.11.1. Company Overview
- 12.1.11.2. Products
- 12.1.11.3. Company Financials
- 12.1.11.4. SWOT Analysis
- 12.1.12 AZZURO Semiconductors
- 12.1.12.1. Company Overview
- 12.1.12.2. Products
- 12.1.12.3. Company Financials
- 12.1.12.4. SWOT Analysis
- 12.1.13 Efficient Power Conversion (EPC)
- 12.1.13.1. Company Overview
- 12.1.13.2. Products
- 12.1.13.3. Company Financials
- 12.1.13.4. SWOT Analysis
- 12.1.14 GaN Systems
- 12.1.14.1. Company Overview
- 12.1.14.2. Products
- 12.1.14.3. Company Financials
- 12.1.14.4. SWOT Analysis
- 12.1.15 Infineon
- 12.1.15.1. Company Overview
- 12.1.15.2. Products
- 12.1.15.3. Company Financials
- 12.1.15.4. SWOT Analysis
- 12.1.1 Fujitsu
- 12.2. Market Entropy
- 12.2.1 Company's Key Areas Served
- 12.2.2 Recent Developments
- 12.3. Company Market Share Analysis 2025
- 12.3.1 Top 5 Companies Market Share Analysis
- 12.3.2 Top 3 Companies Market Share Analysis
- 12.4. List of Potential Customers
- 13. Research Methodology
List of Figures
- Figure 1: Global GaN Semiconductor Power Devices Revenue Breakdown (million, %) by Region 2025 & 2033
- Figure 2: Global GaN Semiconductor Power Devices Volume Breakdown (K, %) by Region 2025 & 2033
- Figure 3: North America GaN Semiconductor Power Devices Revenue (million), by Application 2025 & 2033
- Figure 4: North America GaN Semiconductor Power Devices Volume (K), by Application 2025 & 2033
- Figure 5: North America GaN Semiconductor Power Devices Revenue Share (%), by Application 2025 & 2033
- Figure 6: North America GaN Semiconductor Power Devices Volume Share (%), by Application 2025 & 2033
- Figure 7: North America GaN Semiconductor Power Devices Revenue (million), by Types 2025 & 2033
- Figure 8: North America GaN Semiconductor Power Devices Volume (K), by Types 2025 & 2033
- Figure 9: North America GaN Semiconductor Power Devices Revenue Share (%), by Types 2025 & 2033
- Figure 10: North America GaN Semiconductor Power Devices Volume Share (%), by Types 2025 & 2033
- Figure 11: North America GaN Semiconductor Power Devices Revenue (million), by Country 2025 & 2033
- Figure 12: North America GaN Semiconductor Power Devices Volume (K), by Country 2025 & 2033
- Figure 13: North America GaN Semiconductor Power Devices Revenue Share (%), by Country 2025 & 2033
- Figure 14: North America GaN Semiconductor Power Devices Volume Share (%), by Country 2025 & 2033
- Figure 15: South America GaN Semiconductor Power Devices Revenue (million), by Application 2025 & 2033
- Figure 16: South America GaN Semiconductor Power Devices Volume (K), by Application 2025 & 2033
- Figure 17: South America GaN Semiconductor Power Devices Revenue Share (%), by Application 2025 & 2033
- Figure 18: South America GaN Semiconductor Power Devices Volume Share (%), by Application 2025 & 2033
- Figure 19: South America GaN Semiconductor Power Devices Revenue (million), by Types 2025 & 2033
- Figure 20: South America GaN Semiconductor Power Devices Volume (K), by Types 2025 & 2033
- Figure 21: South America GaN Semiconductor Power Devices Revenue Share (%), by Types 2025 & 2033
- Figure 22: South America GaN Semiconductor Power Devices Volume Share (%), by Types 2025 & 2033
- Figure 23: South America GaN Semiconductor Power Devices Revenue (million), by Country 2025 & 2033
- Figure 24: South America GaN Semiconductor Power Devices Volume (K), by Country 2025 & 2033
- Figure 25: South America GaN Semiconductor Power Devices Revenue Share (%), by Country 2025 & 2033
- Figure 26: South America GaN Semiconductor Power Devices Volume Share (%), by Country 2025 & 2033
- Figure 27: Europe GaN Semiconductor Power Devices Revenue (million), by Application 2025 & 2033
- Figure 28: Europe GaN Semiconductor Power Devices Volume (K), by Application 2025 & 2033
- Figure 29: Europe GaN Semiconductor Power Devices Revenue Share (%), by Application 2025 & 2033
- Figure 30: Europe GaN Semiconductor Power Devices Volume Share (%), by Application 2025 & 2033
- Figure 31: Europe GaN Semiconductor Power Devices Revenue (million), by Types 2025 & 2033
- Figure 32: Europe GaN Semiconductor Power Devices Volume (K), by Types 2025 & 2033
- Figure 33: Europe GaN Semiconductor Power Devices Revenue Share (%), by Types 2025 & 2033
- Figure 34: Europe GaN Semiconductor Power Devices Volume Share (%), by Types 2025 & 2033
- Figure 35: Europe GaN Semiconductor Power Devices Revenue (million), by Country 2025 & 2033
- Figure 36: Europe GaN Semiconductor Power Devices Volume (K), by Country 2025 & 2033
- Figure 37: Europe GaN Semiconductor Power Devices Revenue Share (%), by Country 2025 & 2033
- Figure 38: Europe GaN Semiconductor Power Devices Volume Share (%), by Country 2025 & 2033
- Figure 39: Middle East & Africa GaN Semiconductor Power Devices Revenue (million), by Application 2025 & 2033
- Figure 40: Middle East & Africa GaN Semiconductor Power Devices Volume (K), by Application 2025 & 2033
- Figure 41: Middle East & Africa GaN Semiconductor Power Devices Revenue Share (%), by Application 2025 & 2033
- Figure 42: Middle East & Africa GaN Semiconductor Power Devices Volume Share (%), by Application 2025 & 2033
- Figure 43: Middle East & Africa GaN Semiconductor Power Devices Revenue (million), by Types 2025 & 2033
- Figure 44: Middle East & Africa GaN Semiconductor Power Devices Volume (K), by Types 2025 & 2033
- Figure 45: Middle East & Africa GaN Semiconductor Power Devices Revenue Share (%), by Types 2025 & 2033
- Figure 46: Middle East & Africa GaN Semiconductor Power Devices Volume Share (%), by Types 2025 & 2033
- Figure 47: Middle East & Africa GaN Semiconductor Power Devices Revenue (million), by Country 2025 & 2033
- Figure 48: Middle East & Africa GaN Semiconductor Power Devices Volume (K), by Country 2025 & 2033
- Figure 49: Middle East & Africa GaN Semiconductor Power Devices Revenue Share (%), by Country 2025 & 2033
- Figure 50: Middle East & Africa GaN Semiconductor Power Devices Volume Share (%), by Country 2025 & 2033
- Figure 51: Asia Pacific GaN Semiconductor Power Devices Revenue (million), by Application 2025 & 2033
- Figure 52: Asia Pacific GaN Semiconductor Power Devices Volume (K), by Application 2025 & 2033
- Figure 53: Asia Pacific GaN Semiconductor Power Devices Revenue Share (%), by Application 2025 & 2033
- Figure 54: Asia Pacific GaN Semiconductor Power Devices Volume Share (%), by Application 2025 & 2033
- Figure 55: Asia Pacific GaN Semiconductor Power Devices Revenue (million), by Types 2025 & 2033
- Figure 56: Asia Pacific GaN Semiconductor Power Devices Volume (K), by Types 2025 & 2033
- Figure 57: Asia Pacific GaN Semiconductor Power Devices Revenue Share (%), by Types 2025 & 2033
- Figure 58: Asia Pacific GaN Semiconductor Power Devices Volume Share (%), by Types 2025 & 2033
- Figure 59: Asia Pacific GaN Semiconductor Power Devices Revenue (million), by Country 2025 & 2033
- Figure 60: Asia Pacific GaN Semiconductor Power Devices Volume (K), by Country 2025 & 2033
- Figure 61: Asia Pacific GaN Semiconductor Power Devices Revenue Share (%), by Country 2025 & 2033
- Figure 62: Asia Pacific GaN Semiconductor Power Devices Volume Share (%), by Country 2025 & 2033
List of Tables
- Table 1: Global GaN Semiconductor Power Devices Revenue million Forecast, by Application 2020 & 2033
- Table 2: Global GaN Semiconductor Power Devices Volume K Forecast, by Application 2020 & 2033
- Table 3: Global GaN Semiconductor Power Devices Revenue million Forecast, by Types 2020 & 2033
- Table 4: Global GaN Semiconductor Power Devices Volume K Forecast, by Types 2020 & 2033
- Table 5: Global GaN Semiconductor Power Devices Revenue million Forecast, by Region 2020 & 2033
- Table 6: Global GaN Semiconductor Power Devices Volume K Forecast, by Region 2020 & 2033
- Table 7: Global GaN Semiconductor Power Devices Revenue million Forecast, by Application 2020 & 2033
- Table 8: Global GaN Semiconductor Power Devices Volume K Forecast, by Application 2020 & 2033
- Table 9: Global GaN Semiconductor Power Devices Revenue million Forecast, by Types 2020 & 2033
- Table 10: Global GaN Semiconductor Power Devices Volume K Forecast, by Types 2020 & 2033
- Table 11: Global GaN Semiconductor Power Devices Revenue million Forecast, by Country 2020 & 2033
- Table 12: Global GaN Semiconductor Power Devices Volume K Forecast, by Country 2020 & 2033
- Table 13: United States GaN Semiconductor Power Devices Revenue (million) Forecast, by Application 2020 & 2033
- Table 14: United States GaN Semiconductor Power Devices Volume (K) Forecast, by Application 2020 & 2033
- Table 15: Canada GaN Semiconductor Power Devices Revenue (million) Forecast, by Application 2020 & 2033
- Table 16: Canada GaN Semiconductor Power Devices Volume (K) Forecast, by Application 2020 & 2033
- Table 17: Mexico GaN Semiconductor Power Devices Revenue (million) Forecast, by Application 2020 & 2033
- Table 18: Mexico GaN Semiconductor Power Devices Volume (K) Forecast, by Application 2020 & 2033
- Table 19: Global GaN Semiconductor Power Devices Revenue million Forecast, by Application 2020 & 2033
- Table 20: Global GaN Semiconductor Power Devices Volume K Forecast, by Application 2020 & 2033
- Table 21: Global GaN Semiconductor Power Devices Revenue million Forecast, by Types 2020 & 2033
- Table 22: Global GaN Semiconductor Power Devices Volume K Forecast, by Types 2020 & 2033
- Table 23: Global GaN Semiconductor Power Devices Revenue million Forecast, by Country 2020 & 2033
- Table 24: Global GaN Semiconductor Power Devices Volume K Forecast, by Country 2020 & 2033
- Table 25: Brazil GaN Semiconductor Power Devices Revenue (million) Forecast, by Application 2020 & 2033
- Table 26: Brazil GaN Semiconductor Power Devices Volume (K) Forecast, by Application 2020 & 2033
- Table 27: Argentina GaN Semiconductor Power Devices Revenue (million) Forecast, by Application 2020 & 2033
- Table 28: Argentina GaN Semiconductor Power Devices Volume (K) Forecast, by Application 2020 & 2033
- Table 29: Rest of South America GaN Semiconductor Power Devices Revenue (million) Forecast, by Application 2020 & 2033
- Table 30: Rest of South America GaN Semiconductor Power Devices Volume (K) Forecast, by Application 2020 & 2033
- Table 31: Global GaN Semiconductor Power Devices Revenue million Forecast, by Application 2020 & 2033
- Table 32: Global GaN Semiconductor Power Devices Volume K Forecast, by Application 2020 & 2033
- Table 33: Global GaN Semiconductor Power Devices Revenue million Forecast, by Types 2020 & 2033
- Table 34: Global GaN Semiconductor Power Devices Volume K Forecast, by Types 2020 & 2033
- Table 35: Global GaN Semiconductor Power Devices Revenue million Forecast, by Country 2020 & 2033
- Table 36: Global GaN Semiconductor Power Devices Volume K Forecast, by Country 2020 & 2033
- Table 37: United Kingdom GaN Semiconductor Power Devices Revenue (million) Forecast, by Application 2020 & 2033
- Table 38: United Kingdom GaN Semiconductor Power Devices Volume (K) Forecast, by Application 2020 & 2033
- Table 39: Germany GaN Semiconductor Power Devices Revenue (million) Forecast, by Application 2020 & 2033
- Table 40: Germany GaN Semiconductor Power Devices Volume (K) Forecast, by Application 2020 & 2033
- Table 41: France GaN Semiconductor Power Devices Revenue (million) Forecast, by Application 2020 & 2033
- Table 42: France GaN Semiconductor Power Devices Volume (K) Forecast, by Application 2020 & 2033
- Table 43: Italy GaN Semiconductor Power Devices Revenue (million) Forecast, by Application 2020 & 2033
- Table 44: Italy GaN Semiconductor Power Devices Volume (K) Forecast, by Application 2020 & 2033
- Table 45: Spain GaN Semiconductor Power Devices Revenue (million) Forecast, by Application 2020 & 2033
- Table 46: Spain GaN Semiconductor Power Devices Volume (K) Forecast, by Application 2020 & 2033
- Table 47: Russia GaN Semiconductor Power Devices Revenue (million) Forecast, by Application 2020 & 2033
- Table 48: Russia GaN Semiconductor Power Devices Volume (K) Forecast, by Application 2020 & 2033
- Table 49: Benelux GaN Semiconductor Power Devices Revenue (million) Forecast, by Application 2020 & 2033
- Table 50: Benelux GaN Semiconductor Power Devices Volume (K) Forecast, by Application 2020 & 2033
- Table 51: Nordics GaN Semiconductor Power Devices Revenue (million) Forecast, by Application 2020 & 2033
- Table 52: Nordics GaN Semiconductor Power Devices Volume (K) Forecast, by Application 2020 & 2033
- Table 53: Rest of Europe GaN Semiconductor Power Devices Revenue (million) Forecast, by Application 2020 & 2033
- Table 54: Rest of Europe GaN Semiconductor Power Devices Volume (K) Forecast, by Application 2020 & 2033
- Table 55: Global GaN Semiconductor Power Devices Revenue million Forecast, by Application 2020 & 2033
- Table 56: Global GaN Semiconductor Power Devices Volume K Forecast, by Application 2020 & 2033
- Table 57: Global GaN Semiconductor Power Devices Revenue million Forecast, by Types 2020 & 2033
- Table 58: Global GaN Semiconductor Power Devices Volume K Forecast, by Types 2020 & 2033
- Table 59: Global GaN Semiconductor Power Devices Revenue million Forecast, by Country 2020 & 2033
- Table 60: Global GaN Semiconductor Power Devices Volume K Forecast, by Country 2020 & 2033
- Table 61: Turkey GaN Semiconductor Power Devices Revenue (million) Forecast, by Application 2020 & 2033
- Table 62: Turkey GaN Semiconductor Power Devices Volume (K) Forecast, by Application 2020 & 2033
- Table 63: Israel GaN Semiconductor Power Devices Revenue (million) Forecast, by Application 2020 & 2033
- Table 64: Israel GaN Semiconductor Power Devices Volume (K) Forecast, by Application 2020 & 2033
- Table 65: GCC GaN Semiconductor Power Devices Revenue (million) Forecast, by Application 2020 & 2033
- Table 66: GCC GaN Semiconductor Power Devices Volume (K) Forecast, by Application 2020 & 2033
- Table 67: North Africa GaN Semiconductor Power Devices Revenue (million) Forecast, by Application 2020 & 2033
- Table 68: North Africa GaN Semiconductor Power Devices Volume (K) Forecast, by Application 2020 & 2033
- Table 69: South Africa GaN Semiconductor Power Devices Revenue (million) Forecast, by Application 2020 & 2033
- Table 70: South Africa GaN Semiconductor Power Devices Volume (K) Forecast, by Application 2020 & 2033
- Table 71: Rest of Middle East & Africa GaN Semiconductor Power Devices Revenue (million) Forecast, by Application 2020 & 2033
- Table 72: Rest of Middle East & Africa GaN Semiconductor Power Devices Volume (K) Forecast, by Application 2020 & 2033
- Table 73: Global GaN Semiconductor Power Devices Revenue million Forecast, by Application 2020 & 2033
- Table 74: Global GaN Semiconductor Power Devices Volume K Forecast, by Application 2020 & 2033
- Table 75: Global GaN Semiconductor Power Devices Revenue million Forecast, by Types 2020 & 2033
- Table 76: Global GaN Semiconductor Power Devices Volume K Forecast, by Types 2020 & 2033
- Table 77: Global GaN Semiconductor Power Devices Revenue million Forecast, by Country 2020 & 2033
- Table 78: Global GaN Semiconductor Power Devices Volume K Forecast, by Country 2020 & 2033
- Table 79: China GaN Semiconductor Power Devices Revenue (million) Forecast, by Application 2020 & 2033
- Table 80: China GaN Semiconductor Power Devices Volume (K) Forecast, by Application 2020 & 2033
- Table 81: India GaN Semiconductor Power Devices Revenue (million) Forecast, by Application 2020 & 2033
- Table 82: India GaN Semiconductor Power Devices Volume (K) Forecast, by Application 2020 & 2033
- Table 83: Japan GaN Semiconductor Power Devices Revenue (million) Forecast, by Application 2020 & 2033
- Table 84: Japan GaN Semiconductor Power Devices Volume (K) Forecast, by Application 2020 & 2033
- Table 85: South Korea GaN Semiconductor Power Devices Revenue (million) Forecast, by Application 2020 & 2033
- Table 86: South Korea GaN Semiconductor Power Devices Volume (K) Forecast, by Application 2020 & 2033
- Table 87: ASEAN GaN Semiconductor Power Devices Revenue (million) Forecast, by Application 2020 & 2033
- Table 88: ASEAN GaN Semiconductor Power Devices Volume (K) Forecast, by Application 2020 & 2033
- Table 89: Oceania GaN Semiconductor Power Devices Revenue (million) Forecast, by Application 2020 & 2033
- Table 90: Oceania GaN Semiconductor Power Devices Volume (K) Forecast, by Application 2020 & 2033
- Table 91: Rest of Asia Pacific GaN Semiconductor Power Devices Revenue (million) Forecast, by Application 2020 & 2033
- Table 92: Rest of Asia Pacific GaN Semiconductor Power Devices Volume (K) Forecast, by Application 2020 & 2033
Frequently Asked Questions
1. What is the projected Compound Annual Growth Rate (CAGR) of the GaN Semiconductor Power Devices?
The projected CAGR is approximately 35.9%.
2. Which companies are prominent players in the GaN Semiconductor Power Devices?
Key companies in the market include Fujitsu, Toshiba, Koninklijke Philips, Texas Instruments, EPIGAN, NTT Advanced Technology, RF Micro Devices, Cree Incorporated, Aixtron, International Quantum Epitaxy (IQE), Mitsubishi Chemical, AZZURO Semiconductors, Efficient Power Conversion (EPC), GaN Systems, Infineon.
3. What are the main segments of the GaN Semiconductor Power Devices?
The market segments include Application, Types.
4. Can you provide details about the market size?
The market size is estimated to be USD 635.1 million as of 2022.
5. What are some drivers contributing to market growth?
N/A
6. What are the notable trends driving market growth?
N/A
7. Are there any restraints impacting market growth?
N/A
8. Can you provide examples of recent developments in the market?
N/A
9. What pricing options are available for accessing the report?
Pricing options include single-user, multi-user, and enterprise licenses priced at USD 3950.00, USD 5925.00, and USD 7900.00 respectively.
10. Is the market size provided in terms of value or volume?
The market size is provided in terms of value, measured in million and volume, measured in K.
11. Are there any specific market keywords associated with the report?
Yes, the market keyword associated with the report is "GaN Semiconductor Power Devices," which aids in identifying and referencing the specific market segment covered.
12. How do I determine which pricing option suits my needs best?
The pricing options vary based on user requirements and access needs. Individual users may opt for single-user licenses, while businesses requiring broader access may choose multi-user or enterprise licenses for cost-effective access to the report.
13. Are there any additional resources or data provided in the GaN Semiconductor Power Devices report?
While the report offers comprehensive insights, it's advisable to review the specific contents or supplementary materials provided to ascertain if additional resources or data are available.
14. How can I stay updated on further developments or reports in the GaN Semiconductor Power Devices?
To stay informed about further developments, trends, and reports in the GaN Semiconductor Power Devices, consider subscribing to industry newsletters, following relevant companies and organizations, or regularly checking reputable industry news sources and publications.
Methodology
Step 1 - Identification of Relevant Samples Size from Population Database


Step 2 - Approaches for Defining Global Market Size (Value, Volume* & Price*)

Note*: In applicable scenarios
Step 3 - Data Sources
Primary Research
- Web Analytics
- Survey Reports
- Research Institute
- Latest Research Reports
- Opinion Leaders
Secondary Research
- Annual Reports
- White Paper
- Latest Press Release
- Industry Association
- Paid Database
- Investor Presentations

Step 4 - Data Triangulation
Involves using different sources of information in order to increase the validity of a study
These sources are likely to be stakeholders in a program - participants, other researchers, program staff, other community members, and so on.
Then we put all data in single framework & apply various statistical tools to find out the dynamic on the market.
During the analysis stage, feedback from the stakeholder groups would be compared to determine areas of agreement as well as areas of divergence