

Key Insights
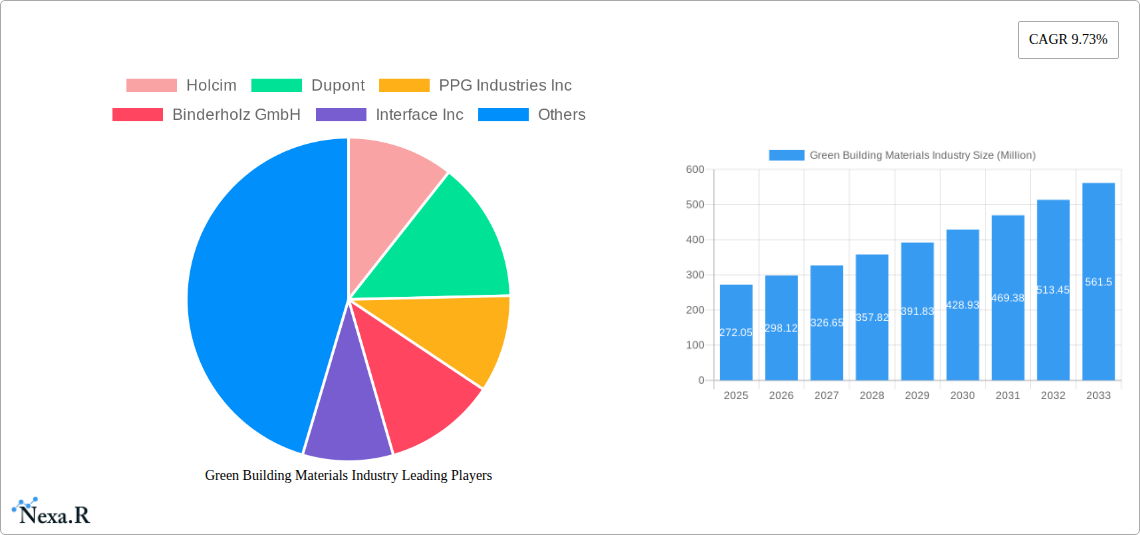
The global green building materials market, valued at $272.05 million in 2025, is projected to experience robust growth, driven by increasing environmental concerns, stringent government regulations promoting sustainable construction, and a rising demand for energy-efficient buildings. The market's Compound Annual Growth Rate (CAGR) of 9.73% from 2025 to 2033 indicates significant expansion opportunities across various segments. Key drivers include the growing awareness of the environmental impact of traditional construction materials, coupled with advancements in technology leading to the development of innovative, eco-friendly alternatives. This trend is further amplified by rising consumer preferences for sustainable living and a greater understanding of the long-term cost benefits associated with green buildings, including reduced energy consumption and improved indoor air quality. Market segments like framing, roofing, and insulation are expected to show particularly strong growth, fueled by the widespread adoption of sustainable materials in new construction projects and renovations. The residential sector is anticipated to be a major contributor to market growth, driven by increasing disposable incomes and a growing middle class, particularly in developing economies across Asia-Pacific. However, the market faces challenges such as higher initial costs associated with green building materials compared to conventional options and the need for greater standardization and accessibility to these materials in certain regions.
The competitive landscape is characterized by a mix of large multinational corporations and specialized regional players. Companies like Holcim, DuPont, and Owens Corning are leveraging their established market presence and research capabilities to develop and market innovative green building materials. Regional players are also playing a significant role, catering to specific market demands and contributing to the overall market diversity. Geographic expansion, particularly in emerging markets with burgeoning construction activities, presents a significant opportunity for companies to capitalize on the increasing demand for sustainable building solutions. Future growth will likely be shaped by technological advancements, government policies encouraging sustainable construction, and the evolving consumer preferences towards environmentally responsible choices. The market's expansion hinges on overcoming challenges associated with cost, accessibility, and the widespread adoption of standardized green building practices across various regions. Continuous innovation and investment in research and development are expected to be crucial in driving sustained growth in this dynamic market.
Green Building Materials Industry: Market Analysis & Forecast 2019-2033
This comprehensive report provides an in-depth analysis of the Green Building Materials industry, encompassing market size, growth trends, key players, and future outlook. The study period covers 2019-2033, with 2025 as the base and estimated year. The report segments the market by application (Framing, Insulation, Roofing, Exterior Siding, Interior Finishing, Other Applications) and end-use industry (Residential, Commercial, Industrial & Institutional, Infrastructure), offering granular insights into each segment's performance and future potential. Valuable data presented in Million units allows for easy comparison and analysis.
Green Building Materials Industry Market Dynamics & Structure
The Green Building Materials market is experiencing robust growth, driven by increasing environmental awareness, stringent government regulations, and a surge in sustainable construction projects. Market concentration is moderate, with several large multinational companies and numerous smaller regional players. Technological innovation, particularly in bio-based materials and advanced manufacturing processes, is a key driver. However, high initial costs and limited availability of certain green materials pose challenges. Mergers and acquisitions (M&A) activity is significant, reflecting consolidation within the industry and efforts to expand market share.
- Market Concentration: Moderate, with a few dominant players and many smaller regional companies.
- Technological Innovation: Rapid advancements in bio-based materials, recycled content, and energy-efficient manufacturing techniques.
- Regulatory Frameworks: Stringent building codes and environmental regulations in many regions are driving adoption.
- Competitive Product Substitutes: Traditional building materials continue to compete, but the preference for eco-friendly options is increasing.
- M&A Trends: Significant activity, reflecting industry consolidation and expansion strategies. Deal volume is estimated at xx Million in 2024.
- Innovation Barriers: High R&D costs and difficulties in scaling up production of some innovative green materials.
Green Building Materials Industry Growth Trends & Insights
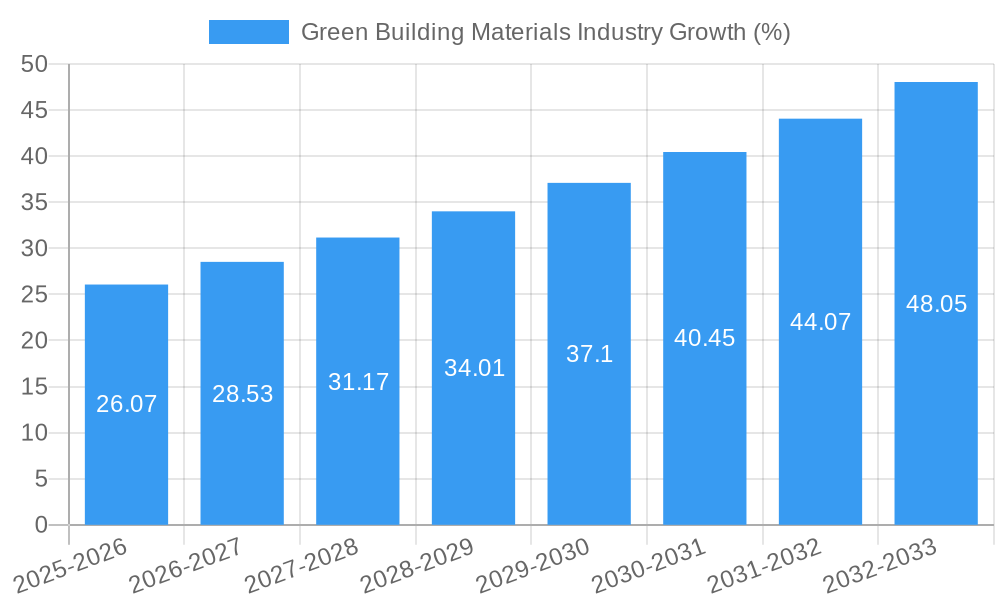
The Green Building Materials market is expected to witness significant growth over the forecast period (2025-2033), fueled by rising demand for sustainable building solutions. The market size is projected to reach xx Million by 2033, exhibiting a CAGR of xx% during the forecast period. Increased consumer awareness of environmental issues and the rising adoption of green building practices across various sectors are key drivers. Technological advancements like the development of more durable and cost-effective green materials are further boosting market expansion. Shifting consumer preferences towards environmentally friendly products and building materials are also fueling market growth. The market penetration of green building materials is anticipated to increase significantly from xx% in 2025 to xx% by 2033.
Dominant Regions, Countries, or Segments in Green Building Materials Industry
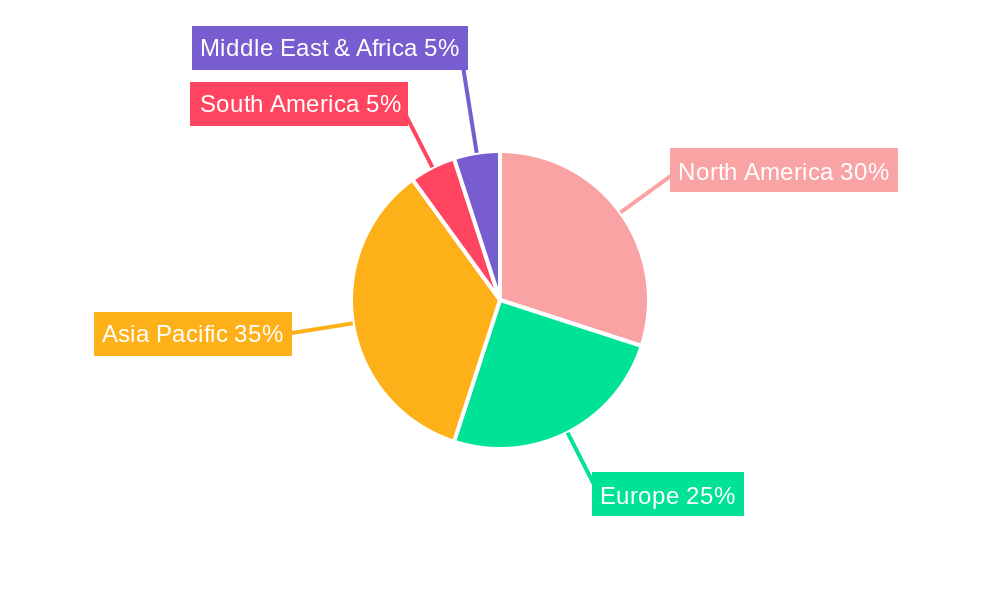
North America and Europe currently dominate the Green Building Materials market, driven by stringent environmental regulations and robust green building initiatives. Within applications, the roofing and insulation segments exhibit the highest growth potential, with increasing demand for energy-efficient and sustainable building envelopes. In end-use industries, the residential and commercial sectors are major contributors.
- Leading Region: North America
- Key Drivers: Stringent environmental regulations, government incentives, and growing consumer awareness.
- High-Growth Segments: Roofing and insulation, driven by energy efficiency needs.
- Dominant End-Use: Residential and commercial sectors.
- Market Share: North America holds approximately xx% market share in 2025.
Green Building Materials Industry Product Landscape
The green building materials market offers a diverse range of products, including sustainably harvested timber, recycled content cement, bio-based insulation, and low-VOC paints. These materials are designed to minimize environmental impact throughout their lifecycle, from manufacturing to disposal. Key innovations include advanced composite materials with superior strength and durability and self-healing materials that extend lifespan and reduce waste. Unique selling propositions (USPs) for these materials include their lower carbon footprint, improved energy efficiency, and enhanced durability.
Key Drivers, Barriers & Challenges in Green Building Materials Industry
Key Drivers: Stringent environmental regulations, increasing consumer demand for sustainable products, and government incentives for green building practices. Technological advancements are leading to more cost-effective and efficient green building materials.
Challenges: High initial costs compared to traditional materials, limited availability of certain green materials, and the complexity of supply chains. Regulatory hurdles and inconsistencies across regions also pose challenges. The market faces a xx Million units supply shortage in 2025 for certain key materials.
Emerging Opportunities in Green Building Materials Industry
Emerging opportunities lie in developing innovative materials with enhanced performance characteristics, expanding into untapped markets (e.g., developing countries), and focusing on circular economy models. Further opportunities exist in creating standardized lifecycle assessments to better quantify the environmental benefits of green building materials.
Growth Accelerators in the Green Building Materials Industry
Technological breakthroughs in bio-based materials and manufacturing processes, strategic partnerships between material producers and construction companies, and expansion into new geographical markets are key growth accelerators. Government policies supporting sustainable construction further stimulate market expansion.
Key Players Shaping the Green Building Materials Industry Market
- Holcim
- Dupont
- PPG Industries Inc
- Binderholz GmbH
- Interface Inc
- Owens Corning
- Kingspan Group
- BASF SE
- Soben International (Asia-Pacific) Ltd
- Saint- Gobain (Certainteed)
- Sika AG
Notable Milestones in Green Building Materials Industry Sector
- October 2022: Holcim acquired Wiltshire Heavy Building Materials, strengthening its UK market presence.
- August 2022: Saint-Gobain acquired Kaycan, expanding its siding and vinyl offerings in North America.
- January 2022: Binderholz GmbH acquired BSW Timber Ltd, becoming Europe's largest sawmill company.
In-Depth Green Building Materials Industry Market Outlook
The Green Building Materials market is poised for continued robust growth, driven by sustainability concerns and technological advancements. Strategic partnerships and investments in R&D will play a crucial role in unlocking future market potential. Expansion into developing economies and the creation of innovative circular economy models offer significant opportunities. The market is expected to reach xx Million units by 2033, with considerable potential for further growth beyond this timeframe.
Green Building Materials Industry Segmentation
-
1. Application
- 1.1. Framing
- 1.2. Insulation
- 1.3. Roofing
- 1.4. Exterior Siding
- 1.5. Interior Finishing
- 1.6. Other Applications
-
2. End-use Industry
- 2.1. Residential
- 2.2. Commercial
- 2.3. Industrial and Institutional
- 2.4. Infrastructure
Green Building Materials Industry Segmentation By Geography
-
1. Asia Pacific
- 1.1. China
- 1.2. India
- 1.3. Japan
- 1.4. South Korea
- 1.5. Rest of Asia Pacific
-
2. North America
- 2.1. United States
- 2.2. Canada
- 2.3. Mexico
-
3. Europe
- 3.1. Germany
- 3.2. United Kingdom
- 3.3. Italy
- 3.4. France
- 3.5. Rest of Europe
-
4. South America
- 4.1. Brazil
- 4.2. Argentina
- 4.3. Rest of South America
- 5. Middle East
-
6. Saudi Arabia
- 6.1. South Africa
- 6.2. Rest of Middle East
Green Building Materials Industry REPORT HIGHLIGHTS
| Aspects | Details |
|---|---|
| Study Period | 2019-2033 |
| Base Year | 2024 |
| Estimated Year | 2025 |
| Forecast Period | 2025-2033 |
| Historical Period | 2019-2024 |
| Growth Rate | CAGR of 9.73% from 2019-2033 |
| Segmentation |
|
Table of Contents
- 1. Introduction
- 1.1. Research Scope
- 1.2. Market Segmentation
- 1.3. Research Methodology
- 1.4. Definitions and Assumptions
- 2. Executive Summary
- 2.1. Introduction
- 3. Market Dynamics
- 3.1. Introduction
- 3.2. Market Drivers
- 3.2.1. Increasing Demand for Insulation and Energy-efficient Buildings; Favorable Government Policies for Green Buildings
- 3.3. Market Restrains
- 3.3.1. High Initial Capital Investment Compared to Conventional Buildings
- 3.4. Market Trends
- 3.4.1. Increasing Consumption of Green Building Materials in the Residential End-use Industry
- 4. Market Factor Analysis
- 4.1. Porters Five Forces
- 4.2. Supply/Value Chain
- 4.3. PESTEL analysis
- 4.4. Market Entropy
- 4.5. Patent/Trademark Analysis
- 5. Global Green Building Materials Industry Analysis, Insights and Forecast, 2019-2031
- 5.1. Market Analysis, Insights and Forecast - by Application
- 5.1.1. Framing
- 5.1.2. Insulation
- 5.1.3. Roofing
- 5.1.4. Exterior Siding
- 5.1.5. Interior Finishing
- 5.1.6. Other Applications
- 5.2. Market Analysis, Insights and Forecast - by End-use Industry
- 5.2.1. Residential
- 5.2.2. Commercial
- 5.2.3. Industrial and Institutional
- 5.2.4. Infrastructure
- 5.3. Market Analysis, Insights and Forecast - by Region
- 5.3.1. Asia Pacific
- 5.3.2. North America
- 5.3.3. Europe
- 5.3.4. South America
- 5.3.5. Middle East
- 5.3.6. Saudi Arabia
- 5.1. Market Analysis, Insights and Forecast - by Application
- 6. Asia Pacific Green Building Materials Industry Analysis, Insights and Forecast, 2019-2031
- 6.1. Market Analysis, Insights and Forecast - by Application
- 6.1.1. Framing
- 6.1.2. Insulation
- 6.1.3. Roofing
- 6.1.4. Exterior Siding
- 6.1.5. Interior Finishing
- 6.1.6. Other Applications
- 6.2. Market Analysis, Insights and Forecast - by End-use Industry
- 6.2.1. Residential
- 6.2.2. Commercial
- 6.2.3. Industrial and Institutional
- 6.2.4. Infrastructure
- 6.1. Market Analysis, Insights and Forecast - by Application
- 7. North America Green Building Materials Industry Analysis, Insights and Forecast, 2019-2031
- 7.1. Market Analysis, Insights and Forecast - by Application
- 7.1.1. Framing
- 7.1.2. Insulation
- 7.1.3. Roofing
- 7.1.4. Exterior Siding
- 7.1.5. Interior Finishing
- 7.1.6. Other Applications
- 7.2. Market Analysis, Insights and Forecast - by End-use Industry
- 7.2.1. Residential
- 7.2.2. Commercial
- 7.2.3. Industrial and Institutional
- 7.2.4. Infrastructure
- 7.1. Market Analysis, Insights and Forecast - by Application
- 8. Europe Green Building Materials Industry Analysis, Insights and Forecast, 2019-2031
- 8.1. Market Analysis, Insights and Forecast - by Application
- 8.1.1. Framing
- 8.1.2. Insulation
- 8.1.3. Roofing
- 8.1.4. Exterior Siding
- 8.1.5. Interior Finishing
- 8.1.6. Other Applications
- 8.2. Market Analysis, Insights and Forecast - by End-use Industry
- 8.2.1. Residential
- 8.2.2. Commercial
- 8.2.3. Industrial and Institutional
- 8.2.4. Infrastructure
- 8.1. Market Analysis, Insights and Forecast - by Application
- 9. South America Green Building Materials Industry Analysis, Insights and Forecast, 2019-2031
- 9.1. Market Analysis, Insights and Forecast - by Application
- 9.1.1. Framing
- 9.1.2. Insulation
- 9.1.3. Roofing
- 9.1.4. Exterior Siding
- 9.1.5. Interior Finishing
- 9.1.6. Other Applications
- 9.2. Market Analysis, Insights and Forecast - by End-use Industry
- 9.2.1. Residential
- 9.2.2. Commercial
- 9.2.3. Industrial and Institutional
- 9.2.4. Infrastructure
- 9.1. Market Analysis, Insights and Forecast - by Application
- 10. Middle East Green Building Materials Industry Analysis, Insights and Forecast, 2019-2031
- 10.1. Market Analysis, Insights and Forecast - by Application
- 10.1.1. Framing
- 10.1.2. Insulation
- 10.1.3. Roofing
- 10.1.4. Exterior Siding
- 10.1.5. Interior Finishing
- 10.1.6. Other Applications
- 10.2. Market Analysis, Insights and Forecast - by End-use Industry
- 10.2.1. Residential
- 10.2.2. Commercial
- 10.2.3. Industrial and Institutional
- 10.2.4. Infrastructure
- 10.1. Market Analysis, Insights and Forecast - by Application
- 11. Saudi Arabia Green Building Materials Industry Analysis, Insights and Forecast, 2019-2031
- 11.1. Market Analysis, Insights and Forecast - by Application
- 11.1.1. Framing
- 11.1.2. Insulation
- 11.1.3. Roofing
- 11.1.4. Exterior Siding
- 11.1.5. Interior Finishing
- 11.1.6. Other Applications
- 11.2. Market Analysis, Insights and Forecast - by End-use Industry
- 11.2.1. Residential
- 11.2.2. Commercial
- 11.2.3. Industrial and Institutional
- 11.2.4. Infrastructure
- 11.1. Market Analysis, Insights and Forecast - by Application
- 12. Asia Pacific Green Building Materials Industry Analysis, Insights and Forecast, 2019-2031
- 12.1. Market Analysis, Insights and Forecast - By Country/Sub-region
- 12.1.1 China
- 12.1.2 India
- 12.1.3 Japan
- 12.1.4 South Korea
- 12.1.5 Rest of Asia Pacific
- 13. North America Green Building Materials Industry Analysis, Insights and Forecast, 2019-2031
- 13.1. Market Analysis, Insights and Forecast - By Country/Sub-region
- 13.1.1 United States
- 13.1.2 Canada
- 13.1.3 Mexico
- 14. Europe Green Building Materials Industry Analysis, Insights and Forecast, 2019-2031
- 14.1. Market Analysis, Insights and Forecast - By Country/Sub-region
- 14.1.1 Germany
- 14.1.2 United Kingdom
- 14.1.3 Italy
- 14.1.4 France
- 14.1.5 Rest of Europe
- 15. South America Green Building Materials Industry Analysis, Insights and Forecast, 2019-2031
- 15.1. Market Analysis, Insights and Forecast - By Country/Sub-region
- 15.1.1 Brazil
- 15.1.2 Argentina
- 15.1.3 Rest of South America
- 16. Middle East Green Building Materials Industry Analysis, Insights and Forecast, 2019-2031
- 16.1. Market Analysis, Insights and Forecast - By Country/Sub-region
- 16.1.1.
- 17. Saudi Arabia Green Building Materials Industry Analysis, Insights and Forecast, 2019-2031
- 17.1. Market Analysis, Insights and Forecast - By Country/Sub-region
- 17.1.1 South Africa
- 17.1.2 Rest of Middle East
- 18. Competitive Analysis
- 18.1. Global Market Share Analysis 2024
- 18.2. Company Profiles
- 18.2.1 Holcim
- 18.2.1.1. Overview
- 18.2.1.2. Products
- 18.2.1.3. SWOT Analysis
- 18.2.1.4. Recent Developments
- 18.2.1.5. Financials (Based on Availability)
- 18.2.2 Dupont
- 18.2.2.1. Overview
- 18.2.2.2. Products
- 18.2.2.3. SWOT Analysis
- 18.2.2.4. Recent Developments
- 18.2.2.5. Financials (Based on Availability)
- 18.2.3 PPG Industries Inc
- 18.2.3.1. Overview
- 18.2.3.2. Products
- 18.2.3.3. SWOT Analysis
- 18.2.3.4. Recent Developments
- 18.2.3.5. Financials (Based on Availability)
- 18.2.4 Binderholz GmbH
- 18.2.4.1. Overview
- 18.2.4.2. Products
- 18.2.4.3. SWOT Analysis
- 18.2.4.4. Recent Developments
- 18.2.4.5. Financials (Based on Availability)
- 18.2.5 Interface Inc
- 18.2.5.1. Overview
- 18.2.5.2. Products
- 18.2.5.3. SWOT Analysis
- 18.2.5.4. Recent Developments
- 18.2.5.5. Financials (Based on Availability)
- 18.2.6 Owens Corning
- 18.2.6.1. Overview
- 18.2.6.2. Products
- 18.2.6.3. SWOT Analysis
- 18.2.6.4. Recent Developments
- 18.2.6.5. Financials (Based on Availability)
- 18.2.7 Kingspan Group
- 18.2.7.1. Overview
- 18.2.7.2. Products
- 18.2.7.3. SWOT Analysis
- 18.2.7.4. Recent Developments
- 18.2.7.5. Financials (Based on Availability)
- 18.2.8 BASF SE
- 18.2.8.1. Overview
- 18.2.8.2. Products
- 18.2.8.3. SWOT Analysis
- 18.2.8.4. Recent Developments
- 18.2.8.5. Financials (Based on Availability)
- 18.2.9 Soben International (Asia-Pacific) Ltd*List Not Exhaustive
- 18.2.9.1. Overview
- 18.2.9.2. Products
- 18.2.9.3. SWOT Analysis
- 18.2.9.4. Recent Developments
- 18.2.9.5. Financials (Based on Availability)
- 18.2.10 Saint- Gobain (Certainteed)
- 18.2.10.1. Overview
- 18.2.10.2. Products
- 18.2.10.3. SWOT Analysis
- 18.2.10.4. Recent Developments
- 18.2.10.5. Financials (Based on Availability)
- 18.2.11 Sika AG
- 18.2.11.1. Overview
- 18.2.11.2. Products
- 18.2.11.3. SWOT Analysis
- 18.2.11.4. Recent Developments
- 18.2.11.5. Financials (Based on Availability)
- 18.2.1 Holcim
List of Figures
- Figure 1: Global Green Building Materials Industry Revenue Breakdown (Million, %) by Region 2024 & 2032
- Figure 2: Asia Pacific Green Building Materials Industry Revenue (Million), by Country 2024 & 2032
- Figure 3: Asia Pacific Green Building Materials Industry Revenue Share (%), by Country 2024 & 2032
- Figure 4: North America Green Building Materials Industry Revenue (Million), by Country 2024 & 2032
- Figure 5: North America Green Building Materials Industry Revenue Share (%), by Country 2024 & 2032
- Figure 6: Europe Green Building Materials Industry Revenue (Million), by Country 2024 & 2032
- Figure 7: Europe Green Building Materials Industry Revenue Share (%), by Country 2024 & 2032
- Figure 8: South America Green Building Materials Industry Revenue (Million), by Country 2024 & 2032
- Figure 9: South America Green Building Materials Industry Revenue Share (%), by Country 2024 & 2032
- Figure 10: Middle East Green Building Materials Industry Revenue (Million), by Country 2024 & 2032
- Figure 11: Middle East Green Building Materials Industry Revenue Share (%), by Country 2024 & 2032
- Figure 12: Saudi Arabia Green Building Materials Industry Revenue (Million), by Country 2024 & 2032
- Figure 13: Saudi Arabia Green Building Materials Industry Revenue Share (%), by Country 2024 & 2032
- Figure 14: Asia Pacific Green Building Materials Industry Revenue (Million), by Application 2024 & 2032
- Figure 15: Asia Pacific Green Building Materials Industry Revenue Share (%), by Application 2024 & 2032
- Figure 16: Asia Pacific Green Building Materials Industry Revenue (Million), by End-use Industry 2024 & 2032
- Figure 17: Asia Pacific Green Building Materials Industry Revenue Share (%), by End-use Industry 2024 & 2032
- Figure 18: Asia Pacific Green Building Materials Industry Revenue (Million), by Country 2024 & 2032
- Figure 19: Asia Pacific Green Building Materials Industry Revenue Share (%), by Country 2024 & 2032
- Figure 20: North America Green Building Materials Industry Revenue (Million), by Application 2024 & 2032
- Figure 21: North America Green Building Materials Industry Revenue Share (%), by Application 2024 & 2032
- Figure 22: North America Green Building Materials Industry Revenue (Million), by End-use Industry 2024 & 2032
- Figure 23: North America Green Building Materials Industry Revenue Share (%), by End-use Industry 2024 & 2032
- Figure 24: North America Green Building Materials Industry Revenue (Million), by Country 2024 & 2032
- Figure 25: North America Green Building Materials Industry Revenue Share (%), by Country 2024 & 2032
- Figure 26: Europe Green Building Materials Industry Revenue (Million), by Application 2024 & 2032
- Figure 27: Europe Green Building Materials Industry Revenue Share (%), by Application 2024 & 2032
- Figure 28: Europe Green Building Materials Industry Revenue (Million), by End-use Industry 2024 & 2032
- Figure 29: Europe Green Building Materials Industry Revenue Share (%), by End-use Industry 2024 & 2032
- Figure 30: Europe Green Building Materials Industry Revenue (Million), by Country 2024 & 2032
- Figure 31: Europe Green Building Materials Industry Revenue Share (%), by Country 2024 & 2032
- Figure 32: South America Green Building Materials Industry Revenue (Million), by Application 2024 & 2032
- Figure 33: South America Green Building Materials Industry Revenue Share (%), by Application 2024 & 2032
- Figure 34: South America Green Building Materials Industry Revenue (Million), by End-use Industry 2024 & 2032
- Figure 35: South America Green Building Materials Industry Revenue Share (%), by End-use Industry 2024 & 2032
- Figure 36: South America Green Building Materials Industry Revenue (Million), by Country 2024 & 2032
- Figure 37: South America Green Building Materials Industry Revenue Share (%), by Country 2024 & 2032
- Figure 38: Middle East Green Building Materials Industry Revenue (Million), by Application 2024 & 2032
- Figure 39: Middle East Green Building Materials Industry Revenue Share (%), by Application 2024 & 2032
- Figure 40: Middle East Green Building Materials Industry Revenue (Million), by End-use Industry 2024 & 2032
- Figure 41: Middle East Green Building Materials Industry Revenue Share (%), by End-use Industry 2024 & 2032
- Figure 42: Middle East Green Building Materials Industry Revenue (Million), by Country 2024 & 2032
- Figure 43: Middle East Green Building Materials Industry Revenue Share (%), by Country 2024 & 2032
- Figure 44: Saudi Arabia Green Building Materials Industry Revenue (Million), by Application 2024 & 2032
- Figure 45: Saudi Arabia Green Building Materials Industry Revenue Share (%), by Application 2024 & 2032
- Figure 46: Saudi Arabia Green Building Materials Industry Revenue (Million), by End-use Industry 2024 & 2032
- Figure 47: Saudi Arabia Green Building Materials Industry Revenue Share (%), by End-use Industry 2024 & 2032
- Figure 48: Saudi Arabia Green Building Materials Industry Revenue (Million), by Country 2024 & 2032
- Figure 49: Saudi Arabia Green Building Materials Industry Revenue Share (%), by Country 2024 & 2032
List of Tables
- Table 1: Global Green Building Materials Industry Revenue Million Forecast, by Region 2019 & 2032
- Table 2: Global Green Building Materials Industry Revenue Million Forecast, by Application 2019 & 2032
- Table 3: Global Green Building Materials Industry Revenue Million Forecast, by End-use Industry 2019 & 2032
- Table 4: Global Green Building Materials Industry Revenue Million Forecast, by Region 2019 & 2032
- Table 5: Global Green Building Materials Industry Revenue Million Forecast, by Country 2019 & 2032
- Table 6: China Green Building Materials Industry Revenue (Million) Forecast, by Application 2019 & 2032
- Table 7: India Green Building Materials Industry Revenue (Million) Forecast, by Application 2019 & 2032
- Table 8: Japan Green Building Materials Industry Revenue (Million) Forecast, by Application 2019 & 2032
- Table 9: South Korea Green Building Materials Industry Revenue (Million) Forecast, by Application 2019 & 2032
- Table 10: Rest of Asia Pacific Green Building Materials Industry Revenue (Million) Forecast, by Application 2019 & 2032
- Table 11: Global Green Building Materials Industry Revenue Million Forecast, by Country 2019 & 2032
- Table 12: United States Green Building Materials Industry Revenue (Million) Forecast, by Application 2019 & 2032
- Table 13: Canada Green Building Materials Industry Revenue (Million) Forecast, by Application 2019 & 2032
- Table 14: Mexico Green Building Materials Industry Revenue (Million) Forecast, by Application 2019 & 2032
- Table 15: Global Green Building Materials Industry Revenue Million Forecast, by Country 2019 & 2032
- Table 16: Germany Green Building Materials Industry Revenue (Million) Forecast, by Application 2019 & 2032
- Table 17: United Kingdom Green Building Materials Industry Revenue (Million) Forecast, by Application 2019 & 2032
- Table 18: Italy Green Building Materials Industry Revenue (Million) Forecast, by Application 2019 & 2032
- Table 19: France Green Building Materials Industry Revenue (Million) Forecast, by Application 2019 & 2032
- Table 20: Rest of Europe Green Building Materials Industry Revenue (Million) Forecast, by Application 2019 & 2032
- Table 21: Global Green Building Materials Industry Revenue Million Forecast, by Country 2019 & 2032
- Table 22: Brazil Green Building Materials Industry Revenue (Million) Forecast, by Application 2019 & 2032
- Table 23: Argentina Green Building Materials Industry Revenue (Million) Forecast, by Application 2019 & 2032
- Table 24: Rest of South America Green Building Materials Industry Revenue (Million) Forecast, by Application 2019 & 2032
- Table 25: Global Green Building Materials Industry Revenue Million Forecast, by Country 2019 & 2032
- Table 26: Green Building Materials Industry Revenue (Million) Forecast, by Application 2019 & 2032
- Table 27: Global Green Building Materials Industry Revenue Million Forecast, by Country 2019 & 2032
- Table 28: South Africa Green Building Materials Industry Revenue (Million) Forecast, by Application 2019 & 2032
- Table 29: Rest of Middle East Green Building Materials Industry Revenue (Million) Forecast, by Application 2019 & 2032
- Table 30: Global Green Building Materials Industry Revenue Million Forecast, by Application 2019 & 2032
- Table 31: Global Green Building Materials Industry Revenue Million Forecast, by End-use Industry 2019 & 2032
- Table 32: Global Green Building Materials Industry Revenue Million Forecast, by Country 2019 & 2032
- Table 33: China Green Building Materials Industry Revenue (Million) Forecast, by Application 2019 & 2032
- Table 34: India Green Building Materials Industry Revenue (Million) Forecast, by Application 2019 & 2032
- Table 35: Japan Green Building Materials Industry Revenue (Million) Forecast, by Application 2019 & 2032
- Table 36: South Korea Green Building Materials Industry Revenue (Million) Forecast, by Application 2019 & 2032
- Table 37: Rest of Asia Pacific Green Building Materials Industry Revenue (Million) Forecast, by Application 2019 & 2032
- Table 38: Global Green Building Materials Industry Revenue Million Forecast, by Application 2019 & 2032
- Table 39: Global Green Building Materials Industry Revenue Million Forecast, by End-use Industry 2019 & 2032
- Table 40: Global Green Building Materials Industry Revenue Million Forecast, by Country 2019 & 2032
- Table 41: United States Green Building Materials Industry Revenue (Million) Forecast, by Application 2019 & 2032
- Table 42: Canada Green Building Materials Industry Revenue (Million) Forecast, by Application 2019 & 2032
- Table 43: Mexico Green Building Materials Industry Revenue (Million) Forecast, by Application 2019 & 2032
- Table 44: Global Green Building Materials Industry Revenue Million Forecast, by Application 2019 & 2032
- Table 45: Global Green Building Materials Industry Revenue Million Forecast, by End-use Industry 2019 & 2032
- Table 46: Global Green Building Materials Industry Revenue Million Forecast, by Country 2019 & 2032
- Table 47: Germany Green Building Materials Industry Revenue (Million) Forecast, by Application 2019 & 2032
- Table 48: United Kingdom Green Building Materials Industry Revenue (Million) Forecast, by Application 2019 & 2032
- Table 49: Italy Green Building Materials Industry Revenue (Million) Forecast, by Application 2019 & 2032
- Table 50: France Green Building Materials Industry Revenue (Million) Forecast, by Application 2019 & 2032
- Table 51: Rest of Europe Green Building Materials Industry Revenue (Million) Forecast, by Application 2019 & 2032
- Table 52: Global Green Building Materials Industry Revenue Million Forecast, by Application 2019 & 2032
- Table 53: Global Green Building Materials Industry Revenue Million Forecast, by End-use Industry 2019 & 2032
- Table 54: Global Green Building Materials Industry Revenue Million Forecast, by Country 2019 & 2032
- Table 55: Brazil Green Building Materials Industry Revenue (Million) Forecast, by Application 2019 & 2032
- Table 56: Argentina Green Building Materials Industry Revenue (Million) Forecast, by Application 2019 & 2032
- Table 57: Rest of South America Green Building Materials Industry Revenue (Million) Forecast, by Application 2019 & 2032
- Table 58: Global Green Building Materials Industry Revenue Million Forecast, by Application 2019 & 2032
- Table 59: Global Green Building Materials Industry Revenue Million Forecast, by End-use Industry 2019 & 2032
- Table 60: Global Green Building Materials Industry Revenue Million Forecast, by Country 2019 & 2032
- Table 61: Global Green Building Materials Industry Revenue Million Forecast, by Application 2019 & 2032
- Table 62: Global Green Building Materials Industry Revenue Million Forecast, by End-use Industry 2019 & 2032
- Table 63: Global Green Building Materials Industry Revenue Million Forecast, by Country 2019 & 2032
- Table 64: South Africa Green Building Materials Industry Revenue (Million) Forecast, by Application 2019 & 2032
- Table 65: Rest of Middle East Green Building Materials Industry Revenue (Million) Forecast, by Application 2019 & 2032
Frequently Asked Questions
1. What is the projected Compound Annual Growth Rate (CAGR) of the Green Building Materials Industry?
The projected CAGR is approximately 9.73%.
2. Which companies are prominent players in the Green Building Materials Industry?
Key companies in the market include Holcim, Dupont, PPG Industries Inc, Binderholz GmbH, Interface Inc, Owens Corning, Kingspan Group, BASF SE, Soben International (Asia-Pacific) Ltd*List Not Exhaustive, Saint- Gobain (Certainteed), Sika AG.
3. What are the main segments of the Green Building Materials Industry?
The market segments include Application, End-use Industry.
4. Can you provide details about the market size?
The market size is estimated to be USD 272.05 Million as of 2022.
5. What are some drivers contributing to market growth?
Increasing Demand for Insulation and Energy-efficient Buildings; Favorable Government Policies for Green Buildings.
6. What are the notable trends driving market growth?
Increasing Consumption of Green Building Materials in the Residential End-use Industry.
7. Are there any restraints impacting market growth?
High Initial Capital Investment Compared to Conventional Buildings.
8. Can you provide examples of recent developments in the market?
October 2022: Holcim acquired Wiltshire Heavy Building Materials, one of the leading companies providing building solutions and material circularity in the United Kingdom. This acquisition will strengthen Holcim's market presence in the United Kingdom's green building materials market.
9. What pricing options are available for accessing the report?
Pricing options include single-user, multi-user, and enterprise licenses priced at USD 4750, USD 5250, and USD 8750 respectively.
10. Is the market size provided in terms of value or volume?
The market size is provided in terms of value, measured in Million.
11. Are there any specific market keywords associated with the report?
Yes, the market keyword associated with the report is "Green Building Materials Industry," which aids in identifying and referencing the specific market segment covered.
12. How do I determine which pricing option suits my needs best?
The pricing options vary based on user requirements and access needs. Individual users may opt for single-user licenses, while businesses requiring broader access may choose multi-user or enterprise licenses for cost-effective access to the report.
13. Are there any additional resources or data provided in the Green Building Materials Industry report?
While the report offers comprehensive insights, it's advisable to review the specific contents or supplementary materials provided to ascertain if additional resources or data are available.
14. How can I stay updated on further developments or reports in the Green Building Materials Industry?
To stay informed about further developments, trends, and reports in the Green Building Materials Industry, consider subscribing to industry newsletters, following relevant companies and organizations, or regularly checking reputable industry news sources and publications.
Methodology
Step 1 - Identification of Relevant Samples Size from Population Database


Step 2 - Approaches for Defining Global Market Size (Value, Volume* & Price*)

Note*: In applicable scenarios
Step 3 - Data Sources
Primary Research
- Web Analytics
- Survey Reports
- Research Institute
- Latest Research Reports
- Opinion Leaders
Secondary Research
- Annual Reports
- White Paper
- Latest Press Release
- Industry Association
- Paid Database
- Investor Presentations

Step 4 - Data Triangulation
Involves using different sources of information in order to increase the validity of a study
These sources are likely to be stakeholders in a program - participants, other researchers, program staff, other community members, and so on.
Then we put all data in single framework & apply various statistical tools to find out the dynamic on the market.
During the analysis stage, feedback from the stakeholder groups would be compared to determine areas of agreement as well as areas of divergence
