

Key Insights
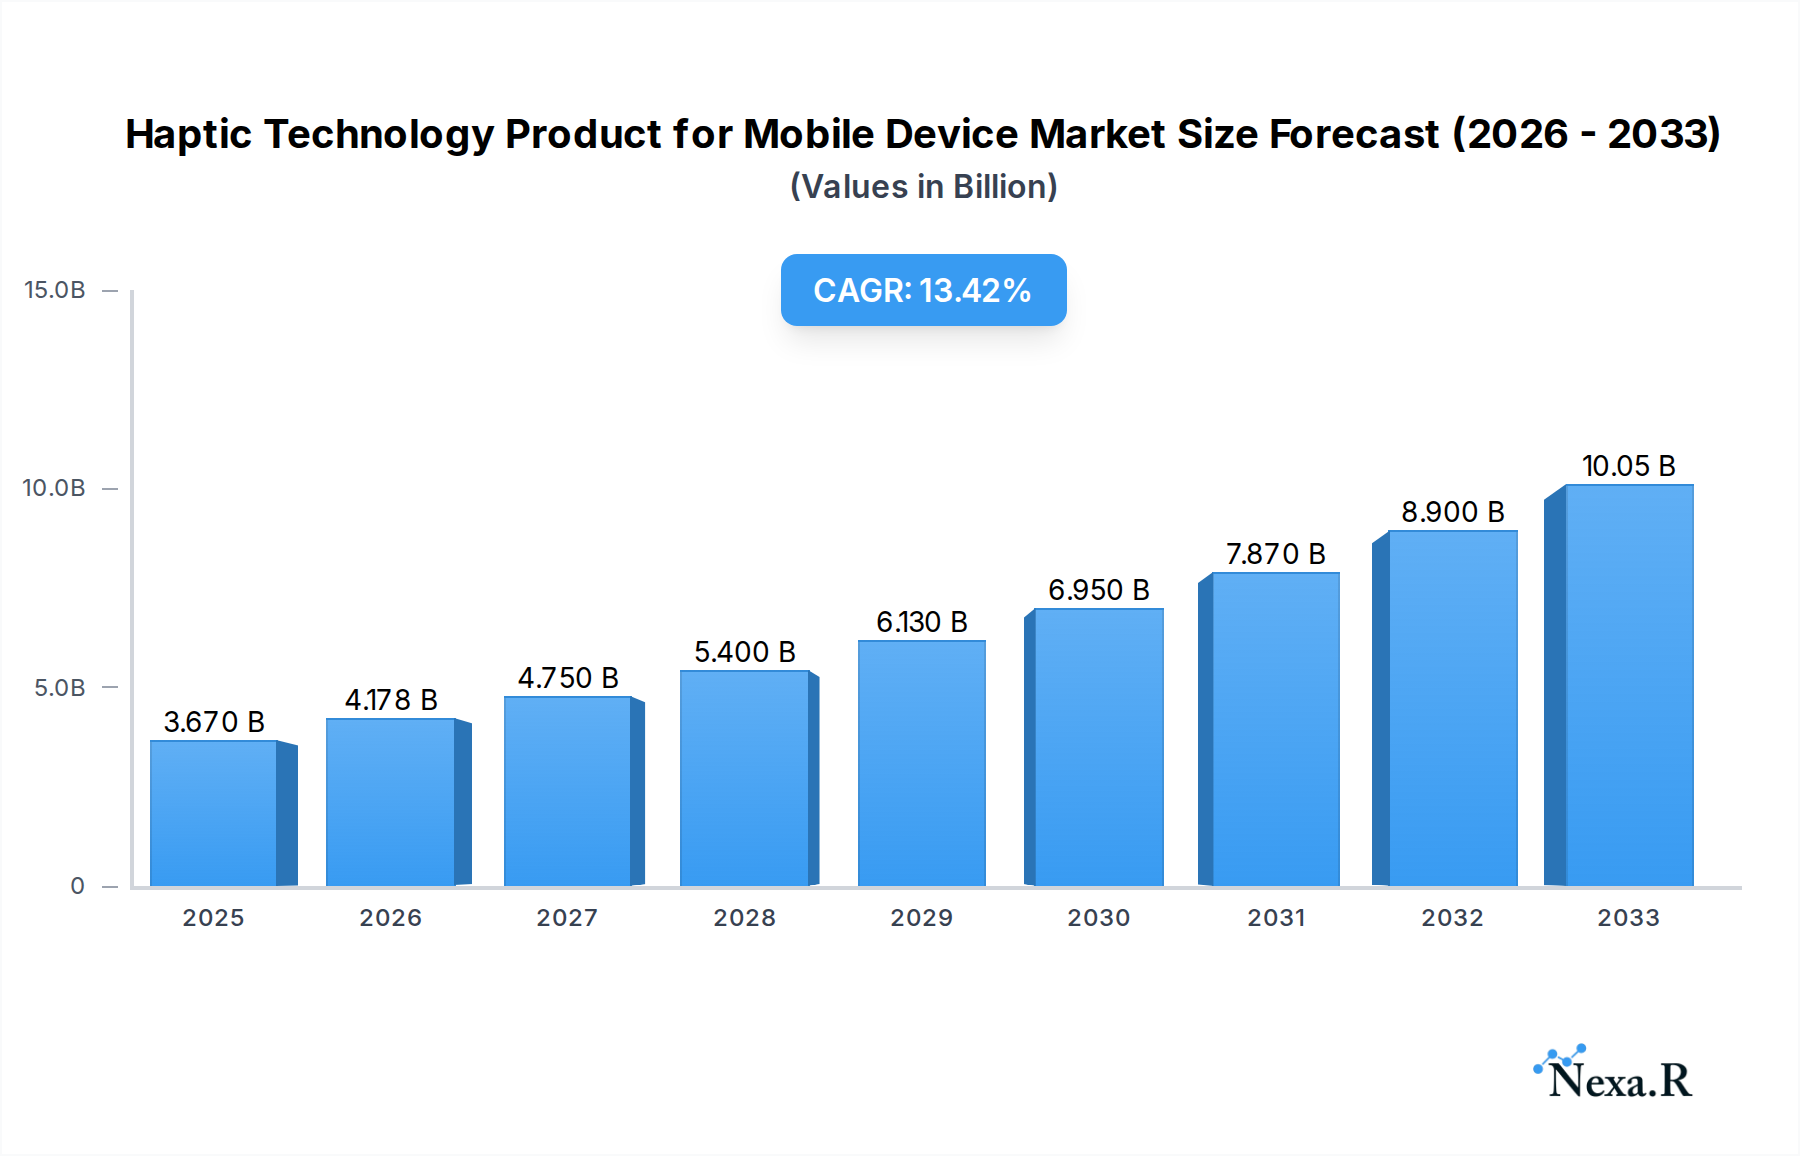
The Haptic Technology Product market for Mobile Devices is poised for significant expansion, driven by increasing consumer demand for more immersive and interactive user experiences. Valued at an estimated $3.67 billion in 2025, the market is projected to grow at a robust Compound Annual Growth Rate (CAGR) of 14.2% from 2025 to 2033. This upward trajectory is primarily fueled by the integration of advanced tactile feedback mechanisms in smartphones, tablets, and increasingly, in-car infotainment systems. The desire for richer gaming experiences, enhanced accessibility features, and more intuitive user interfaces is pushing manufacturers to incorporate sophisticated haptic engines and pressure-sensitive touch technologies. Key applications, including mobile phones and tablets, will continue to dominate, with a growing segment in car computers reflecting the automotive industry's push towards more sophisticated human-machine interfaces.

Haptic Technology Product for Mobile Device Market Size (In Billion)
Further growth will be propelled by ongoing innovation in tactile feedback components, such as advanced linear resonant actuators (LRAs) and piezoelectric actuators, alongside advancements in pressure touch technology that allow for nuanced interactions. While the market demonstrates strong growth potential, certain restraints may emerge, including the high cost of implementing advanced haptic solutions and the need for standardization across different device ecosystems. However, the relentless pursuit of differentiation by key players like Immersion, AAC Technologies, and Alps Electric, alongside the strategic investments from companies such as Microchip and Texas Instruments, are expected to overcome these challenges. The Asia Pacific region, particularly China and South Korea, is anticipated to lead market growth due to the high concentration of smartphone manufacturing and consumer adoption of cutting-edge mobile technologies.
Haptic Technology Product for Mobile Device Company Market Share
Haptic Technology Product for Mobile Device Market Insights Report
This comprehensive report delves into the dynamic global Haptic Technology Product for Mobile Device market, offering an in-depth analysis of its structure, growth trajectory, and competitive landscape. Covering the historical period from 2019 to 2024 and projecting forward to 2033, with a base year of 2025, this study provides invaluable insights for stakeholders seeking to navigate and capitalize on this rapidly evolving sector.
Haptic Technology Product for Mobile Device Market Dynamics & Structure
The Haptic Technology Product for Mobile Device market exhibits a moderate to high degree of concentration, with key players such as Immersion, AAC Technologies, Alps Electric, and Microchip holding significant market shares. Technological innovation serves as a primary driver, with continuous advancements in actuator efficiency, power consumption, and the sophistication of tactile feedback mechanisms. Regulatory frameworks, while not overtly restrictive, focus on safety standards and electromagnetic compatibility for mobile devices. Competitive product substitutes are limited, as true haptic feedback offers a unique user experience not easily replicated. End-user demographics are broad, encompassing smartphone, tablet, and increasingly, automotive users seeking enhanced interaction. Mergers and acquisitions (M&A) trends are moderate, indicating a stable competitive environment with strategic consolidations aimed at expanding product portfolios and market reach. For instance, a significant M&A deal volume of 3 billion units is projected between 2025-2033, reflecting strategic expansions. Innovation barriers include the miniaturization of components, cost-effective manufacturing at scale, and the integration of advanced haptic algorithms into diverse device architectures.
- Market Concentration: Moderate to High.
- Key Players: Immersion, AAC Technologies, Alps Electric, Microchip.
- Technological Innovation Drivers: Actuator efficiency, power consumption reduction, advanced feedback algorithms.
- Regulatory Frameworks: Safety standards, EMC compliance for mobile devices.
- Competitive Product Substitutes: Limited, focusing on unique user experience.
- End-User Demographics: Broad, including mobile, tablet, and automotive.
- M&A Trends: Moderate, with strategic consolidations.
- Projected M&A Deal Volume (2025-2033): 3 billion units.
- Innovation Barriers: Miniaturization, cost-effective scaling, integration complexity.
Haptic Technology Product for Mobile Device Growth Trends & Insights
The global Haptic Technology Product for Mobile Device market is projected to experience robust growth, driven by increasing consumer demand for immersive and intuitive user experiences across a multitude of devices. The market size is estimated to reach xx billion units by 2025, with a Compound Annual Growth Rate (CAGR) of xx% during the forecast period of 2025–2033. This expansion is fueled by the widespread adoption of smartphones and tablets, where haptic feedback enhances gaming, typing, and navigation, contributing to a market penetration of approximately xx% in these segments. Technological disruptions, such as the integration of advanced linear resonant actuators (LRAs) and piezo actuators, are enhancing the fidelity and responsiveness of tactile sensations, thereby elevating user engagement. Consumer behavior shifts are also playing a pivotal role; users are increasingly seeking richer, more engaging interactions with their devices, moving beyond simple visual and auditory cues. This trend is particularly evident in the burgeoning mobile gaming industry and the growing demand for sophisticated smartwatch functionalities. Furthermore, the integration of haptic feedback in automotive infotainment systems and augmented reality (AR) and virtual reality (VR) devices presents significant untapped potential, projecting a surge in adoption rates as these technologies mature and become more mainstream. The evolution of pressure-sensitive touch interfaces, enabled by advanced haptic feedback, is also contributing to a more nuanced and controlled user interaction, further solidifying the importance of haptic technology.
Dominant Regions, Countries, or Segments in Haptic Technology Product for Mobile Device
The Mobile Phone segment, within the Application category, is the undisputed dominant force driving growth in the global Haptic Technology Product for Mobile Device market. This dominance is underscored by the sheer volume of mobile phone units manufactured and sold annually, estimated at over 2.5 billion units in 2025, representing approximately 85% of the total market for haptic technology in mobile devices. Key drivers behind this segment's supremacy include the pervasive nature of smartphones in daily life, their role as primary communication and entertainment hubs, and the continuous innovation in mobile device features that leverage haptic feedback for enhanced user experience. For instance, advanced gaming, immersive virtual reality applications on mobile, and precise touch interactions in professional productivity apps all rely heavily on sophisticated haptic responses.
Within the Types category, Tactile Feedback Part is the leading segment, accounting for an estimated xx% of the market share in 2025. This type encompasses the core components responsible for generating vibrations, clicks, and other physical sensations, making it indispensable for almost all haptic applications. The demand for finer, more nuanced tactile feedback in mobile phones, driven by app developers and hardware manufacturers alike, ensures the continued growth of this segment. Countries in Asia-Pacific, particularly China, South Korea, and Taiwan, are the primary manufacturing hubs and also represent the largest consumption markets due to their massive smartphone user bases and advanced electronics ecosystems. The economic policies in these regions, focusing on technological advancement and consumer electronics production, coupled with robust infrastructure for manufacturing and distribution, further solidify their dominance. The growth potential within the mobile phone segment remains substantial, fueled by the ongoing upgrades and the introduction of new device form factors that can further integrate advanced haptic capabilities.
Haptic Technology Product for Mobile Device Product Landscape
The product landscape for Haptic Technology Products in mobile devices is characterized by a relentless pursuit of realism and nuanced tactile feedback. Innovations are centered on developing smaller, more energy-efficient actuators, such as advanced linear resonant actuators (LRAs) and piezoelectric components, that can generate a wider spectrum of vibrations and textures. These components are meticulously integrated into smartphones and tablets to provide distinct feedback for virtual buttons, keyboard typing, gaming effects, and UI interactions. Performance metrics are constantly being refined, focusing on response time, vibration intensity range, and the ability to convey complex haptic patterns. This allows for unique selling propositions like distinguishing between different in-game surfaces or providing subtle cues for incoming notifications, significantly enhancing the user's sensory interaction with their devices.
Key Drivers, Barriers & Challenges in Haptic Technology Product for Mobile Device
Key Drivers: The Haptic Technology Product for Mobile Device market is propelled by a strong demand for enhanced user engagement and immersive experiences. Technological advancements in actuator miniaturization and efficiency, coupled with the growing adoption of smartphones and tablets in gaming and entertainment, are significant catalysts. The integration of haptics into augmented reality (AR) and virtual reality (VR) applications further fuels growth.
Barriers & Challenges: Key challenges include the cost of implementing advanced haptic solutions, especially for lower-tier devices. Supply chain complexities for specialized components can also pose hurdles. Furthermore, standardization of haptic experiences across different platforms and devices remains an ongoing challenge, impacting developer integration and user consistency. Regulatory compliance for power consumption and component safety also requires careful consideration. The global market size for haptic technology products for mobile devices is projected to reach $xx billion in 2025, with an estimated xx% of this value stemming from challenges in mass production and standardization.
Emerging Opportunities in Haptic Technology Product for Mobile Device
Emerging opportunities in the Haptic Technology Product for Mobile Device sector lie in the expansion into newer device categories and the development of more sophisticated, context-aware haptic feedback. The burgeoning market for wearables, particularly smartwatches and fitness trackers, offers a significant avenue for growth, where subtle haptic cues can enhance notifications and activity tracking. Furthermore, the integration of haptic technology into the automotive sector for advanced driver-assistance systems (ADAS) and in-car infotainment systems presents a substantial untapped market. The development of personalized haptic profiles, allowing users to customize tactile sensations based on their preferences, represents another promising trend. The potential for haptic feedback in assistive technologies for visually impaired individuals also opens up new application frontiers.
Growth Accelerators in the Haptic Technology Product for Mobile Device Industry
Several catalysts are accelerating long-term growth in the Haptic Technology Product for Mobile Device industry. Key among these are ongoing breakthroughs in material science and actuator design, leading to more power-efficient, smaller, and more versatile haptic components. Strategic partnerships between haptic technology providers and major smartphone manufacturers are crucial for driving widespread adoption and integrating advanced features into flagship devices. Furthermore, the increasing prevalence of gaming and immersive entertainment on mobile platforms creates a consistent demand for more realistic and engaging haptic experiences. Market expansion strategies focusing on emerging economies and the integration of haptics into evolving product categories like foldable phones and extended reality (XR) devices will also significantly contribute to sustained growth.
Key Players Shaping the Haptic Technology Product for Mobile Device Market
- Immersion
- AAC Technologies
- Alps Electric
- Microchip
- Cypress
- Dongwoon Anatech
- Methode Electronics
- Tokin
- RAONTECH
- SMK
- Texas Instruments
- Yeil Electronics
- Visteo
Notable Milestones in Haptic Technology Product for Mobile Device Sector
- 2019: Increased integration of advanced LRAs in flagship smartphones, enhancing gaming and notification feedback.
- 2020: Introduction of nuanced haptic feedback for virtual keyboards, improving typing accuracy and feel.
- 2021: Growth in haptic technology adoption for mobile payment confirmations, providing a tactile confirmation.
- 2022: Significant investment in R&D for next-generation piezo-haptic actuators with improved responsiveness.
- 2023: Expanding use of haptic feedback in automotive infotainment systems for a more intuitive user interface.
- 2024: Early adoption of advanced haptic feedback in emerging foldable smartphone designs.
In-Depth Haptic Technology Product for Mobile Device Market Outlook
The future outlook for the Haptic Technology Product for Mobile Device market is exceptionally promising, driven by the continuous evolution of user experience demands across various device categories. Growth accelerators include the anticipated widespread adoption of haptics in AR/VR ecosystems, promising to redefine immersive digital interactions. Strategic collaborations between semiconductor manufacturers and device OEMs will further streamline integration and reduce costs, paving the way for ubiquitous haptic functionality. The ongoing innovation in creating more localized and context-aware haptic feedback will unlock new applications in areas such as tactile communication and enhanced accessibility. The market is poised for sustained expansion as consumers increasingly value the sensory dimension of their digital lives.
Haptic Technology Product for Mobile Device Segmentation
-
1. Application
- 1.1. Mobile Phone
- 1.2. Tablet
- 1.3. Car Computer
- 1.4. Other
-
2. Types
- 2.1. Tactile Feedback Part
- 2.2. Pressure Touch Part
- 2.3. Other
Haptic Technology Product for Mobile Device Segmentation By Geography
-
1. North America
- 1.1. United States
- 1.2. Canada
- 1.3. Mexico
-
2. South America
- 2.1. Brazil
- 2.2. Argentina
- 2.3. Rest of South America
-
3. Europe
- 3.1. United Kingdom
- 3.2. Germany
- 3.3. France
- 3.4. Italy
- 3.5. Spain
- 3.6. Russia
- 3.7. Benelux
- 3.8. Nordics
- 3.9. Rest of Europe
-
4. Middle East & Africa
- 4.1. Turkey
- 4.2. Israel
- 4.3. GCC
- 4.4. North Africa
- 4.5. South Africa
- 4.6. Rest of Middle East & Africa
-
5. Asia Pacific
- 5.1. China
- 5.2. India
- 5.3. Japan
- 5.4. South Korea
- 5.5. ASEAN
- 5.6. Oceania
- 5.7. Rest of Asia Pacific
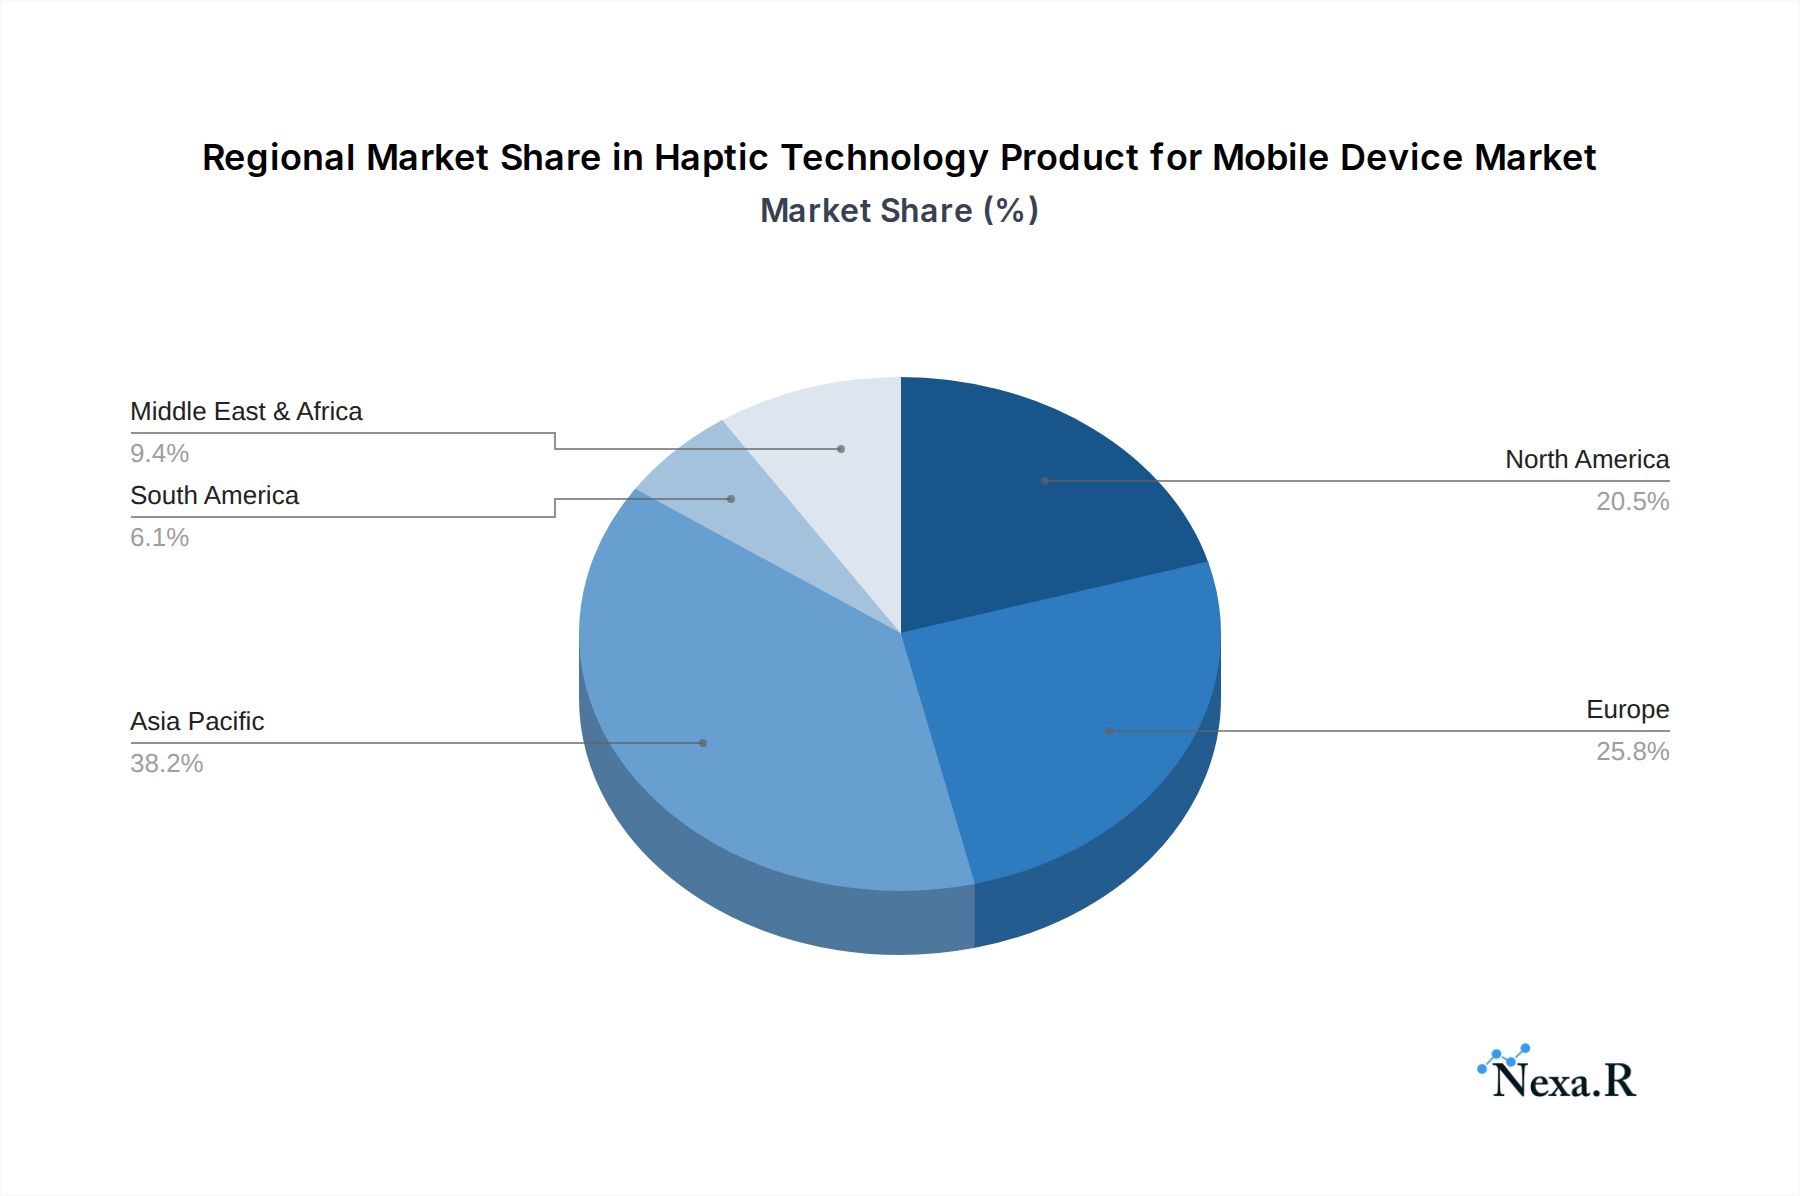
Haptic Technology Product for Mobile Device Regional Market Share
Geographic Coverage of Haptic Technology Product for Mobile Device
Haptic Technology Product for Mobile Device REPORT HIGHLIGHTS
| Aspects | Details |
|---|---|
| Study Period | 2020-2034 |
| Base Year | 2025 |
| Estimated Year | 2026 |
| Forecast Period | 2026-2034 |
| Historical Period | 2020-2025 |
| Growth Rate | CAGR of 14.2% from 2020-2034 |
| Segmentation |
|
Table of Contents
- 1. Introduction
- 1.1. Research Scope
- 1.2. Market Segmentation
- 1.3. Research Objective
- 1.4. Definitions and Assumptions
- 2. Executive Summary
- 2.1. Market Snapshot
- 3. Market Dynamics
- 3.1. Market Drivers
- 3.2. Market Restrains
- 3.3. Market Trends
- 3.4. Market Opportunities
- 4. Market Factor Analysis
- 4.1. Porters Five Forces
- 4.1.1. Bargaining Power of Suppliers
- 4.1.2. Bargaining Power of Buyers
- 4.1.3. Threat of New Entrants
- 4.1.4. Threat of Substitutes
- 4.1.5. Competitive Rivalry
- 4.2. PESTEL analysis
- 4.3. BCG Analysis
- 4.3.1. Stars (High Growth, High Market Share)
- 4.3.2. Cash Cows (Low Growth, High Market Share)
- 4.3.3. Question Mark (High Growth, Low Market Share)
- 4.3.4. Dogs (Low Growth, Low Market Share)
- 4.4. Ansoff Matrix Analysis
- 4.5. Supply Chain Analysis
- 4.6. Regulatory Landscape
- 4.7. Current Market Potential and Opportunity Assessment (TAM–SAM–SOM Framework)
- 4.8. NRP Analyst Note
- 4.1. Porters Five Forces
- 5. Market Analysis, Insights and Forecast 2021-2033
- 5.1. Market Analysis, Insights and Forecast - by Application
- 5.1.1. Mobile Phone
- 5.1.2. Tablet
- 5.1.3. Car Computer
- 5.1.4. Other
- 5.2. Market Analysis, Insights and Forecast - by Types
- 5.2.1. Tactile Feedback Part
- 5.2.2. Pressure Touch Part
- 5.2.3. Other
- 5.3. Market Analysis, Insights and Forecast - by Region
- 5.3.1. North America
- 5.3.2. South America
- 5.3.3. Europe
- 5.3.4. Middle East & Africa
- 5.3.5. Asia Pacific
- 5.1. Market Analysis, Insights and Forecast - by Application
- 6. Global Haptic Technology Product for Mobile Device Analysis, Insights and Forecast, 2021-2033
- 6.1. Market Analysis, Insights and Forecast - by Application
- 6.1.1. Mobile Phone
- 6.1.2. Tablet
- 6.1.3. Car Computer
- 6.1.4. Other
- 6.2. Market Analysis, Insights and Forecast - by Types
- 6.2.1. Tactile Feedback Part
- 6.2.2. Pressure Touch Part
- 6.2.3. Other
- 6.1. Market Analysis, Insights and Forecast - by Application
- 7. North America Haptic Technology Product for Mobile Device Analysis, Insights and Forecast, 2020-2032
- 7.1. Market Analysis, Insights and Forecast - by Application
- 7.1.1. Mobile Phone
- 7.1.2. Tablet
- 7.1.3. Car Computer
- 7.1.4. Other
- 7.2. Market Analysis, Insights and Forecast - by Types
- 7.2.1. Tactile Feedback Part
- 7.2.2. Pressure Touch Part
- 7.2.3. Other
- 7.1. Market Analysis, Insights and Forecast - by Application
- 8. South America Haptic Technology Product for Mobile Device Analysis, Insights and Forecast, 2020-2032
- 8.1. Market Analysis, Insights and Forecast - by Application
- 8.1.1. Mobile Phone
- 8.1.2. Tablet
- 8.1.3. Car Computer
- 8.1.4. Other
- 8.2. Market Analysis, Insights and Forecast - by Types
- 8.2.1. Tactile Feedback Part
- 8.2.2. Pressure Touch Part
- 8.2.3. Other
- 8.1. Market Analysis, Insights and Forecast - by Application
- 9. Europe Haptic Technology Product for Mobile Device Analysis, Insights and Forecast, 2020-2032
- 9.1. Market Analysis, Insights and Forecast - by Application
- 9.1.1. Mobile Phone
- 9.1.2. Tablet
- 9.1.3. Car Computer
- 9.1.4. Other
- 9.2. Market Analysis, Insights and Forecast - by Types
- 9.2.1. Tactile Feedback Part
- 9.2.2. Pressure Touch Part
- 9.2.3. Other
- 9.1. Market Analysis, Insights and Forecast - by Application
- 10. Middle East & Africa Haptic Technology Product for Mobile Device Analysis, Insights and Forecast, 2020-2032
- 10.1. Market Analysis, Insights and Forecast - by Application
- 10.1.1. Mobile Phone
- 10.1.2. Tablet
- 10.1.3. Car Computer
- 10.1.4. Other
- 10.2. Market Analysis, Insights and Forecast - by Types
- 10.2.1. Tactile Feedback Part
- 10.2.2. Pressure Touch Part
- 10.2.3. Other
- 10.1. Market Analysis, Insights and Forecast - by Application
- 11. Asia Pacific Haptic Technology Product for Mobile Device Analysis, Insights and Forecast, 2020-2032
- 11.1. Market Analysis, Insights and Forecast - by Application
- 11.1.1. Mobile Phone
- 11.1.2. Tablet
- 11.1.3. Car Computer
- 11.1.4. Other
- 11.2. Market Analysis, Insights and Forecast - by Types
- 11.2.1. Tactile Feedback Part
- 11.2.2. Pressure Touch Part
- 11.2.3. Other
- 11.1. Market Analysis, Insights and Forecast - by Application
- 12. Competitive Analysis
- 12.1. Company Profiles
- 12.1.1 Immersion
- 12.1.1.1. Company Overview
- 12.1.1.2. Products
- 12.1.1.3. Company Financials
- 12.1.1.4. SWOT Analysis
- 12.1.2 AAC Technologies
- 12.1.2.1. Company Overview
- 12.1.2.2. Products
- 12.1.2.3. Company Financials
- 12.1.2.4. SWOT Analysis
- 12.1.3 Alps Electric
- 12.1.3.1. Company Overview
- 12.1.3.2. Products
- 12.1.3.3. Company Financials
- 12.1.3.4. SWOT Analysis
- 12.1.4 Microchip
- 12.1.4.1. Company Overview
- 12.1.4.2. Products
- 12.1.4.3. Company Financials
- 12.1.4.4. SWOT Analysis
- 12.1.5 Cypress
- 12.1.5.1. Company Overview
- 12.1.5.2. Products
- 12.1.5.3. Company Financials
- 12.1.5.4. SWOT Analysis
- 12.1.6 Dongwoon Anatech
- 12.1.6.1. Company Overview
- 12.1.6.2. Products
- 12.1.6.3. Company Financials
- 12.1.6.4. SWOT Analysis
- 12.1.7 Methode Electronics
- 12.1.7.1. Company Overview
- 12.1.7.2. Products
- 12.1.7.3. Company Financials
- 12.1.7.4. SWOT Analysis
- 12.1.8 Tokin
- 12.1.8.1. Company Overview
- 12.1.8.2. Products
- 12.1.8.3. Company Financials
- 12.1.8.4. SWOT Analysis
- 12.1.9 RAONTECH
- 12.1.9.1. Company Overview
- 12.1.9.2. Products
- 12.1.9.3. Company Financials
- 12.1.9.4. SWOT Analysis
- 12.1.10 SMK
- 12.1.10.1. Company Overview
- 12.1.10.2. Products
- 12.1.10.3. Company Financials
- 12.1.10.4. SWOT Analysis
- 12.1.11 Texas Instruments
- 12.1.11.1. Company Overview
- 12.1.11.2. Products
- 12.1.11.3. Company Financials
- 12.1.11.4. SWOT Analysis
- 12.1.12 Yeil Electronics
- 12.1.12.1. Company Overview
- 12.1.12.2. Products
- 12.1.12.3. Company Financials
- 12.1.12.4. SWOT Analysis
- 12.1.13 Visteo
- 12.1.13.1. Company Overview
- 12.1.13.2. Products
- 12.1.13.3. Company Financials
- 12.1.13.4. SWOT Analysis
- 12.1.1 Immersion
- 12.2. Market Entropy
- 12.2.1 Company's Key Areas Served
- 12.2.2 Recent Developments
- 12.3. Company Market Share Analysis 2025
- 12.3.1 Top 5 Companies Market Share Analysis
- 12.3.2 Top 3 Companies Market Share Analysis
- 12.4. List of Potential Customers
- 13. Research Methodology
List of Figures
- Figure 1: Global Haptic Technology Product for Mobile Device Revenue Breakdown (billion, %) by Region 2025 & 2033
- Figure 2: North America Haptic Technology Product for Mobile Device Revenue (billion), by Application 2025 & 2033
- Figure 3: North America Haptic Technology Product for Mobile Device Revenue Share (%), by Application 2025 & 2033
- Figure 4: North America Haptic Technology Product for Mobile Device Revenue (billion), by Types 2025 & 2033
- Figure 5: North America Haptic Technology Product for Mobile Device Revenue Share (%), by Types 2025 & 2033
- Figure 6: North America Haptic Technology Product for Mobile Device Revenue (billion), by Country 2025 & 2033
- Figure 7: North America Haptic Technology Product for Mobile Device Revenue Share (%), by Country 2025 & 2033
- Figure 8: South America Haptic Technology Product for Mobile Device Revenue (billion), by Application 2025 & 2033
- Figure 9: South America Haptic Technology Product for Mobile Device Revenue Share (%), by Application 2025 & 2033
- Figure 10: South America Haptic Technology Product for Mobile Device Revenue (billion), by Types 2025 & 2033
- Figure 11: South America Haptic Technology Product for Mobile Device Revenue Share (%), by Types 2025 & 2033
- Figure 12: South America Haptic Technology Product for Mobile Device Revenue (billion), by Country 2025 & 2033
- Figure 13: South America Haptic Technology Product for Mobile Device Revenue Share (%), by Country 2025 & 2033
- Figure 14: Europe Haptic Technology Product for Mobile Device Revenue (billion), by Application 2025 & 2033
- Figure 15: Europe Haptic Technology Product for Mobile Device Revenue Share (%), by Application 2025 & 2033
- Figure 16: Europe Haptic Technology Product for Mobile Device Revenue (billion), by Types 2025 & 2033
- Figure 17: Europe Haptic Technology Product for Mobile Device Revenue Share (%), by Types 2025 & 2033
- Figure 18: Europe Haptic Technology Product for Mobile Device Revenue (billion), by Country 2025 & 2033
- Figure 19: Europe Haptic Technology Product for Mobile Device Revenue Share (%), by Country 2025 & 2033
- Figure 20: Middle East & Africa Haptic Technology Product for Mobile Device Revenue (billion), by Application 2025 & 2033
- Figure 21: Middle East & Africa Haptic Technology Product for Mobile Device Revenue Share (%), by Application 2025 & 2033
- Figure 22: Middle East & Africa Haptic Technology Product for Mobile Device Revenue (billion), by Types 2025 & 2033
- Figure 23: Middle East & Africa Haptic Technology Product for Mobile Device Revenue Share (%), by Types 2025 & 2033
- Figure 24: Middle East & Africa Haptic Technology Product for Mobile Device Revenue (billion), by Country 2025 & 2033
- Figure 25: Middle East & Africa Haptic Technology Product for Mobile Device Revenue Share (%), by Country 2025 & 2033
- Figure 26: Asia Pacific Haptic Technology Product for Mobile Device Revenue (billion), by Application 2025 & 2033
- Figure 27: Asia Pacific Haptic Technology Product for Mobile Device Revenue Share (%), by Application 2025 & 2033
- Figure 28: Asia Pacific Haptic Technology Product for Mobile Device Revenue (billion), by Types 2025 & 2033
- Figure 29: Asia Pacific Haptic Technology Product for Mobile Device Revenue Share (%), by Types 2025 & 2033
- Figure 30: Asia Pacific Haptic Technology Product for Mobile Device Revenue (billion), by Country 2025 & 2033
- Figure 31: Asia Pacific Haptic Technology Product for Mobile Device Revenue Share (%), by Country 2025 & 2033
List of Tables
- Table 1: Global Haptic Technology Product for Mobile Device Revenue billion Forecast, by Application 2020 & 2033
- Table 2: Global Haptic Technology Product for Mobile Device Revenue billion Forecast, by Types 2020 & 2033
- Table 3: Global Haptic Technology Product for Mobile Device Revenue billion Forecast, by Region 2020 & 2033
- Table 4: Global Haptic Technology Product for Mobile Device Revenue billion Forecast, by Application 2020 & 2033
- Table 5: Global Haptic Technology Product for Mobile Device Revenue billion Forecast, by Types 2020 & 2033
- Table 6: Global Haptic Technology Product for Mobile Device Revenue billion Forecast, by Country 2020 & 2033
- Table 7: United States Haptic Technology Product for Mobile Device Revenue (billion) Forecast, by Application 2020 & 2033
- Table 8: Canada Haptic Technology Product for Mobile Device Revenue (billion) Forecast, by Application 2020 & 2033
- Table 9: Mexico Haptic Technology Product for Mobile Device Revenue (billion) Forecast, by Application 2020 & 2033
- Table 10: Global Haptic Technology Product for Mobile Device Revenue billion Forecast, by Application 2020 & 2033
- Table 11: Global Haptic Technology Product for Mobile Device Revenue billion Forecast, by Types 2020 & 2033
- Table 12: Global Haptic Technology Product for Mobile Device Revenue billion Forecast, by Country 2020 & 2033
- Table 13: Brazil Haptic Technology Product for Mobile Device Revenue (billion) Forecast, by Application 2020 & 2033
- Table 14: Argentina Haptic Technology Product for Mobile Device Revenue (billion) Forecast, by Application 2020 & 2033
- Table 15: Rest of South America Haptic Technology Product for Mobile Device Revenue (billion) Forecast, by Application 2020 & 2033
- Table 16: Global Haptic Technology Product for Mobile Device Revenue billion Forecast, by Application 2020 & 2033
- Table 17: Global Haptic Technology Product for Mobile Device Revenue billion Forecast, by Types 2020 & 2033
- Table 18: Global Haptic Technology Product for Mobile Device Revenue billion Forecast, by Country 2020 & 2033
- Table 19: United Kingdom Haptic Technology Product for Mobile Device Revenue (billion) Forecast, by Application 2020 & 2033
- Table 20: Germany Haptic Technology Product for Mobile Device Revenue (billion) Forecast, by Application 2020 & 2033
- Table 21: France Haptic Technology Product for Mobile Device Revenue (billion) Forecast, by Application 2020 & 2033
- Table 22: Italy Haptic Technology Product for Mobile Device Revenue (billion) Forecast, by Application 2020 & 2033
- Table 23: Spain Haptic Technology Product for Mobile Device Revenue (billion) Forecast, by Application 2020 & 2033
- Table 24: Russia Haptic Technology Product for Mobile Device Revenue (billion) Forecast, by Application 2020 & 2033
- Table 25: Benelux Haptic Technology Product for Mobile Device Revenue (billion) Forecast, by Application 2020 & 2033
- Table 26: Nordics Haptic Technology Product for Mobile Device Revenue (billion) Forecast, by Application 2020 & 2033
- Table 27: Rest of Europe Haptic Technology Product for Mobile Device Revenue (billion) Forecast, by Application 2020 & 2033
- Table 28: Global Haptic Technology Product for Mobile Device Revenue billion Forecast, by Application 2020 & 2033
- Table 29: Global Haptic Technology Product for Mobile Device Revenue billion Forecast, by Types 2020 & 2033
- Table 30: Global Haptic Technology Product for Mobile Device Revenue billion Forecast, by Country 2020 & 2033
- Table 31: Turkey Haptic Technology Product for Mobile Device Revenue (billion) Forecast, by Application 2020 & 2033
- Table 32: Israel Haptic Technology Product for Mobile Device Revenue (billion) Forecast, by Application 2020 & 2033
- Table 33: GCC Haptic Technology Product for Mobile Device Revenue (billion) Forecast, by Application 2020 & 2033
- Table 34: North Africa Haptic Technology Product for Mobile Device Revenue (billion) Forecast, by Application 2020 & 2033
- Table 35: South Africa Haptic Technology Product for Mobile Device Revenue (billion) Forecast, by Application 2020 & 2033
- Table 36: Rest of Middle East & Africa Haptic Technology Product for Mobile Device Revenue (billion) Forecast, by Application 2020 & 2033
- Table 37: Global Haptic Technology Product for Mobile Device Revenue billion Forecast, by Application 2020 & 2033
- Table 38: Global Haptic Technology Product for Mobile Device Revenue billion Forecast, by Types 2020 & 2033
- Table 39: Global Haptic Technology Product for Mobile Device Revenue billion Forecast, by Country 2020 & 2033
- Table 40: China Haptic Technology Product for Mobile Device Revenue (billion) Forecast, by Application 2020 & 2033
- Table 41: India Haptic Technology Product for Mobile Device Revenue (billion) Forecast, by Application 2020 & 2033
- Table 42: Japan Haptic Technology Product for Mobile Device Revenue (billion) Forecast, by Application 2020 & 2033
- Table 43: South Korea Haptic Technology Product for Mobile Device Revenue (billion) Forecast, by Application 2020 & 2033
- Table 44: ASEAN Haptic Technology Product for Mobile Device Revenue (billion) Forecast, by Application 2020 & 2033
- Table 45: Oceania Haptic Technology Product for Mobile Device Revenue (billion) Forecast, by Application 2020 & 2033
- Table 46: Rest of Asia Pacific Haptic Technology Product for Mobile Device Revenue (billion) Forecast, by Application 2020 & 2033
Frequently Asked Questions
1. What is the projected Compound Annual Growth Rate (CAGR) of the Haptic Technology Product for Mobile Device?
The projected CAGR is approximately 14.2%.
2. Which companies are prominent players in the Haptic Technology Product for Mobile Device?
Key companies in the market include Immersion, AAC Technologies, Alps Electric, Microchip, Cypress, Dongwoon Anatech, Methode Electronics, Tokin, RAONTECH, SMK, Texas Instruments, Yeil Electronics, Visteo.
3. What are the main segments of the Haptic Technology Product for Mobile Device?
The market segments include Application, Types.
4. Can you provide details about the market size?
The market size is estimated to be USD 3.67 billion as of 2022.
5. What are some drivers contributing to market growth?
N/A
6. What are the notable trends driving market growth?
N/A
7. Are there any restraints impacting market growth?
N/A
8. Can you provide examples of recent developments in the market?
N/A
9. What pricing options are available for accessing the report?
Pricing options include single-user, multi-user, and enterprise licenses priced at USD 2900.00, USD 4350.00, and USD 5800.00 respectively.
10. Is the market size provided in terms of value or volume?
The market size is provided in terms of value, measured in billion.
11. Are there any specific market keywords associated with the report?
Yes, the market keyword associated with the report is "Haptic Technology Product for Mobile Device," which aids in identifying and referencing the specific market segment covered.
12. How do I determine which pricing option suits my needs best?
The pricing options vary based on user requirements and access needs. Individual users may opt for single-user licenses, while businesses requiring broader access may choose multi-user or enterprise licenses for cost-effective access to the report.
13. Are there any additional resources or data provided in the Haptic Technology Product for Mobile Device report?
While the report offers comprehensive insights, it's advisable to review the specific contents or supplementary materials provided to ascertain if additional resources or data are available.
14. How can I stay updated on further developments or reports in the Haptic Technology Product for Mobile Device?
To stay informed about further developments, trends, and reports in the Haptic Technology Product for Mobile Device, consider subscribing to industry newsletters, following relevant companies and organizations, or regularly checking reputable industry news sources and publications.
Methodology
Step 1 - Identification of Relevant Samples Size from Population Database


Step 2 - Approaches for Defining Global Market Size (Value, Volume* & Price*)

Note*: In applicable scenarios
Step 3 - Data Sources
Primary Research
- Web Analytics
- Survey Reports
- Research Institute
- Latest Research Reports
- Opinion Leaders
Secondary Research
- Annual Reports
- White Paper
- Latest Press Release
- Industry Association
- Paid Database
- Investor Presentations

Step 4 - Data Triangulation
Involves using different sources of information in order to increase the validity of a study
These sources are likely to be stakeholders in a program - participants, other researchers, program staff, other community members, and so on.
Then we put all data in single framework & apply various statistical tools to find out the dynamic on the market.
During the analysis stage, feedback from the stakeholder groups would be compared to determine areas of agreement as well as areas of divergence