

Key Insights
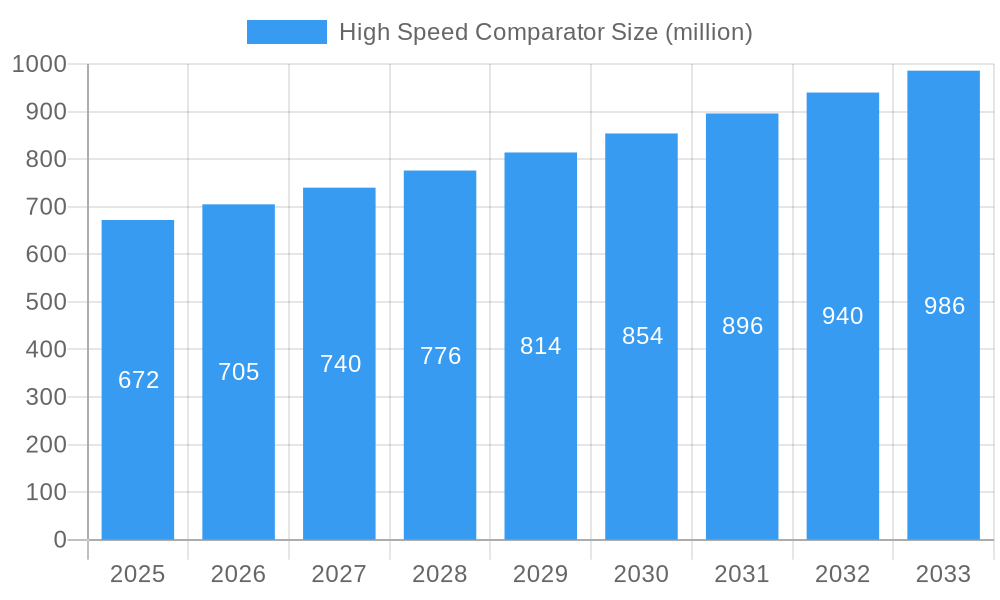
The high-speed comparator market, valued at $672 million in 2025, is projected to experience robust growth, driven by increasing demand across diverse sectors. The Compound Annual Growth Rate (CAGR) of 4.9% from 2025 to 2033 indicates a steady expansion, fueled primarily by the burgeoning automotive industry's need for advanced driver-assistance systems (ADAS) and electric vehicles (EVs). Furthermore, the expansion of high-speed data communication networks and the growing adoption of high-frequency applications in industrial automation and medical devices significantly contribute to market growth. Key players like STMicroelectronics, Texas Instruments, and Analog Devices are shaping the market landscape through continuous innovation and product diversification, focusing on improved performance, smaller form factors, and lower power consumption. Competition is fierce, with established players and emerging companies vying for market share.
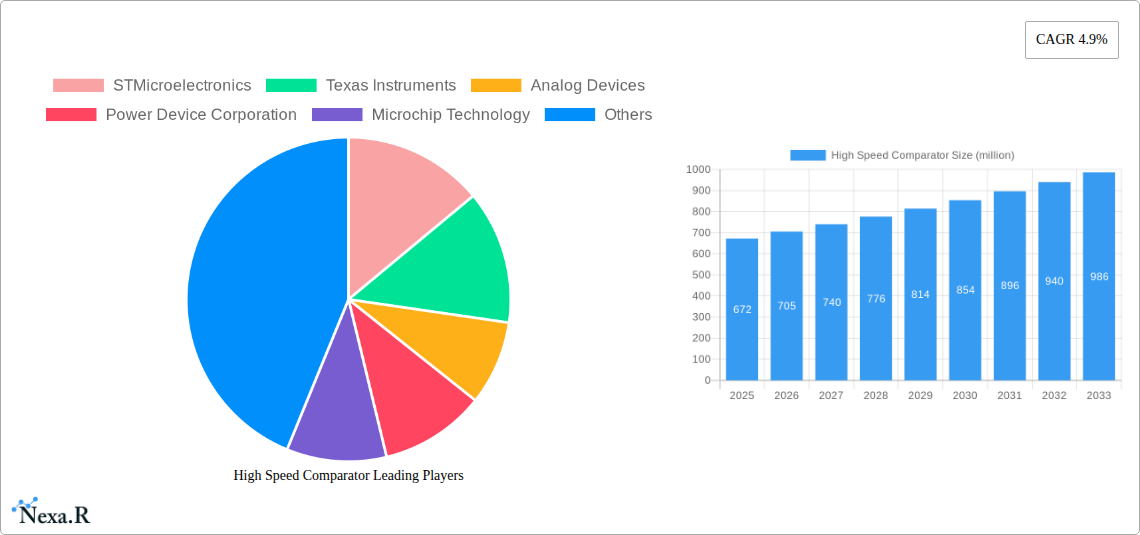
High Speed Comparator Market Size (In Million)
Market restraints include the inherent complexity in designing and manufacturing high-speed comparators, requiring advanced technologies and meticulous testing. The fluctuating prices of raw materials and the dependence on global supply chains also present challenges. However, ongoing technological advancements in semiconductor technology, including improvements in speed, precision, and power efficiency, are expected to mitigate these challenges and further propel market expansion. The market is segmented by application (automotive, industrial, communication, medical, consumer electronics), technology (CMOS, BiCMOS), and region. While precise regional data is unavailable, North America and Asia-Pacific are anticipated to dominate the market given their strong presence in the automotive and electronics industries. The forecast period of 2025-2033 anticipates continued growth driven by innovation and rising demand across various applications, particularly within high-growth sectors like 5G and the Internet of Things (IoT).
High Speed Comparator Company Market Share
High Speed Comparator Market Report: 2019-2033
This comprehensive report provides an in-depth analysis of the High Speed Comparator market, encompassing market dynamics, growth trends, regional dominance, product landscape, challenges, opportunities, key players, and future outlook. The study period spans 2019-2033, with 2025 serving as the base and estimated year. The forecast period covers 2025-2033, while the historical period analyzed is 2019-2024. This report is crucial for industry professionals, investors, and anyone seeking a comprehensive understanding of this rapidly evolving market segment within the broader electronics components market.
High Speed Comparator Market Dynamics & Structure
The high-speed comparator market is characterized by a moderately concentrated landscape, with key players like STMicroelectronics, Texas Instruments, and Analog Devices holding significant market share (estimated at 60% collectively in 2025). Technological innovation, driven by the demand for faster data processing speeds in applications such as high-speed data acquisition and signal processing, is a major growth driver. Stringent regulatory frameworks concerning electronic component reliability and safety also influence market dynamics. Competitive substitutes, such as specialized op-amps and other high-speed signal processing ICs, exert pressure. End-user demographics are diverse, spanning automotive, industrial automation, telecommunications, and consumer electronics sectors. M&A activity in the sector is moderate, with approximately xx M&A deals recorded between 2019 and 2024.
- Market Concentration: Highly concentrated, with top 3 players holding ~60% market share in 2025.
- Technological Innovation: Focus on reducing latency, improving accuracy, and increasing bandwidth.
- Regulatory Frameworks: Compliance with industry standards (e.g., ISO, IEC) is essential.
- Competitive Substitutes: Op-amps, specialized signal processing ICs offer alternative solutions.
- End-User Demographics: Automotive, Industrial, Telecommunications, Consumer Electronics dominate.
- M&A Trends: Moderate activity, with xx million USD worth of deals in 2019-2024.
High Speed Comparator Growth Trends & Insights
The high-speed comparator market exhibits robust growth, driven by the increasing demand for high-speed data processing across various sectors. From 2019 to 2024, the market witnessed a CAGR of xx%, reaching a value of xx million units in 2024. This growth is projected to continue, with a forecast CAGR of xx% from 2025 to 2033, reaching xx million units by 2033. Market penetration in key application segments like automotive and industrial automation is increasing, fueled by technological advancements such as improved precision and reduced power consumption. The adoption of high-speed comparators in emerging applications, such as 5G infrastructure and high-performance computing, further contributes to market expansion. Consumer behavior shifts towards more sophisticated electronic devices also boost market demand.
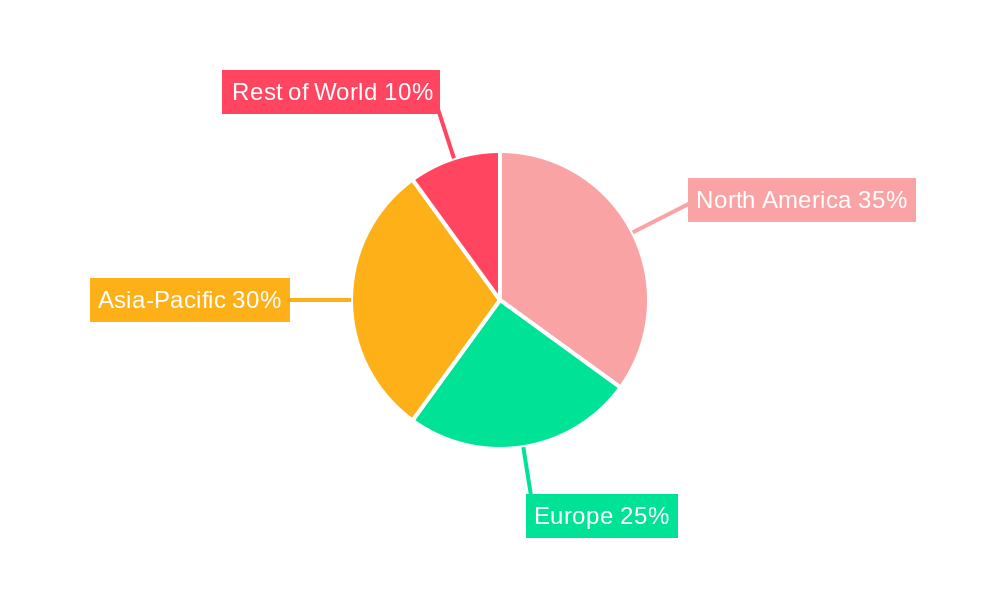
Dominant Regions, Countries, or Segments in High Speed Comparator
North America currently holds the largest market share in the high-speed comparator market, followed by Asia-Pacific. The dominance of North America is attributed to a strong presence of major technology companies, advanced infrastructure, and high investments in research and development. However, Asia-Pacific is projected to witness the fastest growth rate during the forecast period, driven by rising demand from developing economies such as China and India, along with robust growth in the electronics manufacturing sector. Europe also contributes significantly, particularly in the automotive and industrial automation sectors.
- North America: Strong presence of key players, advanced infrastructure, high R&D investment.
- Asia-Pacific: Fastest growth rate, driven by demand from developing economies and electronics manufacturing.
- Europe: Significant contribution, especially in the automotive and industrial sectors.
- Rest of the World: Moderate growth, influenced by local market conditions and technological adoption.
High Speed Comparator Product Landscape
The high-speed comparator market offers a diverse range of products, categorized by parameters such as speed, input voltage range, output current, and power consumption. Recent product innovations focus on enhancing speed, precision, and power efficiency, catering to the demands of high-performance applications. Advancements include the integration of advanced signal processing capabilities and improved noise immunity. Unique selling propositions include ultra-low latency, high common-mode rejection ratio, and wide operating temperature range.
Key Drivers, Barriers & Challenges in High Speed Comparator
Key Drivers:
- Increasing demand for high-speed data processing in various applications.
- Technological advancements leading to improved performance and reduced power consumption.
- Growing adoption of advanced driver-assistance systems (ADAS) in the automotive sector.
- Expansion of 5G and other high-speed communication networks.
Key Challenges:
- Supply chain disruptions impacting the availability of raw materials and components.
- Intense competition from existing and emerging players.
- Regulatory compliance requirements and safety standards for electronic components.
- Fluctuations in raw material prices affecting production costs. This resulted in a xx% increase in production costs in 2022.
Emerging Opportunities in High Speed Comparator
- Expanding applications in emerging technologies like AI and machine learning.
- Growing demand for high-speed comparators in medical devices and healthcare applications.
- Potential for significant market expansion in developing economies.
- Development of energy-efficient high-speed comparators to address sustainability concerns.
Growth Accelerators in the High Speed Comparator Industry
Long-term growth in the high-speed comparator market will be accelerated by technological breakthroughs in areas such as faster switching speeds, reduced power consumption, and improved precision. Strategic partnerships and collaborations between semiconductor manufacturers and system integrators will play a key role. Market expansion into new and untapped applications, such as the Internet of Things (IoT) and smart grids, will also contribute to long-term growth.
Key Players Shaping the High Speed Comparator Market
- STMicroelectronics
- Texas Instruments
- Analog Devices
- Power Device Corporation
- Microchip Technology
- Onsemi
- ROHM
- Fairchild Semiconductors
- Philips SemiConductor
- SG Micro Limited
- National Semiconductor
- Linear Technology
- Trusignal Microelectronics
- Jiangsu Runic Technology
Notable Milestones in High Speed Comparator Sector
- 2020, Q4: Analog Devices launched a new high-speed comparator with ultra-low power consumption.
- 2021, Q2: Texas Instruments announced a strategic partnership with a major automotive manufacturer for ADAS development.
- 2022, Q3: STMicroelectronics acquired a smaller competitor, expanding its market share.
In-Depth High Speed Comparator Market Outlook
The high-speed comparator market is poised for sustained growth over the next decade, driven by technological advancements, increasing adoption across various applications, and expansion into emerging markets. Strategic partnerships and investments in R&D will be crucial for success. Opportunities exist in developing energy-efficient and highly integrated solutions to address sustainability concerns and meet the demands of next-generation electronic systems. Companies with robust innovation capabilities and strong market presence are expected to benefit from this positive market outlook.
High Speed Comparator Segmentation
-
1. Application
- 1.1. Automotive Electronics
- 1.2. Consumer Electronics
- 1.3. Aerospace
- 1.4. Others
-
2. Types
- 2.1. Single Channel
- 2.2. Double Channel
- 2.3. Multi Channel
High Speed Comparator Segmentation By Geography
-
1. North America
- 1.1. United States
- 1.2. Canada
- 1.3. Mexico
-
2. South America
- 2.1. Brazil
- 2.2. Argentina
- 2.3. Rest of South America
-
3. Europe
- 3.1. United Kingdom
- 3.2. Germany
- 3.3. France
- 3.4. Italy
- 3.5. Spain
- 3.6. Russia
- 3.7. Benelux
- 3.8. Nordics
- 3.9. Rest of Europe
-
4. Middle East & Africa
- 4.1. Turkey
- 4.2. Israel
- 4.3. GCC
- 4.4. North Africa
- 4.5. South Africa
- 4.6. Rest of Middle East & Africa
-
5. Asia Pacific
- 5.1. China
- 5.2. India
- 5.3. Japan
- 5.4. South Korea
- 5.5. ASEAN
- 5.6. Oceania
- 5.7. Rest of Asia Pacific
High Speed Comparator Regional Market Share
Geographic Coverage of High Speed Comparator
High Speed Comparator REPORT HIGHLIGHTS
| Aspects | Details |
|---|---|
| Study Period | 2020-2034 |
| Base Year | 2025 |
| Estimated Year | 2026 |
| Forecast Period | 2026-2034 |
| Historical Period | 2020-2025 |
| Growth Rate | CAGR of 4.9% from 2020-2034 |
| Segmentation |
|
Table of Contents
- 1. Introduction
- 1.1. Research Scope
- 1.2. Market Segmentation
- 1.3. Research Objective
- 1.4. Definitions and Assumptions
- 2. Executive Summary
- 2.1. Market Snapshot
- 3. Market Dynamics
- 3.1. Market Drivers
- 3.2. Market Restrains
- 3.3. Market Trends
- 3.4. Market Opportunities
- 4. Market Factor Analysis
- 4.1. Porters Five Forces
- 4.1.1. Bargaining Power of Suppliers
- 4.1.2. Bargaining Power of Buyers
- 4.1.3. Threat of New Entrants
- 4.1.4. Threat of Substitutes
- 4.1.5. Competitive Rivalry
- 4.2. PESTEL analysis
- 4.3. BCG Analysis
- 4.3.1. Stars (High Growth, High Market Share)
- 4.3.2. Cash Cows (Low Growth, High Market Share)
- 4.3.3. Question Mark (High Growth, Low Market Share)
- 4.3.4. Dogs (Low Growth, Low Market Share)
- 4.4. Ansoff Matrix Analysis
- 4.5. Supply Chain Analysis
- 4.6. Regulatory Landscape
- 4.7. Current Market Potential and Opportunity Assessment (TAM–SAM–SOM Framework)
- 4.8. NRP Analyst Note
- 4.1. Porters Five Forces
- 5. Market Analysis, Insights and Forecast 2021-2033
- 5.1. Market Analysis, Insights and Forecast - by Application
- 5.1.1. Automotive Electronics
- 5.1.2. Consumer Electronics
- 5.1.3. Aerospace
- 5.1.4. Others
- 5.2. Market Analysis, Insights and Forecast - by Types
- 5.2.1. Single Channel
- 5.2.2. Double Channel
- 5.2.3. Multi Channel
- 5.3. Market Analysis, Insights and Forecast - by Region
- 5.3.1. North America
- 5.3.2. South America
- 5.3.3. Europe
- 5.3.4. Middle East & Africa
- 5.3.5. Asia Pacific
- 5.1. Market Analysis, Insights and Forecast - by Application
- 6. Global High Speed Comparator Analysis, Insights and Forecast, 2021-2033
- 6.1. Market Analysis, Insights and Forecast - by Application
- 6.1.1. Automotive Electronics
- 6.1.2. Consumer Electronics
- 6.1.3. Aerospace
- 6.1.4. Others
- 6.2. Market Analysis, Insights and Forecast - by Types
- 6.2.1. Single Channel
- 6.2.2. Double Channel
- 6.2.3. Multi Channel
- 6.1. Market Analysis, Insights and Forecast - by Application
- 7. North America High Speed Comparator Analysis, Insights and Forecast, 2020-2032
- 7.1. Market Analysis, Insights and Forecast - by Application
- 7.1.1. Automotive Electronics
- 7.1.2. Consumer Electronics
- 7.1.3. Aerospace
- 7.1.4. Others
- 7.2. Market Analysis, Insights and Forecast - by Types
- 7.2.1. Single Channel
- 7.2.2. Double Channel
- 7.2.3. Multi Channel
- 7.1. Market Analysis, Insights and Forecast - by Application
- 8. South America High Speed Comparator Analysis, Insights and Forecast, 2020-2032
- 8.1. Market Analysis, Insights and Forecast - by Application
- 8.1.1. Automotive Electronics
- 8.1.2. Consumer Electronics
- 8.1.3. Aerospace
- 8.1.4. Others
- 8.2. Market Analysis, Insights and Forecast - by Types
- 8.2.1. Single Channel
- 8.2.2. Double Channel
- 8.2.3. Multi Channel
- 8.1. Market Analysis, Insights and Forecast - by Application
- 9. Europe High Speed Comparator Analysis, Insights and Forecast, 2020-2032
- 9.1. Market Analysis, Insights and Forecast - by Application
- 9.1.1. Automotive Electronics
- 9.1.2. Consumer Electronics
- 9.1.3. Aerospace
- 9.1.4. Others
- 9.2. Market Analysis, Insights and Forecast - by Types
- 9.2.1. Single Channel
- 9.2.2. Double Channel
- 9.2.3. Multi Channel
- 9.1. Market Analysis, Insights and Forecast - by Application
- 10. Middle East & Africa High Speed Comparator Analysis, Insights and Forecast, 2020-2032
- 10.1. Market Analysis, Insights and Forecast - by Application
- 10.1.1. Automotive Electronics
- 10.1.2. Consumer Electronics
- 10.1.3. Aerospace
- 10.1.4. Others
- 10.2. Market Analysis, Insights and Forecast - by Types
- 10.2.1. Single Channel
- 10.2.2. Double Channel
- 10.2.3. Multi Channel
- 10.1. Market Analysis, Insights and Forecast - by Application
- 11. Asia Pacific High Speed Comparator Analysis, Insights and Forecast, 2020-2032
- 11.1. Market Analysis, Insights and Forecast - by Application
- 11.1.1. Automotive Electronics
- 11.1.2. Consumer Electronics
- 11.1.3. Aerospace
- 11.1.4. Others
- 11.2. Market Analysis, Insights and Forecast - by Types
- 11.2.1. Single Channel
- 11.2.2. Double Channel
- 11.2.3. Multi Channel
- 11.1. Market Analysis, Insights and Forecast - by Application
- 12. Competitive Analysis
- 12.1. Company Profiles
- 12.1.1 STMicroelectronics
- 12.1.1.1. Company Overview
- 12.1.1.2. Products
- 12.1.1.3. Company Financials
- 12.1.1.4. SWOT Analysis
- 12.1.2 Texas Instruments
- 12.1.2.1. Company Overview
- 12.1.2.2. Products
- 12.1.2.3. Company Financials
- 12.1.2.4. SWOT Analysis
- 12.1.3 Analog Devices
- 12.1.3.1. Company Overview
- 12.1.3.2. Products
- 12.1.3.3. Company Financials
- 12.1.3.4. SWOT Analysis
- 12.1.4 Power Device Corporation
- 12.1.4.1. Company Overview
- 12.1.4.2. Products
- 12.1.4.3. Company Financials
- 12.1.4.4. SWOT Analysis
- 12.1.5 Microchip Technology
- 12.1.5.1. Company Overview
- 12.1.5.2. Products
- 12.1.5.3. Company Financials
- 12.1.5.4. SWOT Analysis
- 12.1.6 Onsemi
- 12.1.6.1. Company Overview
- 12.1.6.2. Products
- 12.1.6.3. Company Financials
- 12.1.6.4. SWOT Analysis
- 12.1.7 ROHM
- 12.1.7.1. Company Overview
- 12.1.7.2. Products
- 12.1.7.3. Company Financials
- 12.1.7.4. SWOT Analysis
- 12.1.8 Fairchild Semiconductors
- 12.1.8.1. Company Overview
- 12.1.8.2. Products
- 12.1.8.3. Company Financials
- 12.1.8.4. SWOT Analysis
- 12.1.9 Philips SemiConductor
- 12.1.9.1. Company Overview
- 12.1.9.2. Products
- 12.1.9.3. Company Financials
- 12.1.9.4. SWOT Analysis
- 12.1.10 SG Micro Limited
- 12.1.10.1. Company Overview
- 12.1.10.2. Products
- 12.1.10.3. Company Financials
- 12.1.10.4. SWOT Analysis
- 12.1.11 National Semiconductor
- 12.1.11.1. Company Overview
- 12.1.11.2. Products
- 12.1.11.3. Company Financials
- 12.1.11.4. SWOT Analysis
- 12.1.12 Linear Technology
- 12.1.12.1. Company Overview
- 12.1.12.2. Products
- 12.1.12.3. Company Financials
- 12.1.12.4. SWOT Analysis
- 12.1.13 Trusignal Microelectronics
- 12.1.13.1. Company Overview
- 12.1.13.2. Products
- 12.1.13.3. Company Financials
- 12.1.13.4. SWOT Analysis
- 12.1.14 Jiangsu Runic Technology
- 12.1.14.1. Company Overview
- 12.1.14.2. Products
- 12.1.14.3. Company Financials
- 12.1.14.4. SWOT Analysis
- 12.1.1 STMicroelectronics
- 12.2. Market Entropy
- 12.2.1 Company's Key Areas Served
- 12.2.2 Recent Developments
- 12.3. Company Market Share Analysis 2025
- 12.3.1 Top 5 Companies Market Share Analysis
- 12.3.2 Top 3 Companies Market Share Analysis
- 12.4. List of Potential Customers
- 13. Research Methodology
List of Figures
- Figure 1: Global High Speed Comparator Revenue Breakdown (million, %) by Region 2025 & 2033
- Figure 2: Global High Speed Comparator Volume Breakdown (K, %) by Region 2025 & 2033
- Figure 3: North America High Speed Comparator Revenue (million), by Application 2025 & 2033
- Figure 4: North America High Speed Comparator Volume (K), by Application 2025 & 2033
- Figure 5: North America High Speed Comparator Revenue Share (%), by Application 2025 & 2033
- Figure 6: North America High Speed Comparator Volume Share (%), by Application 2025 & 2033
- Figure 7: North America High Speed Comparator Revenue (million), by Types 2025 & 2033
- Figure 8: North America High Speed Comparator Volume (K), by Types 2025 & 2033
- Figure 9: North America High Speed Comparator Revenue Share (%), by Types 2025 & 2033
- Figure 10: North America High Speed Comparator Volume Share (%), by Types 2025 & 2033
- Figure 11: North America High Speed Comparator Revenue (million), by Country 2025 & 2033
- Figure 12: North America High Speed Comparator Volume (K), by Country 2025 & 2033
- Figure 13: North America High Speed Comparator Revenue Share (%), by Country 2025 & 2033
- Figure 14: North America High Speed Comparator Volume Share (%), by Country 2025 & 2033
- Figure 15: South America High Speed Comparator Revenue (million), by Application 2025 & 2033
- Figure 16: South America High Speed Comparator Volume (K), by Application 2025 & 2033
- Figure 17: South America High Speed Comparator Revenue Share (%), by Application 2025 & 2033
- Figure 18: South America High Speed Comparator Volume Share (%), by Application 2025 & 2033
- Figure 19: South America High Speed Comparator Revenue (million), by Types 2025 & 2033
- Figure 20: South America High Speed Comparator Volume (K), by Types 2025 & 2033
- Figure 21: South America High Speed Comparator Revenue Share (%), by Types 2025 & 2033
- Figure 22: South America High Speed Comparator Volume Share (%), by Types 2025 & 2033
- Figure 23: South America High Speed Comparator Revenue (million), by Country 2025 & 2033
- Figure 24: South America High Speed Comparator Volume (K), by Country 2025 & 2033
- Figure 25: South America High Speed Comparator Revenue Share (%), by Country 2025 & 2033
- Figure 26: South America High Speed Comparator Volume Share (%), by Country 2025 & 2033
- Figure 27: Europe High Speed Comparator Revenue (million), by Application 2025 & 2033
- Figure 28: Europe High Speed Comparator Volume (K), by Application 2025 & 2033
- Figure 29: Europe High Speed Comparator Revenue Share (%), by Application 2025 & 2033
- Figure 30: Europe High Speed Comparator Volume Share (%), by Application 2025 & 2033
- Figure 31: Europe High Speed Comparator Revenue (million), by Types 2025 & 2033
- Figure 32: Europe High Speed Comparator Volume (K), by Types 2025 & 2033
- Figure 33: Europe High Speed Comparator Revenue Share (%), by Types 2025 & 2033
- Figure 34: Europe High Speed Comparator Volume Share (%), by Types 2025 & 2033
- Figure 35: Europe High Speed Comparator Revenue (million), by Country 2025 & 2033
- Figure 36: Europe High Speed Comparator Volume (K), by Country 2025 & 2033
- Figure 37: Europe High Speed Comparator Revenue Share (%), by Country 2025 & 2033
- Figure 38: Europe High Speed Comparator Volume Share (%), by Country 2025 & 2033
- Figure 39: Middle East & Africa High Speed Comparator Revenue (million), by Application 2025 & 2033
- Figure 40: Middle East & Africa High Speed Comparator Volume (K), by Application 2025 & 2033
- Figure 41: Middle East & Africa High Speed Comparator Revenue Share (%), by Application 2025 & 2033
- Figure 42: Middle East & Africa High Speed Comparator Volume Share (%), by Application 2025 & 2033
- Figure 43: Middle East & Africa High Speed Comparator Revenue (million), by Types 2025 & 2033
- Figure 44: Middle East & Africa High Speed Comparator Volume (K), by Types 2025 & 2033
- Figure 45: Middle East & Africa High Speed Comparator Revenue Share (%), by Types 2025 & 2033
- Figure 46: Middle East & Africa High Speed Comparator Volume Share (%), by Types 2025 & 2033
- Figure 47: Middle East & Africa High Speed Comparator Revenue (million), by Country 2025 & 2033
- Figure 48: Middle East & Africa High Speed Comparator Volume (K), by Country 2025 & 2033
- Figure 49: Middle East & Africa High Speed Comparator Revenue Share (%), by Country 2025 & 2033
- Figure 50: Middle East & Africa High Speed Comparator Volume Share (%), by Country 2025 & 2033
- Figure 51: Asia Pacific High Speed Comparator Revenue (million), by Application 2025 & 2033
- Figure 52: Asia Pacific High Speed Comparator Volume (K), by Application 2025 & 2033
- Figure 53: Asia Pacific High Speed Comparator Revenue Share (%), by Application 2025 & 2033
- Figure 54: Asia Pacific High Speed Comparator Volume Share (%), by Application 2025 & 2033
- Figure 55: Asia Pacific High Speed Comparator Revenue (million), by Types 2025 & 2033
- Figure 56: Asia Pacific High Speed Comparator Volume (K), by Types 2025 & 2033
- Figure 57: Asia Pacific High Speed Comparator Revenue Share (%), by Types 2025 & 2033
- Figure 58: Asia Pacific High Speed Comparator Volume Share (%), by Types 2025 & 2033
- Figure 59: Asia Pacific High Speed Comparator Revenue (million), by Country 2025 & 2033
- Figure 60: Asia Pacific High Speed Comparator Volume (K), by Country 2025 & 2033
- Figure 61: Asia Pacific High Speed Comparator Revenue Share (%), by Country 2025 & 2033
- Figure 62: Asia Pacific High Speed Comparator Volume Share (%), by Country 2025 & 2033
List of Tables
- Table 1: Global High Speed Comparator Revenue million Forecast, by Application 2020 & 2033
- Table 2: Global High Speed Comparator Volume K Forecast, by Application 2020 & 2033
- Table 3: Global High Speed Comparator Revenue million Forecast, by Types 2020 & 2033
- Table 4: Global High Speed Comparator Volume K Forecast, by Types 2020 & 2033
- Table 5: Global High Speed Comparator Revenue million Forecast, by Region 2020 & 2033
- Table 6: Global High Speed Comparator Volume K Forecast, by Region 2020 & 2033
- Table 7: Global High Speed Comparator Revenue million Forecast, by Application 2020 & 2033
- Table 8: Global High Speed Comparator Volume K Forecast, by Application 2020 & 2033
- Table 9: Global High Speed Comparator Revenue million Forecast, by Types 2020 & 2033
- Table 10: Global High Speed Comparator Volume K Forecast, by Types 2020 & 2033
- Table 11: Global High Speed Comparator Revenue million Forecast, by Country 2020 & 2033
- Table 12: Global High Speed Comparator Volume K Forecast, by Country 2020 & 2033
- Table 13: United States High Speed Comparator Revenue (million) Forecast, by Application 2020 & 2033
- Table 14: United States High Speed Comparator Volume (K) Forecast, by Application 2020 & 2033
- Table 15: Canada High Speed Comparator Revenue (million) Forecast, by Application 2020 & 2033
- Table 16: Canada High Speed Comparator Volume (K) Forecast, by Application 2020 & 2033
- Table 17: Mexico High Speed Comparator Revenue (million) Forecast, by Application 2020 & 2033
- Table 18: Mexico High Speed Comparator Volume (K) Forecast, by Application 2020 & 2033
- Table 19: Global High Speed Comparator Revenue million Forecast, by Application 2020 & 2033
- Table 20: Global High Speed Comparator Volume K Forecast, by Application 2020 & 2033
- Table 21: Global High Speed Comparator Revenue million Forecast, by Types 2020 & 2033
- Table 22: Global High Speed Comparator Volume K Forecast, by Types 2020 & 2033
- Table 23: Global High Speed Comparator Revenue million Forecast, by Country 2020 & 2033
- Table 24: Global High Speed Comparator Volume K Forecast, by Country 2020 & 2033
- Table 25: Brazil High Speed Comparator Revenue (million) Forecast, by Application 2020 & 2033
- Table 26: Brazil High Speed Comparator Volume (K) Forecast, by Application 2020 & 2033
- Table 27: Argentina High Speed Comparator Revenue (million) Forecast, by Application 2020 & 2033
- Table 28: Argentina High Speed Comparator Volume (K) Forecast, by Application 2020 & 2033
- Table 29: Rest of South America High Speed Comparator Revenue (million) Forecast, by Application 2020 & 2033
- Table 30: Rest of South America High Speed Comparator Volume (K) Forecast, by Application 2020 & 2033
- Table 31: Global High Speed Comparator Revenue million Forecast, by Application 2020 & 2033
- Table 32: Global High Speed Comparator Volume K Forecast, by Application 2020 & 2033
- Table 33: Global High Speed Comparator Revenue million Forecast, by Types 2020 & 2033
- Table 34: Global High Speed Comparator Volume K Forecast, by Types 2020 & 2033
- Table 35: Global High Speed Comparator Revenue million Forecast, by Country 2020 & 2033
- Table 36: Global High Speed Comparator Volume K Forecast, by Country 2020 & 2033
- Table 37: United Kingdom High Speed Comparator Revenue (million) Forecast, by Application 2020 & 2033
- Table 38: United Kingdom High Speed Comparator Volume (K) Forecast, by Application 2020 & 2033
- Table 39: Germany High Speed Comparator Revenue (million) Forecast, by Application 2020 & 2033
- Table 40: Germany High Speed Comparator Volume (K) Forecast, by Application 2020 & 2033
- Table 41: France High Speed Comparator Revenue (million) Forecast, by Application 2020 & 2033
- Table 42: France High Speed Comparator Volume (K) Forecast, by Application 2020 & 2033
- Table 43: Italy High Speed Comparator Revenue (million) Forecast, by Application 2020 & 2033
- Table 44: Italy High Speed Comparator Volume (K) Forecast, by Application 2020 & 2033
- Table 45: Spain High Speed Comparator Revenue (million) Forecast, by Application 2020 & 2033
- Table 46: Spain High Speed Comparator Volume (K) Forecast, by Application 2020 & 2033
- Table 47: Russia High Speed Comparator Revenue (million) Forecast, by Application 2020 & 2033
- Table 48: Russia High Speed Comparator Volume (K) Forecast, by Application 2020 & 2033
- Table 49: Benelux High Speed Comparator Revenue (million) Forecast, by Application 2020 & 2033
- Table 50: Benelux High Speed Comparator Volume (K) Forecast, by Application 2020 & 2033
- Table 51: Nordics High Speed Comparator Revenue (million) Forecast, by Application 2020 & 2033
- Table 52: Nordics High Speed Comparator Volume (K) Forecast, by Application 2020 & 2033
- Table 53: Rest of Europe High Speed Comparator Revenue (million) Forecast, by Application 2020 & 2033
- Table 54: Rest of Europe High Speed Comparator Volume (K) Forecast, by Application 2020 & 2033
- Table 55: Global High Speed Comparator Revenue million Forecast, by Application 2020 & 2033
- Table 56: Global High Speed Comparator Volume K Forecast, by Application 2020 & 2033
- Table 57: Global High Speed Comparator Revenue million Forecast, by Types 2020 & 2033
- Table 58: Global High Speed Comparator Volume K Forecast, by Types 2020 & 2033
- Table 59: Global High Speed Comparator Revenue million Forecast, by Country 2020 & 2033
- Table 60: Global High Speed Comparator Volume K Forecast, by Country 2020 & 2033
- Table 61: Turkey High Speed Comparator Revenue (million) Forecast, by Application 2020 & 2033
- Table 62: Turkey High Speed Comparator Volume (K) Forecast, by Application 2020 & 2033
- Table 63: Israel High Speed Comparator Revenue (million) Forecast, by Application 2020 & 2033
- Table 64: Israel High Speed Comparator Volume (K) Forecast, by Application 2020 & 2033
- Table 65: GCC High Speed Comparator Revenue (million) Forecast, by Application 2020 & 2033
- Table 66: GCC High Speed Comparator Volume (K) Forecast, by Application 2020 & 2033
- Table 67: North Africa High Speed Comparator Revenue (million) Forecast, by Application 2020 & 2033
- Table 68: North Africa High Speed Comparator Volume (K) Forecast, by Application 2020 & 2033
- Table 69: South Africa High Speed Comparator Revenue (million) Forecast, by Application 2020 & 2033
- Table 70: South Africa High Speed Comparator Volume (K) Forecast, by Application 2020 & 2033
- Table 71: Rest of Middle East & Africa High Speed Comparator Revenue (million) Forecast, by Application 2020 & 2033
- Table 72: Rest of Middle East & Africa High Speed Comparator Volume (K) Forecast, by Application 2020 & 2033
- Table 73: Global High Speed Comparator Revenue million Forecast, by Application 2020 & 2033
- Table 74: Global High Speed Comparator Volume K Forecast, by Application 2020 & 2033
- Table 75: Global High Speed Comparator Revenue million Forecast, by Types 2020 & 2033
- Table 76: Global High Speed Comparator Volume K Forecast, by Types 2020 & 2033
- Table 77: Global High Speed Comparator Revenue million Forecast, by Country 2020 & 2033
- Table 78: Global High Speed Comparator Volume K Forecast, by Country 2020 & 2033
- Table 79: China High Speed Comparator Revenue (million) Forecast, by Application 2020 & 2033
- Table 80: China High Speed Comparator Volume (K) Forecast, by Application 2020 & 2033
- Table 81: India High Speed Comparator Revenue (million) Forecast, by Application 2020 & 2033
- Table 82: India High Speed Comparator Volume (K) Forecast, by Application 2020 & 2033
- Table 83: Japan High Speed Comparator Revenue (million) Forecast, by Application 2020 & 2033
- Table 84: Japan High Speed Comparator Volume (K) Forecast, by Application 2020 & 2033
- Table 85: South Korea High Speed Comparator Revenue (million) Forecast, by Application 2020 & 2033
- Table 86: South Korea High Speed Comparator Volume (K) Forecast, by Application 2020 & 2033
- Table 87: ASEAN High Speed Comparator Revenue (million) Forecast, by Application 2020 & 2033
- Table 88: ASEAN High Speed Comparator Volume (K) Forecast, by Application 2020 & 2033
- Table 89: Oceania High Speed Comparator Revenue (million) Forecast, by Application 2020 & 2033
- Table 90: Oceania High Speed Comparator Volume (K) Forecast, by Application 2020 & 2033
- Table 91: Rest of Asia Pacific High Speed Comparator Revenue (million) Forecast, by Application 2020 & 2033
- Table 92: Rest of Asia Pacific High Speed Comparator Volume (K) Forecast, by Application 2020 & 2033
Frequently Asked Questions
1. What is the projected Compound Annual Growth Rate (CAGR) of the High Speed Comparator?
The projected CAGR is approximately 4.9%.
2. Which companies are prominent players in the High Speed Comparator?
Key companies in the market include STMicroelectronics, Texas Instruments, Analog Devices, Power Device Corporation, Microchip Technology, Onsemi, ROHM, Fairchild Semiconductors, Philips SemiConductor, SG Micro Limited, National Semiconductor, Linear Technology, Trusignal Microelectronics, Jiangsu Runic Technology.
3. What are the main segments of the High Speed Comparator?
The market segments include Application, Types.
4. Can you provide details about the market size?
The market size is estimated to be USD 672 million as of 2022.
5. What are some drivers contributing to market growth?
N/A
6. What are the notable trends driving market growth?
N/A
7. Are there any restraints impacting market growth?
N/A
8. Can you provide examples of recent developments in the market?
N/A
9. What pricing options are available for accessing the report?
Pricing options include single-user, multi-user, and enterprise licenses priced at USD 3950.00, USD 5925.00, and USD 7900.00 respectively.
10. Is the market size provided in terms of value or volume?
The market size is provided in terms of value, measured in million and volume, measured in K.
11. Are there any specific market keywords associated with the report?
Yes, the market keyword associated with the report is "High Speed Comparator," which aids in identifying and referencing the specific market segment covered.
12. How do I determine which pricing option suits my needs best?
The pricing options vary based on user requirements and access needs. Individual users may opt for single-user licenses, while businesses requiring broader access may choose multi-user or enterprise licenses for cost-effective access to the report.
13. Are there any additional resources or data provided in the High Speed Comparator report?
While the report offers comprehensive insights, it's advisable to review the specific contents or supplementary materials provided to ascertain if additional resources or data are available.
14. How can I stay updated on further developments or reports in the High Speed Comparator?
To stay informed about further developments, trends, and reports in the High Speed Comparator, consider subscribing to industry newsletters, following relevant companies and organizations, or regularly checking reputable industry news sources and publications.
Methodology
Step 1 - Identification of Relevant Samples Size from Population Database


Step 2 - Approaches for Defining Global Market Size (Value, Volume* & Price*)

Note*: In applicable scenarios
Step 3 - Data Sources
Primary Research
- Web Analytics
- Survey Reports
- Research Institute
- Latest Research Reports
- Opinion Leaders
Secondary Research
- Annual Reports
- White Paper
- Latest Press Release
- Industry Association
- Paid Database
- Investor Presentations

Step 4 - Data Triangulation
Involves using different sources of information in order to increase the validity of a study
These sources are likely to be stakeholders in a program - participants, other researchers, program staff, other community members, and so on.
Then we put all data in single framework & apply various statistical tools to find out the dynamic on the market.
During the analysis stage, feedback from the stakeholder groups would be compared to determine areas of agreement as well as areas of divergence