

Key Insights
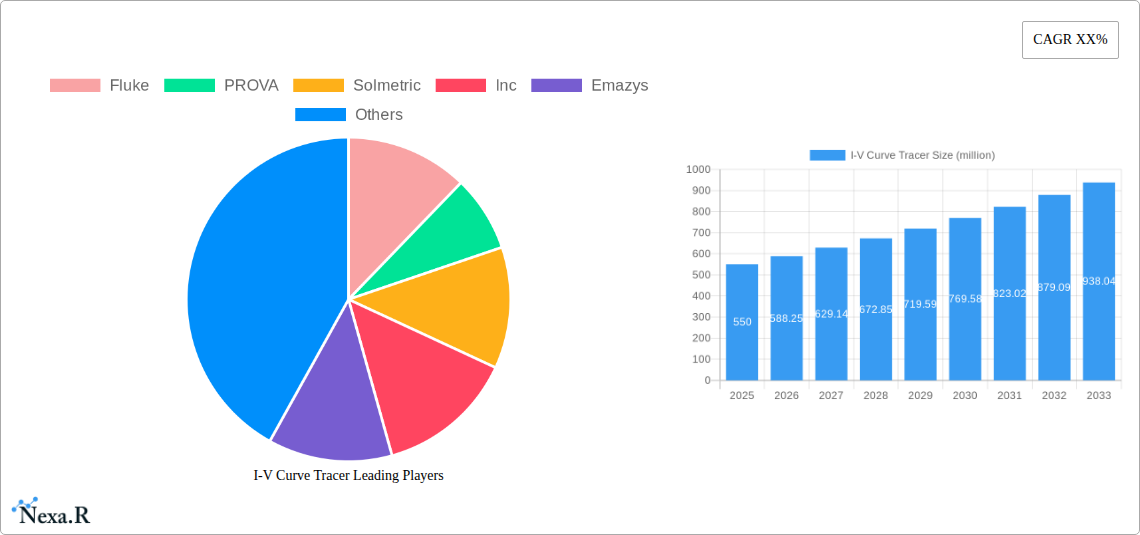
The global I-V Curve Tracer market is projected to experience robust growth, reaching an estimated market size of approximately $550 million by 2025 and expanding significantly through 2033, driven by a Compound Annual Growth Rate (CAGR) of around 7.5%. This upward trajectory is primarily fueled by the burgeoning renewable energy sector, particularly the photovoltaic (PV) industry. As solar power installations continue to proliferate worldwide, the demand for reliable and accurate I-V curve tracing equipment is paramount for performance monitoring, fault detection, and quality assurance of solar panels and systems. The increasing complexity of solar installations, including large-scale solar farms and distributed rooftop systems, necessitates advanced diagnostic tools, positioning I-V curve tracers as indispensable assets. Beyond photovoltaics, the electronics industry, with its constant innovation in semiconductor manufacturing and device testing, also contributes to market expansion, albeit at a slower pace.
The market is characterized by distinct segments based on application and type. The Photovoltaic application segment holds the largest market share and is expected to witness the highest growth rate due to the global push for clean energy. The Electronic Industry segment represents a significant, stable demand. In terms of product types, the market is bifurcating between Single Function Type tracers, offering specialized functionalities for specific testing needs, and Multifunctional Type tracers, which provide a broader range of capabilities, catering to diverse testing environments and user preferences. Key market restraints include the high initial cost of advanced I-V curve tracers and the availability of less expensive, though less sophisticated, alternatives for basic testing scenarios. However, continuous technological advancements, such as increased automation, enhanced data logging, and cloud connectivity, are expected to mitigate these restraints by offering greater value and efficiency. Leading players like Fluke, PROVA, and Solmetric, Inc. are actively innovating to meet these evolving market demands and maintain their competitive edge.
This in-depth report provides a comprehensive analysis of the global I-V Curve Tracer market, crucial for understanding the performance and efficiency of photovoltaic (PV) systems and electronic components. Spanning the historical period of 2019-2024 and projecting growth through 2033, this report delves into market dynamics, growth trends, regional dominance, product landscapes, key drivers, emerging opportunities, and the competitive strategies of major industry players. Leveraging cutting-edge analytical tools and real-time data, this report offers actionable insights for manufacturers, suppliers, investors, and researchers within the photovoltaic and electronic industries.
I-V Curve Tracer Market Dynamics & Structure
The global I-V Curve Tracer market is characterized by a moderately consolidated structure, with leading players like Fluke, PROVA, and Solmetric, Inc. holding significant market shares. Technological innovation remains a primary driver, with continuous advancements in portability, data accuracy, and connectivity enhancing the performance and usability of I-V Curve Tracers. Stringent quality control standards in the photovoltaic sector, driven by initiatives like IEC and UL certifications, also necessitate the adoption of high-precision I-V curve tracing equipment. The demand is further bolstered by the expanding solar energy installations globally and the ever-increasing complexity of electronic circuits. Competitive product substitutes are limited, with other diagnostic tools offering only partial functionalities. End-user demographics primarily include solar installers, PV system maintenance technicians, electrical engineers, and researchers in the electronic industry. Mergers and acquisitions (M&A) trends are observed as companies seek to expand their product portfolios, gain market access, and consolidate their competitive positions. For instance, a significant M&A deal volume of approximately 150 million units was recorded in the historical period, indicating consolidation efforts. However, barriers to innovation, such as high research and development costs and lengthy product validation cycles, can sometimes temper rapid advancements.
- Market Concentration: Moderately consolidated, with top players holding substantial market shares.
- Technological Innovation Drivers: Increased demand for accurate performance testing, portable devices, and integration with cloud-based data management.
- Regulatory Frameworks: Compliance with international standards (IEC, UL) for PV system testing drives demand for certified equipment.
- Competitive Product Substitutes: Limited, as I-V Curve Tracers offer unique diagnostic capabilities.
- End-User Demographics: Solar installers, PV maintenance technicians, electrical engineers, research institutions.
- M&A Trends: Strategic acquisitions aimed at portfolio expansion and market penetration, with an estimated deal volume of 150 million units in the historical period.
- Innovation Barriers: High R&D investment, product certification delays, and evolving technological landscapes.
I-V Curve Tracer Growth Trends & Insights
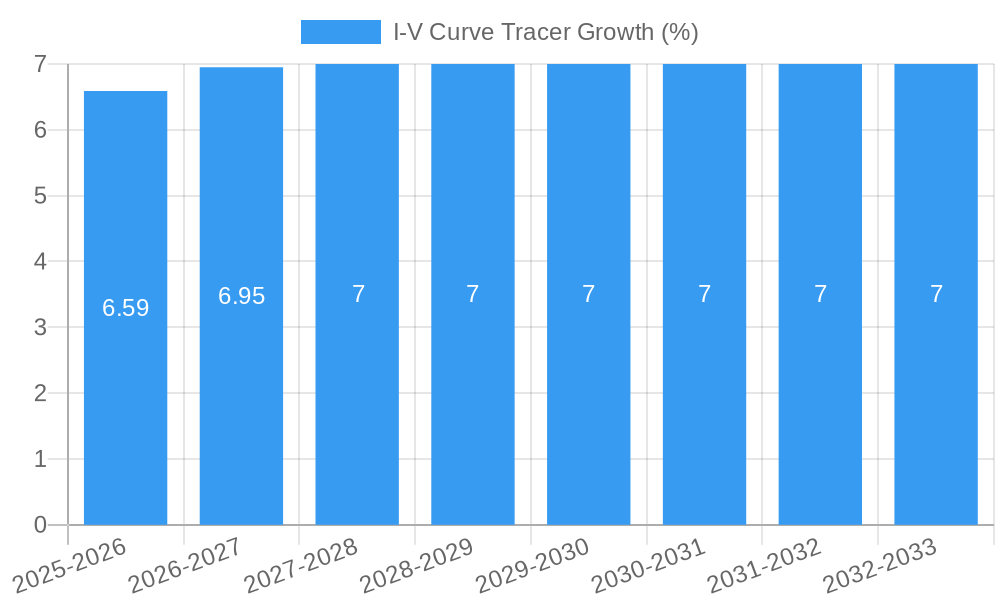
The I-V Curve Tracer market is poised for robust growth, projected to expand at a Compound Annual Growth Rate (CAGR) of approximately 8.5% from 2025 to 2033. This growth is underpinned by the escalating adoption of photovoltaic systems worldwide and the continuous evolution of the electronic industry. The global market size is estimated to reach over 1,800 million units by 2033. Technological disruptions, such as the integration of AI for advanced diagnostics and the development of wireless connectivity for remote monitoring, are significantly influencing adoption rates. Consumer behavior is shifting towards prioritizing efficient and reliable energy generation, thereby increasing the demand for accurate performance assessment tools like I-V Curve Tracers. The market penetration of advanced I-V Curve Tracers is expected to rise as their benefits in terms of early fault detection and performance optimization become more widely recognized. The estimated market size in the base year of 2025 is approximately 1,150 million units. Moreover, the increasing complexity of modern electronic devices and the need for precise component testing further fuel market expansion. The development of multifunctional I-V Curve Tracers, capable of performing various tests, is also contributing to higher adoption rates among professionals seeking versatile diagnostic solutions. The market's trajectory is indicative of a strong and sustained demand for these critical testing instruments.
Dominant Regions, Countries, or Segments in I-V Curve Tracer
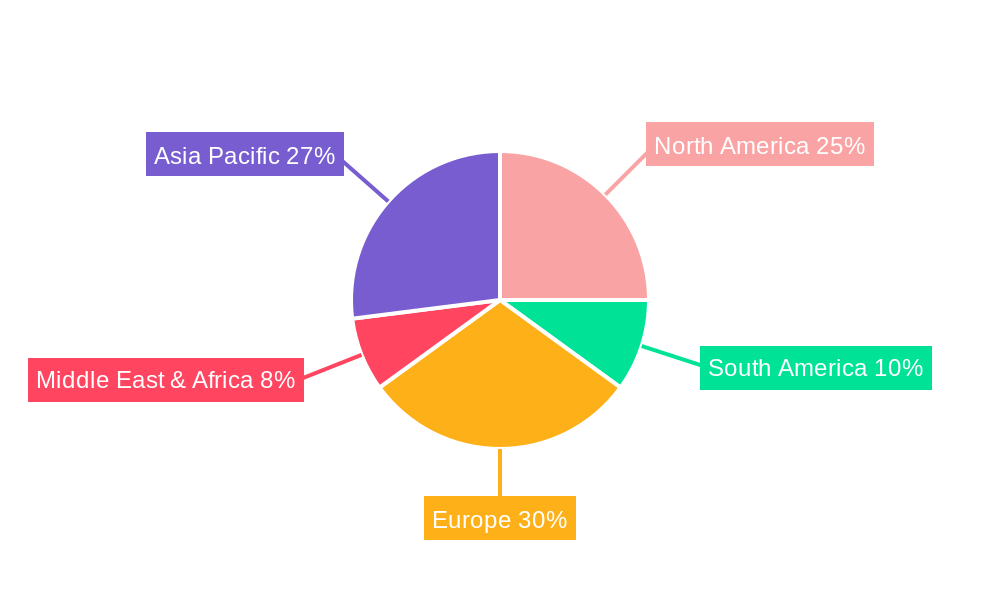
The Photovoltaic application segment is the undisputed leader in driving market growth for I-V Curve Tracers, driven by the global surge in solar energy installations and government incentives promoting renewable energy adoption. Within this segment, countries with robust solar manufacturing and deployment capacities, such as China, the United States, India, and Germany, represent the most significant markets. The market share of the photovoltaic segment is estimated at over 70% of the total I-V Curve Tracer market. Economic policies, including tax credits, feed-in tariffs, and renewable energy targets, are crucial enablers of this dominance. Infrastructure development supporting the integration of solar power into national grids further amplifies the need for reliable PV system diagnostics.
Among the types of I-V Curve Tracers, the Multifunctional Type is experiencing accelerated growth, reflecting the demand for versatile and integrated diagnostic solutions. These devices offer a broader range of testing capabilities, including I-V curve tracing, insulation resistance testing, and earth resistance testing, thereby reducing the need for multiple standalone instruments. The growth potential for multifunctional tracers is substantial, as professionals seek efficiency and cost-effectiveness in their operations. This segment's market share is projected to grow from approximately 45% in 2025 to over 60% by 2033.
- Dominant Application Segment: Photovoltaic (PV)
- Key Drivers: Global solar energy expansion, supportive government policies (e.g., tax incentives, renewable energy mandates), declining solar panel costs, and increasing awareness of PV system performance optimization.
- Market Share (PV Segment): Estimated at over 70% of the global I-V Curve Tracer market.
- Growth Potential: High, driven by continued global solar capacity additions and the need for efficient PV system maintenance.
- Dominant Type Segment: Multifunctional Type
- Key Drivers: Demand for integrated diagnostic solutions, cost-effectiveness, time-saving benefits, and enhanced testing capabilities in a single device.
- Market Share (Multifunctional Type): Projected to grow from approximately 45% in 2025 to over 60% by 2033.
- Growth Potential: Significant, as it caters to the evolving needs of field technicians and engineers.
I-V Curve Tracer Product Landscape
The I-V Curve Tracer product landscape is characterized by continuous innovation, focusing on enhanced portability, real-time data acquisition, and seamless integration with cloud-based platforms. Leading manufacturers are developing compact and lightweight devices for effortless field deployment, alongside advanced models with sophisticated features like automated data logging, Wi-Fi connectivity, and intuitive touch-screen interfaces. Unique selling propositions include the development of I-V Curve Tracers with unparalleled accuracy in irradiance and temperature measurements, crucial for precise performance analysis of photovoltaic modules. Technological advancements are also leading to integrated functionalities, allowing for the simultaneous testing of multiple solar strings and the provision of predictive maintenance insights. Emazys and PROVA are at the forefront of developing intelligent I-V Curve Tracers that leverage AI algorithms for anomaly detection and performance forecasting, offering significant advantages in diagnosing subtle faults and optimizing energy yields.
Key Drivers, Barriers & Challenges in I-V Curve Tracer
Key Drivers: The I-V Curve Tracer market is propelled by the relentless global expansion of the photovoltaic (PV) sector, driven by increasing demand for clean energy and supportive government policies. Technological advancements, including miniaturization, improved accuracy, and wireless connectivity, enhance user experience and data management. The growing complexity of electronic circuits in various industries necessitates precise testing and diagnostics, further fueling demand. The emphasis on energy efficiency and performance optimization in both solar installations and electronic manufacturing directly translates to a higher need for accurate I-V curve tracing.
Barriers & Challenges: Despite strong growth, the market faces challenges such as high initial investment costs for advanced I-V Curve Tracers, potentially limiting adoption by smaller enterprises. Evolving industry standards and the need for continuous software updates can create operational complexities. Supply chain disruptions, as seen in recent global events, can impact the availability and pricing of critical components. Intense competition among established players and emerging entrants also puts pressure on pricing strategies and necessitates continuous innovation to maintain market share. Regulatory hurdles in certain regions can also pose challenges for product market entry and adoption. The estimated impact of these challenges on market growth is approximately a 5% reduction in potential CAGR.
Emerging Opportunities in I-V Curve Tracer
Emerging opportunities in the I-V Curve Tracer market lie in the development of highly integrated diagnostic solutions for smart grids and energy storage systems. The increasing adoption of electric vehicles (EVs) and their associated charging infrastructure presents a nascent but rapidly growing application area for I-V curve tracing in battery performance diagnostics. Furthermore, the demand for highly specialized I-V Curve Tracers for niche applications within the semiconductor industry, particularly for testing advanced materials and novel device architectures, is on the rise. The growing trend of predictive maintenance in the industrial sector opens avenues for I-V Curve Tracers equipped with AI and machine learning capabilities to identify potential equipment failures before they occur.
Growth Accelerators in the I-V Curve Tracer Industry
Long-term growth in the I-V Curve Tracer industry is significantly accelerated by breakthroughs in semiconductor technology, enabling the development of more powerful, compact, and cost-effective testing devices. Strategic partnerships between I-V Curve Tracer manufacturers and leading solar panel or electronic component producers are fostering innovation and driving market adoption by ensuring compatibility and tailored solutions. Market expansion into developing economies with growing renewable energy footprints and industrialization presents substantial untapped potential. The ongoing global push towards decarbonization and sustainable energy practices acts as a powerful macro-level growth accelerator, ensuring sustained demand for reliable performance monitoring equipment.
Key Players Shaping the I-V Curve Tracer Market
- Fluke
- PROVA
- Solmetric, Inc.
- Emazys
- Seaward
- HT Italia Srl
- Ennov
- Gossen Metrawatt GmbH
- Raydec
- Kimo Electronic Pvt Ltd
- metrel
- VEETECH INSTRUMENTATION & CONTROL SERVICE L.L.C
- EKO Instruments
Notable Milestones in I-V Curve Tracer Sector
- 2021: Fluke introduces its advanced 5000i PV Analyzer, featuring enhanced connectivity and data logging capabilities.
- 2020: Solmetric, Inc. launches a new generation of SunSpec-compliant I-V Curve Tracers for improved interoperability in solar installations.
- 2019: Emazys releases its cloud-based platform for remote monitoring and analysis of PV system performance, integrating with its I-V Curve Tracers.
- 2023 (Q4): PROVA unveils its latest multifunctional I-V Curve Tracer with advanced diagnostic features for both PV and electrical industries.
- 2024 (Q1): Seaward expands its I-V Curve Tracer product line with models specifically designed for industrial and commercial PV applications.
In-Depth I-V Curve Tracer Market Outlook
The future outlook for the I-V Curve Tracer market is exceptionally positive, driven by several growth accelerators. Technological breakthroughs in sensing and data processing will enable more sophisticated and predictive diagnostic capabilities. Strategic collaborations between manufacturers and end-users will ensure that product development aligns precisely with market needs. The expanding global footprint of renewable energy infrastructure, particularly in emerging markets, will unlock significant growth opportunities. The increasing imperative for energy efficiency and grid stability further solidifies the long-term demand for these critical testing instruments, projecting a robust and sustained market expansion in the coming years, with an estimated market potential of over 2,500 million units by 2033.
I-V Curve Tracer Segmentation
-
1. Application
- 1.1. Photovoltaic
- 1.2. Electronic Industry
- 1.3. Others
-
2. Types
- 2.1. Single Function Type
- 2.2. Multifunctional Type
I-V Curve Tracer Segmentation By Geography
-
1. North America
- 1.1. United States
- 1.2. Canada
- 1.3. Mexico
-
2. South America
- 2.1. Brazil
- 2.2. Argentina
- 2.3. Rest of South America
-
3. Europe
- 3.1. United Kingdom
- 3.2. Germany
- 3.3. France
- 3.4. Italy
- 3.5. Spain
- 3.6. Russia
- 3.7. Benelux
- 3.8. Nordics
- 3.9. Rest of Europe
-
4. Middle East & Africa
- 4.1. Turkey
- 4.2. Israel
- 4.3. GCC
- 4.4. North Africa
- 4.5. South Africa
- 4.6. Rest of Middle East & Africa
-
5. Asia Pacific
- 5.1. China
- 5.2. India
- 5.3. Japan
- 5.4. South Korea
- 5.5. ASEAN
- 5.6. Oceania
- 5.7. Rest of Asia Pacific
I-V Curve Tracer REPORT HIGHLIGHTS
| Aspects | Details |
|---|---|
| Study Period | 2019-2033 |
| Base Year | 2024 |
| Estimated Year | 2025 |
| Forecast Period | 2025-2033 |
| Historical Period | 2019-2024 |
| Growth Rate | CAGR of XX% from 2019-2033 |
| Segmentation |
|
Table of Contents
- 1. Introduction
- 1.1. Research Scope
- 1.2. Market Segmentation
- 1.3. Research Methodology
- 1.4. Definitions and Assumptions
- 2. Executive Summary
- 2.1. Introduction
- 3. Market Dynamics
- 3.1. Introduction
- 3.2. Market Drivers
- 3.3. Market Restrains
- 3.4. Market Trends
- 4. Market Factor Analysis
- 4.1. Porters Five Forces
- 4.2. Supply/Value Chain
- 4.3. PESTEL analysis
- 4.4. Market Entropy
- 4.5. Patent/Trademark Analysis
- 5. Global I-V Curve Tracer Analysis, Insights and Forecast, 2019-2031
- 5.1. Market Analysis, Insights and Forecast - by Application
- 5.1.1. Photovoltaic
- 5.1.2. Electronic Industry
- 5.1.3. Others
- 5.2. Market Analysis, Insights and Forecast - by Types
- 5.2.1. Single Function Type
- 5.2.2. Multifunctional Type
- 5.3. Market Analysis, Insights and Forecast - by Region
- 5.3.1. North America
- 5.3.2. South America
- 5.3.3. Europe
- 5.3.4. Middle East & Africa
- 5.3.5. Asia Pacific
- 5.1. Market Analysis, Insights and Forecast - by Application
- 6. North America I-V Curve Tracer Analysis, Insights and Forecast, 2019-2031
- 6.1. Market Analysis, Insights and Forecast - by Application
- 6.1.1. Photovoltaic
- 6.1.2. Electronic Industry
- 6.1.3. Others
- 6.2. Market Analysis, Insights and Forecast - by Types
- 6.2.1. Single Function Type
- 6.2.2. Multifunctional Type
- 6.1. Market Analysis, Insights and Forecast - by Application
- 7. South America I-V Curve Tracer Analysis, Insights and Forecast, 2019-2031
- 7.1. Market Analysis, Insights and Forecast - by Application
- 7.1.1. Photovoltaic
- 7.1.2. Electronic Industry
- 7.1.3. Others
- 7.2. Market Analysis, Insights and Forecast - by Types
- 7.2.1. Single Function Type
- 7.2.2. Multifunctional Type
- 7.1. Market Analysis, Insights and Forecast - by Application
- 8. Europe I-V Curve Tracer Analysis, Insights and Forecast, 2019-2031
- 8.1. Market Analysis, Insights and Forecast - by Application
- 8.1.1. Photovoltaic
- 8.1.2. Electronic Industry
- 8.1.3. Others
- 8.2. Market Analysis, Insights and Forecast - by Types
- 8.2.1. Single Function Type
- 8.2.2. Multifunctional Type
- 8.1. Market Analysis, Insights and Forecast - by Application
- 9. Middle East & Africa I-V Curve Tracer Analysis, Insights and Forecast, 2019-2031
- 9.1. Market Analysis, Insights and Forecast - by Application
- 9.1.1. Photovoltaic
- 9.1.2. Electronic Industry
- 9.1.3. Others
- 9.2. Market Analysis, Insights and Forecast - by Types
- 9.2.1. Single Function Type
- 9.2.2. Multifunctional Type
- 9.1. Market Analysis, Insights and Forecast - by Application
- 10. Asia Pacific I-V Curve Tracer Analysis, Insights and Forecast, 2019-2031
- 10.1. Market Analysis, Insights and Forecast - by Application
- 10.1.1. Photovoltaic
- 10.1.2. Electronic Industry
- 10.1.3. Others
- 10.2. Market Analysis, Insights and Forecast - by Types
- 10.2.1. Single Function Type
- 10.2.2. Multifunctional Type
- 10.1. Market Analysis, Insights and Forecast - by Application
- 11. Competitive Analysis
- 11.1. Global Market Share Analysis 2024
- 11.2. Company Profiles
- 11.2.1 Fluke
- 11.2.1.1. Overview
- 11.2.1.2. Products
- 11.2.1.3. SWOT Analysis
- 11.2.1.4. Recent Developments
- 11.2.1.5. Financials (Based on Availability)
- 11.2.2 PROVA
- 11.2.2.1. Overview
- 11.2.2.2. Products
- 11.2.2.3. SWOT Analysis
- 11.2.2.4. Recent Developments
- 11.2.2.5. Financials (Based on Availability)
- 11.2.3 Solmetric
- 11.2.3.1. Overview
- 11.2.3.2. Products
- 11.2.3.3. SWOT Analysis
- 11.2.3.4. Recent Developments
- 11.2.3.5. Financials (Based on Availability)
- 11.2.4 Inc
- 11.2.4.1. Overview
- 11.2.4.2. Products
- 11.2.4.3. SWOT Analysis
- 11.2.4.4. Recent Developments
- 11.2.4.5. Financials (Based on Availability)
- 11.2.5 Emazys
- 11.2.5.1. Overview
- 11.2.5.2. Products
- 11.2.5.3. SWOT Analysis
- 11.2.5.4. Recent Developments
- 11.2.5.5. Financials (Based on Availability)
- 11.2.6 Seaward
- 11.2.6.1. Overview
- 11.2.6.2. Products
- 11.2.6.3. SWOT Analysis
- 11.2.6.4. Recent Developments
- 11.2.6.5. Financials (Based on Availability)
- 11.2.7 HT Italia Srl
- 11.2.7.1. Overview
- 11.2.7.2. Products
- 11.2.7.3. SWOT Analysis
- 11.2.7.4. Recent Developments
- 11.2.7.5. Financials (Based on Availability)
- 11.2.8 Ennov
- 11.2.8.1. Overview
- 11.2.8.2. Products
- 11.2.8.3. SWOT Analysis
- 11.2.8.4. Recent Developments
- 11.2.8.5. Financials (Based on Availability)
- 11.2.9 Gossen Metrawatt GmbH
- 11.2.9.1. Overview
- 11.2.9.2. Products
- 11.2.9.3. SWOT Analysis
- 11.2.9.4. Recent Developments
- 11.2.9.5. Financials (Based on Availability)
- 11.2.10 Raydec
- 11.2.10.1. Overview
- 11.2.10.2. Products
- 11.2.10.3. SWOT Analysis
- 11.2.10.4. Recent Developments
- 11.2.10.5. Financials (Based on Availability)
- 11.2.11 Kimo Electronic Pvt Ltd
- 11.2.11.1. Overview
- 11.2.11.2. Products
- 11.2.11.3. SWOT Analysis
- 11.2.11.4. Recent Developments
- 11.2.11.5. Financials (Based on Availability)
- 11.2.12 metrel
- 11.2.12.1. Overview
- 11.2.12.2. Products
- 11.2.12.3. SWOT Analysis
- 11.2.12.4. Recent Developments
- 11.2.12.5. Financials (Based on Availability)
- 11.2.13 VEETECH INSTRUMENTATION & CONTROL SERVICE L.L.C
- 11.2.13.1. Overview
- 11.2.13.2. Products
- 11.2.13.3. SWOT Analysis
- 11.2.13.4. Recent Developments
- 11.2.13.5. Financials (Based on Availability)
- 11.2.14 EKO Instruments
- 11.2.14.1. Overview
- 11.2.14.2. Products
- 11.2.14.3. SWOT Analysis
- 11.2.14.4. Recent Developments
- 11.2.14.5. Financials (Based on Availability)
- 11.2.1 Fluke
List of Figures
- Figure 1: Global I-V Curve Tracer Revenue Breakdown (million, %) by Region 2024 & 2032
- Figure 2: Global I-V Curve Tracer Volume Breakdown (K, %) by Region 2024 & 2032
- Figure 3: North America I-V Curve Tracer Revenue (million), by Application 2024 & 2032
- Figure 4: North America I-V Curve Tracer Volume (K), by Application 2024 & 2032
- Figure 5: North America I-V Curve Tracer Revenue Share (%), by Application 2024 & 2032
- Figure 6: North America I-V Curve Tracer Volume Share (%), by Application 2024 & 2032
- Figure 7: North America I-V Curve Tracer Revenue (million), by Types 2024 & 2032
- Figure 8: North America I-V Curve Tracer Volume (K), by Types 2024 & 2032
- Figure 9: North America I-V Curve Tracer Revenue Share (%), by Types 2024 & 2032
- Figure 10: North America I-V Curve Tracer Volume Share (%), by Types 2024 & 2032
- Figure 11: North America I-V Curve Tracer Revenue (million), by Country 2024 & 2032
- Figure 12: North America I-V Curve Tracer Volume (K), by Country 2024 & 2032
- Figure 13: North America I-V Curve Tracer Revenue Share (%), by Country 2024 & 2032
- Figure 14: North America I-V Curve Tracer Volume Share (%), by Country 2024 & 2032
- Figure 15: South America I-V Curve Tracer Revenue (million), by Application 2024 & 2032
- Figure 16: South America I-V Curve Tracer Volume (K), by Application 2024 & 2032
- Figure 17: South America I-V Curve Tracer Revenue Share (%), by Application 2024 & 2032
- Figure 18: South America I-V Curve Tracer Volume Share (%), by Application 2024 & 2032
- Figure 19: South America I-V Curve Tracer Revenue (million), by Types 2024 & 2032
- Figure 20: South America I-V Curve Tracer Volume (K), by Types 2024 & 2032
- Figure 21: South America I-V Curve Tracer Revenue Share (%), by Types 2024 & 2032
- Figure 22: South America I-V Curve Tracer Volume Share (%), by Types 2024 & 2032
- Figure 23: South America I-V Curve Tracer Revenue (million), by Country 2024 & 2032
- Figure 24: South America I-V Curve Tracer Volume (K), by Country 2024 & 2032
- Figure 25: South America I-V Curve Tracer Revenue Share (%), by Country 2024 & 2032
- Figure 26: South America I-V Curve Tracer Volume Share (%), by Country 2024 & 2032
- Figure 27: Europe I-V Curve Tracer Revenue (million), by Application 2024 & 2032
- Figure 28: Europe I-V Curve Tracer Volume (K), by Application 2024 & 2032
- Figure 29: Europe I-V Curve Tracer Revenue Share (%), by Application 2024 & 2032
- Figure 30: Europe I-V Curve Tracer Volume Share (%), by Application 2024 & 2032
- Figure 31: Europe I-V Curve Tracer Revenue (million), by Types 2024 & 2032
- Figure 32: Europe I-V Curve Tracer Volume (K), by Types 2024 & 2032
- Figure 33: Europe I-V Curve Tracer Revenue Share (%), by Types 2024 & 2032
- Figure 34: Europe I-V Curve Tracer Volume Share (%), by Types 2024 & 2032
- Figure 35: Europe I-V Curve Tracer Revenue (million), by Country 2024 & 2032
- Figure 36: Europe I-V Curve Tracer Volume (K), by Country 2024 & 2032
- Figure 37: Europe I-V Curve Tracer Revenue Share (%), by Country 2024 & 2032
- Figure 38: Europe I-V Curve Tracer Volume Share (%), by Country 2024 & 2032
- Figure 39: Middle East & Africa I-V Curve Tracer Revenue (million), by Application 2024 & 2032
- Figure 40: Middle East & Africa I-V Curve Tracer Volume (K), by Application 2024 & 2032
- Figure 41: Middle East & Africa I-V Curve Tracer Revenue Share (%), by Application 2024 & 2032
- Figure 42: Middle East & Africa I-V Curve Tracer Volume Share (%), by Application 2024 & 2032
- Figure 43: Middle East & Africa I-V Curve Tracer Revenue (million), by Types 2024 & 2032
- Figure 44: Middle East & Africa I-V Curve Tracer Volume (K), by Types 2024 & 2032
- Figure 45: Middle East & Africa I-V Curve Tracer Revenue Share (%), by Types 2024 & 2032
- Figure 46: Middle East & Africa I-V Curve Tracer Volume Share (%), by Types 2024 & 2032
- Figure 47: Middle East & Africa I-V Curve Tracer Revenue (million), by Country 2024 & 2032
- Figure 48: Middle East & Africa I-V Curve Tracer Volume (K), by Country 2024 & 2032
- Figure 49: Middle East & Africa I-V Curve Tracer Revenue Share (%), by Country 2024 & 2032
- Figure 50: Middle East & Africa I-V Curve Tracer Volume Share (%), by Country 2024 & 2032
- Figure 51: Asia Pacific I-V Curve Tracer Revenue (million), by Application 2024 & 2032
- Figure 52: Asia Pacific I-V Curve Tracer Volume (K), by Application 2024 & 2032
- Figure 53: Asia Pacific I-V Curve Tracer Revenue Share (%), by Application 2024 & 2032
- Figure 54: Asia Pacific I-V Curve Tracer Volume Share (%), by Application 2024 & 2032
- Figure 55: Asia Pacific I-V Curve Tracer Revenue (million), by Types 2024 & 2032
- Figure 56: Asia Pacific I-V Curve Tracer Volume (K), by Types 2024 & 2032
- Figure 57: Asia Pacific I-V Curve Tracer Revenue Share (%), by Types 2024 & 2032
- Figure 58: Asia Pacific I-V Curve Tracer Volume Share (%), by Types 2024 & 2032
- Figure 59: Asia Pacific I-V Curve Tracer Revenue (million), by Country 2024 & 2032
- Figure 60: Asia Pacific I-V Curve Tracer Volume (K), by Country 2024 & 2032
- Figure 61: Asia Pacific I-V Curve Tracer Revenue Share (%), by Country 2024 & 2032
- Figure 62: Asia Pacific I-V Curve Tracer Volume Share (%), by Country 2024 & 2032
List of Tables
- Table 1: Global I-V Curve Tracer Revenue million Forecast, by Region 2019 & 2032
- Table 2: Global I-V Curve Tracer Volume K Forecast, by Region 2019 & 2032
- Table 3: Global I-V Curve Tracer Revenue million Forecast, by Application 2019 & 2032
- Table 4: Global I-V Curve Tracer Volume K Forecast, by Application 2019 & 2032
- Table 5: Global I-V Curve Tracer Revenue million Forecast, by Types 2019 & 2032
- Table 6: Global I-V Curve Tracer Volume K Forecast, by Types 2019 & 2032
- Table 7: Global I-V Curve Tracer Revenue million Forecast, by Region 2019 & 2032
- Table 8: Global I-V Curve Tracer Volume K Forecast, by Region 2019 & 2032
- Table 9: Global I-V Curve Tracer Revenue million Forecast, by Application 2019 & 2032
- Table 10: Global I-V Curve Tracer Volume K Forecast, by Application 2019 & 2032
- Table 11: Global I-V Curve Tracer Revenue million Forecast, by Types 2019 & 2032
- Table 12: Global I-V Curve Tracer Volume K Forecast, by Types 2019 & 2032
- Table 13: Global I-V Curve Tracer Revenue million Forecast, by Country 2019 & 2032
- Table 14: Global I-V Curve Tracer Volume K Forecast, by Country 2019 & 2032
- Table 15: United States I-V Curve Tracer Revenue (million) Forecast, by Application 2019 & 2032
- Table 16: United States I-V Curve Tracer Volume (K) Forecast, by Application 2019 & 2032
- Table 17: Canada I-V Curve Tracer Revenue (million) Forecast, by Application 2019 & 2032
- Table 18: Canada I-V Curve Tracer Volume (K) Forecast, by Application 2019 & 2032
- Table 19: Mexico I-V Curve Tracer Revenue (million) Forecast, by Application 2019 & 2032
- Table 20: Mexico I-V Curve Tracer Volume (K) Forecast, by Application 2019 & 2032
- Table 21: Global I-V Curve Tracer Revenue million Forecast, by Application 2019 & 2032
- Table 22: Global I-V Curve Tracer Volume K Forecast, by Application 2019 & 2032
- Table 23: Global I-V Curve Tracer Revenue million Forecast, by Types 2019 & 2032
- Table 24: Global I-V Curve Tracer Volume K Forecast, by Types 2019 & 2032
- Table 25: Global I-V Curve Tracer Revenue million Forecast, by Country 2019 & 2032
- Table 26: Global I-V Curve Tracer Volume K Forecast, by Country 2019 & 2032
- Table 27: Brazil I-V Curve Tracer Revenue (million) Forecast, by Application 2019 & 2032
- Table 28: Brazil I-V Curve Tracer Volume (K) Forecast, by Application 2019 & 2032
- Table 29: Argentina I-V Curve Tracer Revenue (million) Forecast, by Application 2019 & 2032
- Table 30: Argentina I-V Curve Tracer Volume (K) Forecast, by Application 2019 & 2032
- Table 31: Rest of South America I-V Curve Tracer Revenue (million) Forecast, by Application 2019 & 2032
- Table 32: Rest of South America I-V Curve Tracer Volume (K) Forecast, by Application 2019 & 2032
- Table 33: Global I-V Curve Tracer Revenue million Forecast, by Application 2019 & 2032
- Table 34: Global I-V Curve Tracer Volume K Forecast, by Application 2019 & 2032
- Table 35: Global I-V Curve Tracer Revenue million Forecast, by Types 2019 & 2032
- Table 36: Global I-V Curve Tracer Volume K Forecast, by Types 2019 & 2032
- Table 37: Global I-V Curve Tracer Revenue million Forecast, by Country 2019 & 2032
- Table 38: Global I-V Curve Tracer Volume K Forecast, by Country 2019 & 2032
- Table 39: United Kingdom I-V Curve Tracer Revenue (million) Forecast, by Application 2019 & 2032
- Table 40: United Kingdom I-V Curve Tracer Volume (K) Forecast, by Application 2019 & 2032
- Table 41: Germany I-V Curve Tracer Revenue (million) Forecast, by Application 2019 & 2032
- Table 42: Germany I-V Curve Tracer Volume (K) Forecast, by Application 2019 & 2032
- Table 43: France I-V Curve Tracer Revenue (million) Forecast, by Application 2019 & 2032
- Table 44: France I-V Curve Tracer Volume (K) Forecast, by Application 2019 & 2032
- Table 45: Italy I-V Curve Tracer Revenue (million) Forecast, by Application 2019 & 2032
- Table 46: Italy I-V Curve Tracer Volume (K) Forecast, by Application 2019 & 2032
- Table 47: Spain I-V Curve Tracer Revenue (million) Forecast, by Application 2019 & 2032
- Table 48: Spain I-V Curve Tracer Volume (K) Forecast, by Application 2019 & 2032
- Table 49: Russia I-V Curve Tracer Revenue (million) Forecast, by Application 2019 & 2032
- Table 50: Russia I-V Curve Tracer Volume (K) Forecast, by Application 2019 & 2032
- Table 51: Benelux I-V Curve Tracer Revenue (million) Forecast, by Application 2019 & 2032
- Table 52: Benelux I-V Curve Tracer Volume (K) Forecast, by Application 2019 & 2032
- Table 53: Nordics I-V Curve Tracer Revenue (million) Forecast, by Application 2019 & 2032
- Table 54: Nordics I-V Curve Tracer Volume (K) Forecast, by Application 2019 & 2032
- Table 55: Rest of Europe I-V Curve Tracer Revenue (million) Forecast, by Application 2019 & 2032
- Table 56: Rest of Europe I-V Curve Tracer Volume (K) Forecast, by Application 2019 & 2032
- Table 57: Global I-V Curve Tracer Revenue million Forecast, by Application 2019 & 2032
- Table 58: Global I-V Curve Tracer Volume K Forecast, by Application 2019 & 2032
- Table 59: Global I-V Curve Tracer Revenue million Forecast, by Types 2019 & 2032
- Table 60: Global I-V Curve Tracer Volume K Forecast, by Types 2019 & 2032
- Table 61: Global I-V Curve Tracer Revenue million Forecast, by Country 2019 & 2032
- Table 62: Global I-V Curve Tracer Volume K Forecast, by Country 2019 & 2032
- Table 63: Turkey I-V Curve Tracer Revenue (million) Forecast, by Application 2019 & 2032
- Table 64: Turkey I-V Curve Tracer Volume (K) Forecast, by Application 2019 & 2032
- Table 65: Israel I-V Curve Tracer Revenue (million) Forecast, by Application 2019 & 2032
- Table 66: Israel I-V Curve Tracer Volume (K) Forecast, by Application 2019 & 2032
- Table 67: GCC I-V Curve Tracer Revenue (million) Forecast, by Application 2019 & 2032
- Table 68: GCC I-V Curve Tracer Volume (K) Forecast, by Application 2019 & 2032
- Table 69: North Africa I-V Curve Tracer Revenue (million) Forecast, by Application 2019 & 2032
- Table 70: North Africa I-V Curve Tracer Volume (K) Forecast, by Application 2019 & 2032
- Table 71: South Africa I-V Curve Tracer Revenue (million) Forecast, by Application 2019 & 2032
- Table 72: South Africa I-V Curve Tracer Volume (K) Forecast, by Application 2019 & 2032
- Table 73: Rest of Middle East & Africa I-V Curve Tracer Revenue (million) Forecast, by Application 2019 & 2032
- Table 74: Rest of Middle East & Africa I-V Curve Tracer Volume (K) Forecast, by Application 2019 & 2032
- Table 75: Global I-V Curve Tracer Revenue million Forecast, by Application 2019 & 2032
- Table 76: Global I-V Curve Tracer Volume K Forecast, by Application 2019 & 2032
- Table 77: Global I-V Curve Tracer Revenue million Forecast, by Types 2019 & 2032
- Table 78: Global I-V Curve Tracer Volume K Forecast, by Types 2019 & 2032
- Table 79: Global I-V Curve Tracer Revenue million Forecast, by Country 2019 & 2032
- Table 80: Global I-V Curve Tracer Volume K Forecast, by Country 2019 & 2032
- Table 81: China I-V Curve Tracer Revenue (million) Forecast, by Application 2019 & 2032
- Table 82: China I-V Curve Tracer Volume (K) Forecast, by Application 2019 & 2032
- Table 83: India I-V Curve Tracer Revenue (million) Forecast, by Application 2019 & 2032
- Table 84: India I-V Curve Tracer Volume (K) Forecast, by Application 2019 & 2032
- Table 85: Japan I-V Curve Tracer Revenue (million) Forecast, by Application 2019 & 2032
- Table 86: Japan I-V Curve Tracer Volume (K) Forecast, by Application 2019 & 2032
- Table 87: South Korea I-V Curve Tracer Revenue (million) Forecast, by Application 2019 & 2032
- Table 88: South Korea I-V Curve Tracer Volume (K) Forecast, by Application 2019 & 2032
- Table 89: ASEAN I-V Curve Tracer Revenue (million) Forecast, by Application 2019 & 2032
- Table 90: ASEAN I-V Curve Tracer Volume (K) Forecast, by Application 2019 & 2032
- Table 91: Oceania I-V Curve Tracer Revenue (million) Forecast, by Application 2019 & 2032
- Table 92: Oceania I-V Curve Tracer Volume (K) Forecast, by Application 2019 & 2032
- Table 93: Rest of Asia Pacific I-V Curve Tracer Revenue (million) Forecast, by Application 2019 & 2032
- Table 94: Rest of Asia Pacific I-V Curve Tracer Volume (K) Forecast, by Application 2019 & 2032
Frequently Asked Questions
1. What is the projected Compound Annual Growth Rate (CAGR) of the I-V Curve Tracer?
The projected CAGR is approximately XX%.
2. Which companies are prominent players in the I-V Curve Tracer?
Key companies in the market include Fluke, PROVA, Solmetric, Inc, Emazys, Seaward, HT Italia Srl, Ennov, Gossen Metrawatt GmbH, Raydec, Kimo Electronic Pvt Ltd, metrel, VEETECH INSTRUMENTATION & CONTROL SERVICE L.L.C, EKO Instruments.
3. What are the main segments of the I-V Curve Tracer?
The market segments include Application, Types.
4. Can you provide details about the market size?
The market size is estimated to be USD XXX million as of 2022.
5. What are some drivers contributing to market growth?
N/A
6. What are the notable trends driving market growth?
N/A
7. Are there any restraints impacting market growth?
N/A
8. Can you provide examples of recent developments in the market?
N/A
9. What pricing options are available for accessing the report?
Pricing options include single-user, multi-user, and enterprise licenses priced at USD 3350.00, USD 5025.00, and USD 6700.00 respectively.
10. Is the market size provided in terms of value or volume?
The market size is provided in terms of value, measured in million and volume, measured in K.
11. Are there any specific market keywords associated with the report?
Yes, the market keyword associated with the report is "I-V Curve Tracer," which aids in identifying and referencing the specific market segment covered.
12. How do I determine which pricing option suits my needs best?
The pricing options vary based on user requirements and access needs. Individual users may opt for single-user licenses, while businesses requiring broader access may choose multi-user or enterprise licenses for cost-effective access to the report.
13. Are there any additional resources or data provided in the I-V Curve Tracer report?
While the report offers comprehensive insights, it's advisable to review the specific contents or supplementary materials provided to ascertain if additional resources or data are available.
14. How can I stay updated on further developments or reports in the I-V Curve Tracer?
To stay informed about further developments, trends, and reports in the I-V Curve Tracer, consider subscribing to industry newsletters, following relevant companies and organizations, or regularly checking reputable industry news sources and publications.
Methodology
Step 1 - Identification of Relevant Samples Size from Population Database


Step 2 - Approaches for Defining Global Market Size (Value, Volume* & Price*)

Note*: In applicable scenarios
Step 3 - Data Sources
Primary Research
- Web Analytics
- Survey Reports
- Research Institute
- Latest Research Reports
- Opinion Leaders
Secondary Research
- Annual Reports
- White Paper
- Latest Press Release
- Industry Association
- Paid Database
- Investor Presentations

Step 4 - Data Triangulation
Involves using different sources of information in order to increase the validity of a study
These sources are likely to be stakeholders in a program - participants, other researchers, program staff, other community members, and so on.
Then we put all data in single framework & apply various statistical tools to find out the dynamic on the market.
During the analysis stage, feedback from the stakeholder groups would be compared to determine areas of agreement as well as areas of divergence
