

Key Insights
The global Industrial Membrane Elements market is poised for significant expansion, projected to reach an estimated market size of $9,279 million by 2025. This growth is underpinned by a robust Compound Annual Growth Rate (CAGR) of 6.3%, indicating a healthy and sustained upward trajectory for the industry. Key drivers fueling this expansion include the escalating global demand for clean water, particularly in the face of increasing water scarcity and the urgent need for effective wastewater treatment solutions. The stringent regulatory landscape, mandating improved water quality standards across various industries, further propels the adoption of advanced membrane technologies. Furthermore, the expanding applications of industrial membrane elements in sectors like Food and Beverage for purification and separation processes, and in the Pharmaceutical Industry for sterile filtration and drug manufacturing, are contributing significantly to market momentum. The continuous innovation in membrane materials and manufacturing processes, leading to enhanced efficiency, durability, and cost-effectiveness, also plays a crucial role in driving market penetration.
The market is segmented into various applications, with Seawater Desalination and Sewage Treatment emerging as dominant segments due to critical global water challenges. Nanofiltration and Ultrafiltration membrane elements are witnessing particularly strong demand, reflecting advancements in membrane technology that offer superior separation capabilities. The competitive landscape is characterized by the presence of established global players such as DuPont, Toray, and SUEZ, alongside emerging regional innovators like Hunan Keensen Technology and Vontron Technology, all vying for market share through product development and strategic partnerships. Geographically, Asia Pacific, led by China and India, is expected to be a key growth engine, driven by rapid industrialization and increasing environmental consciousness. North America and Europe, with their mature industrial bases and advanced regulatory frameworks, will continue to represent substantial markets. The market’s resilience is further bolstered by ongoing research into novel membrane materials and manufacturing techniques, promising even greater efficiency and sustainability in the years to come.
Industrial Membrane Elements Market: Comprehensive Analysis & Future Outlook (2019-2033)
This in-depth report provides a definitive analysis of the global industrial membrane elements market, encompassing historical trends, current dynamics, and future projections. Leveraging a wealth of data and industry insights, this study is essential for stakeholders seeking to understand market size, growth drivers, competitive landscape, and emerging opportunities within this critical sector. The report offers a granular view of parent and child markets, providing a complete picture of market segmentation and value chain evolution.
Industrial Membrane Elements Market Dynamics & Structure
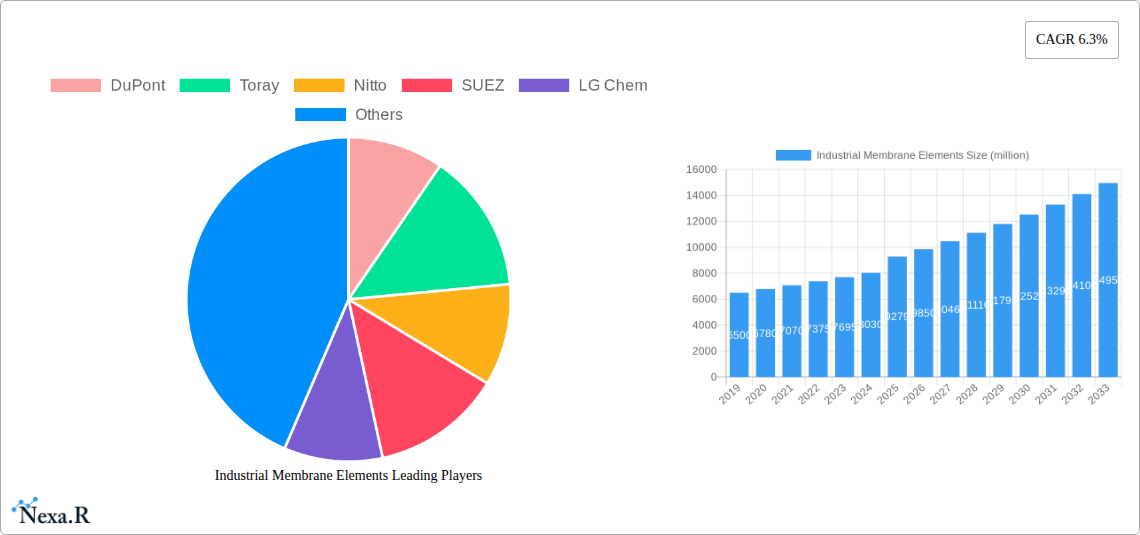
The industrial membrane elements market exhibits a moderately concentrated structure, with key players like DuPont, Toray, and SUEZ holding significant market shares, estimated at approximately 25%, 20%, and 15% respectively. Technological innovation is a primary driver, fueled by advancements in material science leading to enhanced membrane performance, selectivity, and lifespan. Regulatory frameworks, particularly concerning water treatment and environmental protection, are increasingly stringent, compelling manufacturers to develop solutions that meet or exceed these standards. Competitive product substitutes, such as conventional filtration methods, present a challenge, but the superior efficiency and sustainability of membrane technology are gradually displacing them. End-user demographics are shifting towards industries with higher demands for purified water and efficient separation processes, including the booming seawater desalination and sewage treatment segments. Merger and acquisition (M&A) activity is moderate, with approximately 5-7 significant deals annually, primarily aimed at consolidating market positions or acquiring specialized technological capabilities.
- Market Concentration: Top 3 players account for ~60% of the market share.
- Technological Innovation: Focus on fouling resistance, energy efficiency, and selectivity.
- Regulatory Influence: Driving adoption of advanced membrane technologies for environmental compliance.
- Competitive Landscape: Increasing competition from emerging players, especially in Asia.
- M&A Trends: Strategic acquisitions to enhance product portfolios and market reach.
Industrial Membrane Elements Growth Trends & Insights
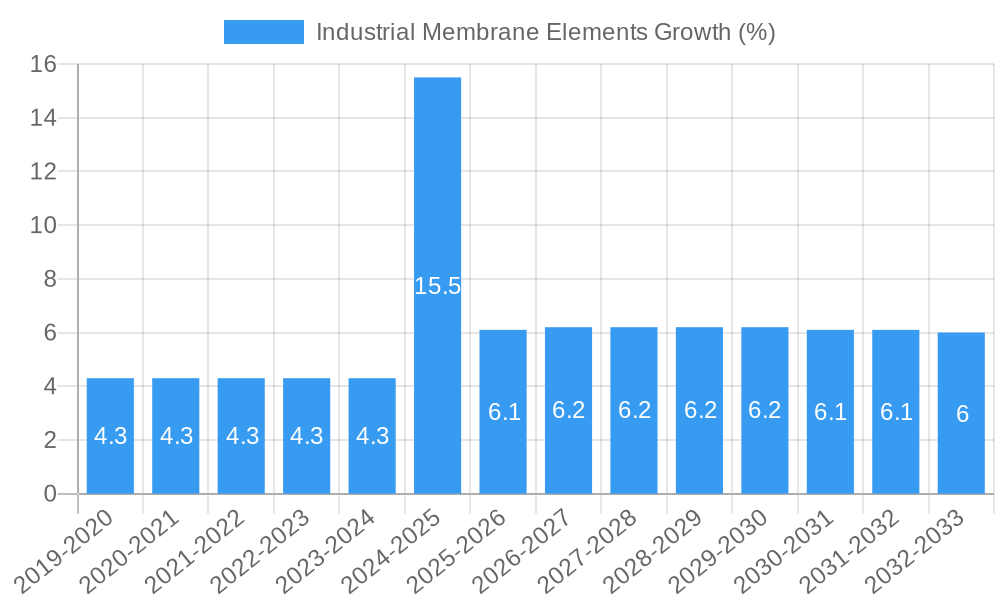
The industrial membrane elements market is poised for robust growth, driven by escalating global demand for clean water, stricter environmental regulations, and the expanding applications of membrane technology across diverse industries. The market size, estimated at approximately $9,500 million in 2025, is projected to grow at a Compound Annual Growth Rate (CAGR) of 7.2% from 2025 to 2033, reaching an estimated $16,400 million by the end of the forecast period. This expansion is underpinned by increasing adoption rates in both mature and developing economies, particularly in Asia-Pacific and the Middle East, where water scarcity and industrialization are significant drivers. Technological disruptions, such as the development of novel membrane materials (e.g., graphene-based membranes) and advanced manufacturing techniques, are further stimulating market growth by offering improved performance and cost-effectiveness. Consumer behavior shifts are also playing a crucial role, with industries increasingly prioritizing sustainable and efficient separation processes to reduce operational costs and environmental impact. The penetration of membrane technology in sectors like food and beverage and pharmaceuticals continues to deepen, as these industries seek higher purity standards and more efficient product recovery. For instance, the adoption of reverse osmosis membrane elements in seawater desalination is witnessing exponential growth due to increasing investments in desalination infrastructure worldwide. The base year 2025 sees a significant market value of $9,500 million.
- Market Size Evolution: From $7,200 million in 2019 to an estimated $16,400 million by 2033.
- CAGR: Projected at 7.2% for the forecast period 2025-2033.
- Adoption Rates: Steadily increasing across all key application segments.
- Technological Disruptions: Innovations in material science and manufacturing are key growth enablers.
- Consumer Behavior Shifts: Growing preference for sustainable and cost-effective separation solutions.
- Market Penetration: Deepening in water-intensive industries and emerging economies.
Dominant Regions, Countries, or Segments in Industrial Membrane Elements
The Seawater Desalination application segment, particularly driven by the Reverse Osmosis Membrane Element type, stands as the dominant force shaping the global industrial membrane elements market. This segment is projected to account for approximately 35% of the total market revenue in 2025, estimated at around $3,325 million. The overwhelming demand for potable water in arid regions and rapidly urbanizing coastal areas, coupled with significant governmental investments in desalination infrastructure, fuels this dominance. Countries like Saudi Arabia, the United Arab Emirates, China, and Australia are leading the charge with ambitious large-scale desalination projects. Economic policies supporting water security, alongside technological advancements that have dramatically reduced the energy consumption and operational costs of reverse osmosis systems, are key drivers. The market share for this segment is expected to continue its upward trajectory due to the persistent and growing need for freshwater resources.
Key Drivers in Seawater Desalination (Reverse Osmosis):
- Water Scarcity: Increasing global demand for freshwater resources in arid and semi-arid regions.
- Governmental Initiatives: Substantial investments in desalination infrastructure by national governments to ensure water security.
- Technological Advancements: Improved energy efficiency and reduced operational costs of RO membrane elements.
- Environmental Concerns: Growing awareness and regulatory pressure to manage water resources sustainably.
- Cost-Effectiveness: Decreasing cost of desalination compared to alternative water sources.
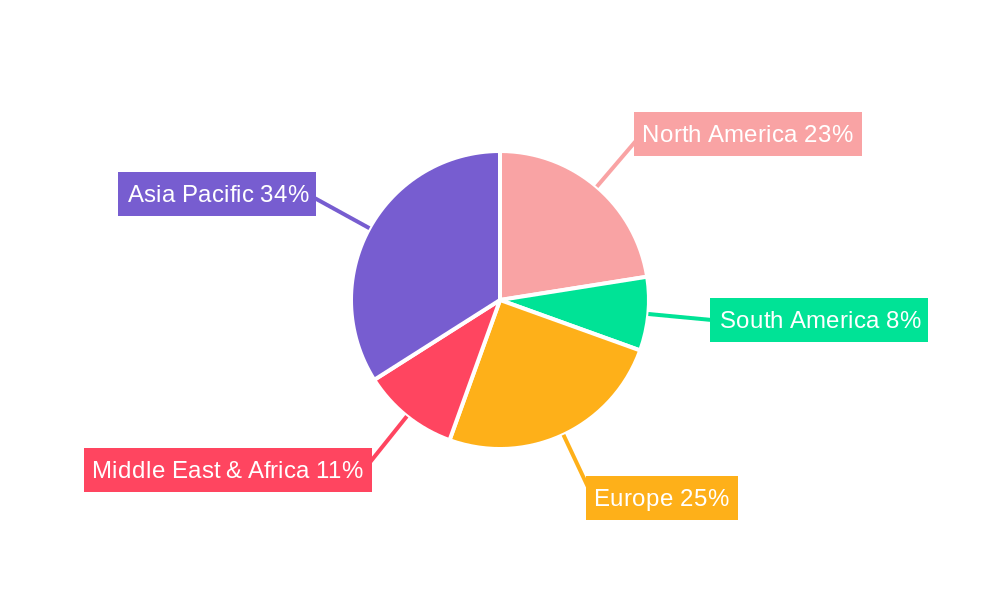
The Asia-Pacific region is anticipated to be the leading geographical market, driven by rapid industrialization, growing populations, and a strong emphasis on environmental protection policies, particularly in China and India. This region is expected to contribute over 30% of the global market revenue in 2025.
- Dominant Region: Asia-Pacific.
- Key Countries: China, India, Saudi Arabia, UAE, USA.
- Dominant Application: Seawater Desalination ($3,325 million in 2025).
- Dominant Type: Reverse Osmosis Membrane Element ($4,800 million in 2025).
Industrial Membrane Elements Product Landscape
The industrial membrane elements market is characterized by continuous product innovation focused on enhancing separation efficiency, durability, and application versatility. Manufacturers are developing advanced materials and novel designs to address specific industry needs, such as improved fouling resistance in wastewater treatment and higher selectivity in food and beverage processing. For instance, ultrafiltration (UF) membrane elements are seeing advancements in pore size control and material chemistry, leading to superior performance in dairy processing and pharmaceutical purification. Nanofiltration (NF) membrane elements are evolving to offer more precise ion and molecule separation, critical for applications like sugar concentration and heavy metal removal. The development of spiral-wound elements with optimized flow paths and reduced pressure drops is a common trend across all types, directly translating to lower energy consumption and operational costs for end-users.
Key Drivers, Barriers & Challenges in Industrial Membrane Elements
Key Drivers:
- Growing Demand for Clean Water: Escalating global population and industrialization necessitate advanced water purification solutions.
- Stringent Environmental Regulations: Governments worldwide are imposing stricter standards on water discharge and quality, driving demand for efficient treatment technologies.
- Technological Advancements: Continuous innovation in materials, manufacturing processes, and membrane designs leading to higher performance and lower costs.
- Industrial Growth: Expansion in sectors like food & beverage, pharmaceuticals, and power generation, all requiring specialized separation processes.
Barriers & Challenges:
- High Initial Capital Investment: The upfront cost of implementing membrane systems can be substantial for some industries.
- Membrane Fouling: Accumulation of impurities on membrane surfaces can reduce efficiency and increase maintenance costs.
- Competition from Conventional Technologies: Established filtration methods can sometimes offer lower initial costs, posing a competitive threat.
- Supply Chain Disruptions: Vulnerability to global supply chain issues for raw materials and finished products. Estimated impact on market growth: 1.5% reduction in CAGR.
- Skilled Workforce Requirements: Operation and maintenance of advanced membrane systems require specialized expertise.
Emerging Opportunities in Industrial Membrane Elements
Emerging opportunities lie in the development of smart membranes with self-cleaning capabilities and real-time performance monitoring. The burgeoning circular economy is creating significant demand for membrane technologies in resource recovery applications, such as extracting valuable materials from industrial wastewater. Furthermore, the expansion of membrane applications in the pharmaceutical industry for drug purification and API (Active Pharmaceutical Ingredient) recovery presents a high-growth avenue. The increasing focus on microplastic removal from wastewater and the development of specialized membranes for precise molecular separation in advanced chemical processes also represent lucrative prospects.
Growth Accelerators in the Industrial Membrane Elements Industry
Long-term growth in the industrial membrane elements industry is significantly accelerated by breakthroughs in material science, leading to the development of membranes with unprecedented selectivity, durability, and resistance to harsh chemical environments. Strategic partnerships between membrane manufacturers and end-users are crucial for tailoring solutions to specific industrial challenges, fostering innovation and accelerating adoption. Furthermore, the expansion of membrane applications into novel sectors, such as energy storage (e.g., flow batteries) and advanced manufacturing, will act as significant growth catalysts, opening up entirely new market segments. The increasing integration of IoT and AI for predictive maintenance and optimized system performance will also drive efficiency and reduce operational costs, making membrane technology even more attractive.
Key Players Shaping the Industrial Membrane Elements Market
- DuPont
- Toray
- Nitto
- SUEZ
- LG Chem
- MANN+HUMMEL
- Hunan Keensen Technology
- N-Tech Environmental Protection Science And Technology
- Vontron Technology
- Jozzon Membrane Technology
- Suzhou Feymer Membrane Technology
- UltraClean Membrane
- Zhejiang E-MEM New Material Technology
- Ningbo Rixin Hengli Technology
- Hunan Ovay Technology
- AROMEM PTE
- Jiangsu Bangtec Environmental Sci-Tech
- Jingqingyuan (Yangzhou) Water Treatment Equipment
- Beijing OriginWater Separation Membrane Technology
- HID Membrane
Notable Milestones in Industrial Membrane Elements Sector
- 2019: Launch of advanced fouling-resistant RO membranes by Toray, improving operational efficiency in desalination.
- 2020: DuPont's acquisition of a leading UF membrane technology company, expanding its water treatment portfolio.
- 2021: Significant investments by SUEZ in R&D for novel membrane materials with enhanced chemical resistance.
- 2022: Vontron Technology introduces next-generation NF membranes for high-purity industrial applications.
- 2023: Nitto develops biomimetic membranes for advanced molecular separation in the pharmaceutical sector.
- 2024: Increased focus on sustainable manufacturing processes and recycling initiatives by major players.
In-Depth Industrial Membrane Elements Market Outlook
The future outlook for the industrial membrane elements market is exceptionally bright, driven by a confluence of global megatrends and continuous technological advancements. The projected market value of $16,400 million by 2033 signifies substantial growth fueled by the unwavering demand for purified water, stricter environmental regulations, and the expanding utility of membrane technologies across a widening array of industrial applications. Growth accelerators, including the development of smart and self-cleaning membranes, innovative applications in resource recovery and the circular economy, and the penetration into high-value sectors like pharmaceuticals and advanced materials, will solidify the market's upward trajectory. Strategic collaborations and a relentless focus on research and development will be paramount for industry players seeking to capitalize on these opportunities and maintain a competitive edge in this dynamic and essential global market.
Industrial Membrane Elements Segmentation
-
1. Application
- 1.1. Seawater Desalination
- 1.2. Sewage Treatment
- 1.3. Food and Beverage
- 1.4. Pharmaceutical Industry
- 1.5. Others
-
2. Type
- 2.1. Reverse Osmosis Membrane Element
- 2.2. Nanofiltration Membrane Element
- 2.3. Ultrafiltration Membrane Element
- 2.4. Others
Industrial Membrane Elements Segmentation By Geography
-
1. North America
- 1.1. United States
- 1.2. Canada
- 1.3. Mexico
-
2. South America
- 2.1. Brazil
- 2.2. Argentina
- 2.3. Rest of South America
-
3. Europe
- 3.1. United Kingdom
- 3.2. Germany
- 3.3. France
- 3.4. Italy
- 3.5. Spain
- 3.6. Russia
- 3.7. Benelux
- 3.8. Nordics
- 3.9. Rest of Europe
-
4. Middle East & Africa
- 4.1. Turkey
- 4.2. Israel
- 4.3. GCC
- 4.4. North Africa
- 4.5. South Africa
- 4.6. Rest of Middle East & Africa
-
5. Asia Pacific
- 5.1. China
- 5.2. India
- 5.3. Japan
- 5.4. South Korea
- 5.5. ASEAN
- 5.6. Oceania
- 5.7. Rest of Asia Pacific
Industrial Membrane Elements REPORT HIGHLIGHTS
| Aspects | Details |
|---|---|
| Study Period | 2019-2033 |
| Base Year | 2024 |
| Estimated Year | 2025 |
| Forecast Period | 2025-2033 |
| Historical Period | 2019-2024 |
| Growth Rate | CAGR of 6.3% from 2019-2033 |
| Segmentation |
|
Table of Contents
- 1. Introduction
- 1.1. Research Scope
- 1.2. Market Segmentation
- 1.3. Research Methodology
- 1.4. Definitions and Assumptions
- 2. Executive Summary
- 2.1. Introduction
- 3. Market Dynamics
- 3.1. Introduction
- 3.2. Market Drivers
- 3.3. Market Restrains
- 3.4. Market Trends
- 4. Market Factor Analysis
- 4.1. Porters Five Forces
- 4.2. Supply/Value Chain
- 4.3. PESTEL analysis
- 4.4. Market Entropy
- 4.5. Patent/Trademark Analysis
- 5. Global Industrial Membrane Elements Analysis, Insights and Forecast, 2019-2031
- 5.1. Market Analysis, Insights and Forecast - by Application
- 5.1.1. Seawater Desalination
- 5.1.2. Sewage Treatment
- 5.1.3. Food and Beverage
- 5.1.4. Pharmaceutical Industry
- 5.1.5. Others
- 5.2. Market Analysis, Insights and Forecast - by Type
- 5.2.1. Reverse Osmosis Membrane Element
- 5.2.2. Nanofiltration Membrane Element
- 5.2.3. Ultrafiltration Membrane Element
- 5.2.4. Others
- 5.3. Market Analysis, Insights and Forecast - by Region
- 5.3.1. North America
- 5.3.2. South America
- 5.3.3. Europe
- 5.3.4. Middle East & Africa
- 5.3.5. Asia Pacific
- 5.1. Market Analysis, Insights and Forecast - by Application
- 6. North America Industrial Membrane Elements Analysis, Insights and Forecast, 2019-2031
- 6.1. Market Analysis, Insights and Forecast - by Application
- 6.1.1. Seawater Desalination
- 6.1.2. Sewage Treatment
- 6.1.3. Food and Beverage
- 6.1.4. Pharmaceutical Industry
- 6.1.5. Others
- 6.2. Market Analysis, Insights and Forecast - by Type
- 6.2.1. Reverse Osmosis Membrane Element
- 6.2.2. Nanofiltration Membrane Element
- 6.2.3. Ultrafiltration Membrane Element
- 6.2.4. Others
- 6.1. Market Analysis, Insights and Forecast - by Application
- 7. South America Industrial Membrane Elements Analysis, Insights and Forecast, 2019-2031
- 7.1. Market Analysis, Insights and Forecast - by Application
- 7.1.1. Seawater Desalination
- 7.1.2. Sewage Treatment
- 7.1.3. Food and Beverage
- 7.1.4. Pharmaceutical Industry
- 7.1.5. Others
- 7.2. Market Analysis, Insights and Forecast - by Type
- 7.2.1. Reverse Osmosis Membrane Element
- 7.2.2. Nanofiltration Membrane Element
- 7.2.3. Ultrafiltration Membrane Element
- 7.2.4. Others
- 7.1. Market Analysis, Insights and Forecast - by Application
- 8. Europe Industrial Membrane Elements Analysis, Insights and Forecast, 2019-2031
- 8.1. Market Analysis, Insights and Forecast - by Application
- 8.1.1. Seawater Desalination
- 8.1.2. Sewage Treatment
- 8.1.3. Food and Beverage
- 8.1.4. Pharmaceutical Industry
- 8.1.5. Others
- 8.2. Market Analysis, Insights and Forecast - by Type
- 8.2.1. Reverse Osmosis Membrane Element
- 8.2.2. Nanofiltration Membrane Element
- 8.2.3. Ultrafiltration Membrane Element
- 8.2.4. Others
- 8.1. Market Analysis, Insights and Forecast - by Application
- 9. Middle East & Africa Industrial Membrane Elements Analysis, Insights and Forecast, 2019-2031
- 9.1. Market Analysis, Insights and Forecast - by Application
- 9.1.1. Seawater Desalination
- 9.1.2. Sewage Treatment
- 9.1.3. Food and Beverage
- 9.1.4. Pharmaceutical Industry
- 9.1.5. Others
- 9.2. Market Analysis, Insights and Forecast - by Type
- 9.2.1. Reverse Osmosis Membrane Element
- 9.2.2. Nanofiltration Membrane Element
- 9.2.3. Ultrafiltration Membrane Element
- 9.2.4. Others
- 9.1. Market Analysis, Insights and Forecast - by Application
- 10. Asia Pacific Industrial Membrane Elements Analysis, Insights and Forecast, 2019-2031
- 10.1. Market Analysis, Insights and Forecast - by Application
- 10.1.1. Seawater Desalination
- 10.1.2. Sewage Treatment
- 10.1.3. Food and Beverage
- 10.1.4. Pharmaceutical Industry
- 10.1.5. Others
- 10.2. Market Analysis, Insights and Forecast - by Type
- 10.2.1. Reverse Osmosis Membrane Element
- 10.2.2. Nanofiltration Membrane Element
- 10.2.3. Ultrafiltration Membrane Element
- 10.2.4. Others
- 10.1. Market Analysis, Insights and Forecast - by Application
- 11. Competitive Analysis
- 11.1. Global Market Share Analysis 2024
- 11.2. Company Profiles
- 11.2.1 DuPont
- 11.2.1.1. Overview
- 11.2.1.2. Products
- 11.2.1.3. SWOT Analysis
- 11.2.1.4. Recent Developments
- 11.2.1.5. Financials (Based on Availability)
- 11.2.2 Toray
- 11.2.2.1. Overview
- 11.2.2.2. Products
- 11.2.2.3. SWOT Analysis
- 11.2.2.4. Recent Developments
- 11.2.2.5. Financials (Based on Availability)
- 11.2.3 Nitto
- 11.2.3.1. Overview
- 11.2.3.2. Products
- 11.2.3.3. SWOT Analysis
- 11.2.3.4. Recent Developments
- 11.2.3.5. Financials (Based on Availability)
- 11.2.4 SUEZ
- 11.2.4.1. Overview
- 11.2.4.2. Products
- 11.2.4.3. SWOT Analysis
- 11.2.4.4. Recent Developments
- 11.2.4.5. Financials (Based on Availability)
- 11.2.5 LG Chem
- 11.2.5.1. Overview
- 11.2.5.2. Products
- 11.2.5.3. SWOT Analysis
- 11.2.5.4. Recent Developments
- 11.2.5.5. Financials (Based on Availability)
- 11.2.6 MANN+HUMMEL
- 11.2.6.1. Overview
- 11.2.6.2. Products
- 11.2.6.3. SWOT Analysis
- 11.2.6.4. Recent Developments
- 11.2.6.5. Financials (Based on Availability)
- 11.2.7 Hunan Keensen Technology
- 11.2.7.1. Overview
- 11.2.7.2. Products
- 11.2.7.3. SWOT Analysis
- 11.2.7.4. Recent Developments
- 11.2.7.5. Financials (Based on Availability)
- 11.2.8 N-Tech Environmental Protection Science And Technology
- 11.2.8.1. Overview
- 11.2.8.2. Products
- 11.2.8.3. SWOT Analysis
- 11.2.8.4. Recent Developments
- 11.2.8.5. Financials (Based on Availability)
- 11.2.9 Vontron Technology
- 11.2.9.1. Overview
- 11.2.9.2. Products
- 11.2.9.3. SWOT Analysis
- 11.2.9.4. Recent Developments
- 11.2.9.5. Financials (Based on Availability)
- 11.2.10 Jozzon Membrane Technology
- 11.2.10.1. Overview
- 11.2.10.2. Products
- 11.2.10.3. SWOT Analysis
- 11.2.10.4. Recent Developments
- 11.2.10.5. Financials (Based on Availability)
- 11.2.11 Suzhou Feymer Membrane Technology
- 11.2.11.1. Overview
- 11.2.11.2. Products
- 11.2.11.3. SWOT Analysis
- 11.2.11.4. Recent Developments
- 11.2.11.5. Financials (Based on Availability)
- 11.2.12 UltraClean Membrane
- 11.2.12.1. Overview
- 11.2.12.2. Products
- 11.2.12.3. SWOT Analysis
- 11.2.12.4. Recent Developments
- 11.2.12.5. Financials (Based on Availability)
- 11.2.13 Zhejiang E-MEM New Material Technology
- 11.2.13.1. Overview
- 11.2.13.2. Products
- 11.2.13.3. SWOT Analysis
- 11.2.13.4. Recent Developments
- 11.2.13.5. Financials (Based on Availability)
- 11.2.14 Ningbo Rixin Hengli Technology
- 11.2.14.1. Overview
- 11.2.14.2. Products
- 11.2.14.3. SWOT Analysis
- 11.2.14.4. Recent Developments
- 11.2.14.5. Financials (Based on Availability)
- 11.2.15 Hunan Ovay Technology
- 11.2.15.1. Overview
- 11.2.15.2. Products
- 11.2.15.3. SWOT Analysis
- 11.2.15.4. Recent Developments
- 11.2.15.5. Financials (Based on Availability)
- 11.2.16 AROMEM PTE
- 11.2.16.1. Overview
- 11.2.16.2. Products
- 11.2.16.3. SWOT Analysis
- 11.2.16.4. Recent Developments
- 11.2.16.5. Financials (Based on Availability)
- 11.2.17 Jiangsu Bangtec Environmental Sci-Tech
- 11.2.17.1. Overview
- 11.2.17.2. Products
- 11.2.17.3. SWOT Analysis
- 11.2.17.4. Recent Developments
- 11.2.17.5. Financials (Based on Availability)
- 11.2.18 Jingqingyuan (Yangzhou) Water Treatment Equipment
- 11.2.18.1. Overview
- 11.2.18.2. Products
- 11.2.18.3. SWOT Analysis
- 11.2.18.4. Recent Developments
- 11.2.18.5. Financials (Based on Availability)
- 11.2.19 Beijing OriginWater Separation Membrane Technology
- 11.2.19.1. Overview
- 11.2.19.2. Products
- 11.2.19.3. SWOT Analysis
- 11.2.19.4. Recent Developments
- 11.2.19.5. Financials (Based on Availability)
- 11.2.20 HID Membrane
- 11.2.20.1. Overview
- 11.2.20.2. Products
- 11.2.20.3. SWOT Analysis
- 11.2.20.4. Recent Developments
- 11.2.20.5. Financials (Based on Availability)
- 11.2.1 DuPont
List of Figures
- Figure 1: Global Industrial Membrane Elements Revenue Breakdown (million, %) by Region 2024 & 2032
- Figure 2: Global Industrial Membrane Elements Volume Breakdown (K, %) by Region 2024 & 2032
- Figure 3: North America Industrial Membrane Elements Revenue (million), by Application 2024 & 2032
- Figure 4: North America Industrial Membrane Elements Volume (K), by Application 2024 & 2032
- Figure 5: North America Industrial Membrane Elements Revenue Share (%), by Application 2024 & 2032
- Figure 6: North America Industrial Membrane Elements Volume Share (%), by Application 2024 & 2032
- Figure 7: North America Industrial Membrane Elements Revenue (million), by Type 2024 & 2032
- Figure 8: North America Industrial Membrane Elements Volume (K), by Type 2024 & 2032
- Figure 9: North America Industrial Membrane Elements Revenue Share (%), by Type 2024 & 2032
- Figure 10: North America Industrial Membrane Elements Volume Share (%), by Type 2024 & 2032
- Figure 11: North America Industrial Membrane Elements Revenue (million), by Country 2024 & 2032
- Figure 12: North America Industrial Membrane Elements Volume (K), by Country 2024 & 2032
- Figure 13: North America Industrial Membrane Elements Revenue Share (%), by Country 2024 & 2032
- Figure 14: North America Industrial Membrane Elements Volume Share (%), by Country 2024 & 2032
- Figure 15: South America Industrial Membrane Elements Revenue (million), by Application 2024 & 2032
- Figure 16: South America Industrial Membrane Elements Volume (K), by Application 2024 & 2032
- Figure 17: South America Industrial Membrane Elements Revenue Share (%), by Application 2024 & 2032
- Figure 18: South America Industrial Membrane Elements Volume Share (%), by Application 2024 & 2032
- Figure 19: South America Industrial Membrane Elements Revenue (million), by Type 2024 & 2032
- Figure 20: South America Industrial Membrane Elements Volume (K), by Type 2024 & 2032
- Figure 21: South America Industrial Membrane Elements Revenue Share (%), by Type 2024 & 2032
- Figure 22: South America Industrial Membrane Elements Volume Share (%), by Type 2024 & 2032
- Figure 23: South America Industrial Membrane Elements Revenue (million), by Country 2024 & 2032
- Figure 24: South America Industrial Membrane Elements Volume (K), by Country 2024 & 2032
- Figure 25: South America Industrial Membrane Elements Revenue Share (%), by Country 2024 & 2032
- Figure 26: South America Industrial Membrane Elements Volume Share (%), by Country 2024 & 2032
- Figure 27: Europe Industrial Membrane Elements Revenue (million), by Application 2024 & 2032
- Figure 28: Europe Industrial Membrane Elements Volume (K), by Application 2024 & 2032
- Figure 29: Europe Industrial Membrane Elements Revenue Share (%), by Application 2024 & 2032
- Figure 30: Europe Industrial Membrane Elements Volume Share (%), by Application 2024 & 2032
- Figure 31: Europe Industrial Membrane Elements Revenue (million), by Type 2024 & 2032
- Figure 32: Europe Industrial Membrane Elements Volume (K), by Type 2024 & 2032
- Figure 33: Europe Industrial Membrane Elements Revenue Share (%), by Type 2024 & 2032
- Figure 34: Europe Industrial Membrane Elements Volume Share (%), by Type 2024 & 2032
- Figure 35: Europe Industrial Membrane Elements Revenue (million), by Country 2024 & 2032
- Figure 36: Europe Industrial Membrane Elements Volume (K), by Country 2024 & 2032
- Figure 37: Europe Industrial Membrane Elements Revenue Share (%), by Country 2024 & 2032
- Figure 38: Europe Industrial Membrane Elements Volume Share (%), by Country 2024 & 2032
- Figure 39: Middle East & Africa Industrial Membrane Elements Revenue (million), by Application 2024 & 2032
- Figure 40: Middle East & Africa Industrial Membrane Elements Volume (K), by Application 2024 & 2032
- Figure 41: Middle East & Africa Industrial Membrane Elements Revenue Share (%), by Application 2024 & 2032
- Figure 42: Middle East & Africa Industrial Membrane Elements Volume Share (%), by Application 2024 & 2032
- Figure 43: Middle East & Africa Industrial Membrane Elements Revenue (million), by Type 2024 & 2032
- Figure 44: Middle East & Africa Industrial Membrane Elements Volume (K), by Type 2024 & 2032
- Figure 45: Middle East & Africa Industrial Membrane Elements Revenue Share (%), by Type 2024 & 2032
- Figure 46: Middle East & Africa Industrial Membrane Elements Volume Share (%), by Type 2024 & 2032
- Figure 47: Middle East & Africa Industrial Membrane Elements Revenue (million), by Country 2024 & 2032
- Figure 48: Middle East & Africa Industrial Membrane Elements Volume (K), by Country 2024 & 2032
- Figure 49: Middle East & Africa Industrial Membrane Elements Revenue Share (%), by Country 2024 & 2032
- Figure 50: Middle East & Africa Industrial Membrane Elements Volume Share (%), by Country 2024 & 2032
- Figure 51: Asia Pacific Industrial Membrane Elements Revenue (million), by Application 2024 & 2032
- Figure 52: Asia Pacific Industrial Membrane Elements Volume (K), by Application 2024 & 2032
- Figure 53: Asia Pacific Industrial Membrane Elements Revenue Share (%), by Application 2024 & 2032
- Figure 54: Asia Pacific Industrial Membrane Elements Volume Share (%), by Application 2024 & 2032
- Figure 55: Asia Pacific Industrial Membrane Elements Revenue (million), by Type 2024 & 2032
- Figure 56: Asia Pacific Industrial Membrane Elements Volume (K), by Type 2024 & 2032
- Figure 57: Asia Pacific Industrial Membrane Elements Revenue Share (%), by Type 2024 & 2032
- Figure 58: Asia Pacific Industrial Membrane Elements Volume Share (%), by Type 2024 & 2032
- Figure 59: Asia Pacific Industrial Membrane Elements Revenue (million), by Country 2024 & 2032
- Figure 60: Asia Pacific Industrial Membrane Elements Volume (K), by Country 2024 & 2032
- Figure 61: Asia Pacific Industrial Membrane Elements Revenue Share (%), by Country 2024 & 2032
- Figure 62: Asia Pacific Industrial Membrane Elements Volume Share (%), by Country 2024 & 2032
List of Tables
- Table 1: Global Industrial Membrane Elements Revenue million Forecast, by Region 2019 & 2032
- Table 2: Global Industrial Membrane Elements Volume K Forecast, by Region 2019 & 2032
- Table 3: Global Industrial Membrane Elements Revenue million Forecast, by Application 2019 & 2032
- Table 4: Global Industrial Membrane Elements Volume K Forecast, by Application 2019 & 2032
- Table 5: Global Industrial Membrane Elements Revenue million Forecast, by Type 2019 & 2032
- Table 6: Global Industrial Membrane Elements Volume K Forecast, by Type 2019 & 2032
- Table 7: Global Industrial Membrane Elements Revenue million Forecast, by Region 2019 & 2032
- Table 8: Global Industrial Membrane Elements Volume K Forecast, by Region 2019 & 2032
- Table 9: Global Industrial Membrane Elements Revenue million Forecast, by Application 2019 & 2032
- Table 10: Global Industrial Membrane Elements Volume K Forecast, by Application 2019 & 2032
- Table 11: Global Industrial Membrane Elements Revenue million Forecast, by Type 2019 & 2032
- Table 12: Global Industrial Membrane Elements Volume K Forecast, by Type 2019 & 2032
- Table 13: Global Industrial Membrane Elements Revenue million Forecast, by Country 2019 & 2032
- Table 14: Global Industrial Membrane Elements Volume K Forecast, by Country 2019 & 2032
- Table 15: United States Industrial Membrane Elements Revenue (million) Forecast, by Application 2019 & 2032
- Table 16: United States Industrial Membrane Elements Volume (K) Forecast, by Application 2019 & 2032
- Table 17: Canada Industrial Membrane Elements Revenue (million) Forecast, by Application 2019 & 2032
- Table 18: Canada Industrial Membrane Elements Volume (K) Forecast, by Application 2019 & 2032
- Table 19: Mexico Industrial Membrane Elements Revenue (million) Forecast, by Application 2019 & 2032
- Table 20: Mexico Industrial Membrane Elements Volume (K) Forecast, by Application 2019 & 2032
- Table 21: Global Industrial Membrane Elements Revenue million Forecast, by Application 2019 & 2032
- Table 22: Global Industrial Membrane Elements Volume K Forecast, by Application 2019 & 2032
- Table 23: Global Industrial Membrane Elements Revenue million Forecast, by Type 2019 & 2032
- Table 24: Global Industrial Membrane Elements Volume K Forecast, by Type 2019 & 2032
- Table 25: Global Industrial Membrane Elements Revenue million Forecast, by Country 2019 & 2032
- Table 26: Global Industrial Membrane Elements Volume K Forecast, by Country 2019 & 2032
- Table 27: Brazil Industrial Membrane Elements Revenue (million) Forecast, by Application 2019 & 2032
- Table 28: Brazil Industrial Membrane Elements Volume (K) Forecast, by Application 2019 & 2032
- Table 29: Argentina Industrial Membrane Elements Revenue (million) Forecast, by Application 2019 & 2032
- Table 30: Argentina Industrial Membrane Elements Volume (K) Forecast, by Application 2019 & 2032
- Table 31: Rest of South America Industrial Membrane Elements Revenue (million) Forecast, by Application 2019 & 2032
- Table 32: Rest of South America Industrial Membrane Elements Volume (K) Forecast, by Application 2019 & 2032
- Table 33: Global Industrial Membrane Elements Revenue million Forecast, by Application 2019 & 2032
- Table 34: Global Industrial Membrane Elements Volume K Forecast, by Application 2019 & 2032
- Table 35: Global Industrial Membrane Elements Revenue million Forecast, by Type 2019 & 2032
- Table 36: Global Industrial Membrane Elements Volume K Forecast, by Type 2019 & 2032
- Table 37: Global Industrial Membrane Elements Revenue million Forecast, by Country 2019 & 2032
- Table 38: Global Industrial Membrane Elements Volume K Forecast, by Country 2019 & 2032
- Table 39: United Kingdom Industrial Membrane Elements Revenue (million) Forecast, by Application 2019 & 2032
- Table 40: United Kingdom Industrial Membrane Elements Volume (K) Forecast, by Application 2019 & 2032
- Table 41: Germany Industrial Membrane Elements Revenue (million) Forecast, by Application 2019 & 2032
- Table 42: Germany Industrial Membrane Elements Volume (K) Forecast, by Application 2019 & 2032
- Table 43: France Industrial Membrane Elements Revenue (million) Forecast, by Application 2019 & 2032
- Table 44: France Industrial Membrane Elements Volume (K) Forecast, by Application 2019 & 2032
- Table 45: Italy Industrial Membrane Elements Revenue (million) Forecast, by Application 2019 & 2032
- Table 46: Italy Industrial Membrane Elements Volume (K) Forecast, by Application 2019 & 2032
- Table 47: Spain Industrial Membrane Elements Revenue (million) Forecast, by Application 2019 & 2032
- Table 48: Spain Industrial Membrane Elements Volume (K) Forecast, by Application 2019 & 2032
- Table 49: Russia Industrial Membrane Elements Revenue (million) Forecast, by Application 2019 & 2032
- Table 50: Russia Industrial Membrane Elements Volume (K) Forecast, by Application 2019 & 2032
- Table 51: Benelux Industrial Membrane Elements Revenue (million) Forecast, by Application 2019 & 2032
- Table 52: Benelux Industrial Membrane Elements Volume (K) Forecast, by Application 2019 & 2032
- Table 53: Nordics Industrial Membrane Elements Revenue (million) Forecast, by Application 2019 & 2032
- Table 54: Nordics Industrial Membrane Elements Volume (K) Forecast, by Application 2019 & 2032
- Table 55: Rest of Europe Industrial Membrane Elements Revenue (million) Forecast, by Application 2019 & 2032
- Table 56: Rest of Europe Industrial Membrane Elements Volume (K) Forecast, by Application 2019 & 2032
- Table 57: Global Industrial Membrane Elements Revenue million Forecast, by Application 2019 & 2032
- Table 58: Global Industrial Membrane Elements Volume K Forecast, by Application 2019 & 2032
- Table 59: Global Industrial Membrane Elements Revenue million Forecast, by Type 2019 & 2032
- Table 60: Global Industrial Membrane Elements Volume K Forecast, by Type 2019 & 2032
- Table 61: Global Industrial Membrane Elements Revenue million Forecast, by Country 2019 & 2032
- Table 62: Global Industrial Membrane Elements Volume K Forecast, by Country 2019 & 2032
- Table 63: Turkey Industrial Membrane Elements Revenue (million) Forecast, by Application 2019 & 2032
- Table 64: Turkey Industrial Membrane Elements Volume (K) Forecast, by Application 2019 & 2032
- Table 65: Israel Industrial Membrane Elements Revenue (million) Forecast, by Application 2019 & 2032
- Table 66: Israel Industrial Membrane Elements Volume (K) Forecast, by Application 2019 & 2032
- Table 67: GCC Industrial Membrane Elements Revenue (million) Forecast, by Application 2019 & 2032
- Table 68: GCC Industrial Membrane Elements Volume (K) Forecast, by Application 2019 & 2032
- Table 69: North Africa Industrial Membrane Elements Revenue (million) Forecast, by Application 2019 & 2032
- Table 70: North Africa Industrial Membrane Elements Volume (K) Forecast, by Application 2019 & 2032
- Table 71: South Africa Industrial Membrane Elements Revenue (million) Forecast, by Application 2019 & 2032
- Table 72: South Africa Industrial Membrane Elements Volume (K) Forecast, by Application 2019 & 2032
- Table 73: Rest of Middle East & Africa Industrial Membrane Elements Revenue (million) Forecast, by Application 2019 & 2032
- Table 74: Rest of Middle East & Africa Industrial Membrane Elements Volume (K) Forecast, by Application 2019 & 2032
- Table 75: Global Industrial Membrane Elements Revenue million Forecast, by Application 2019 & 2032
- Table 76: Global Industrial Membrane Elements Volume K Forecast, by Application 2019 & 2032
- Table 77: Global Industrial Membrane Elements Revenue million Forecast, by Type 2019 & 2032
- Table 78: Global Industrial Membrane Elements Volume K Forecast, by Type 2019 & 2032
- Table 79: Global Industrial Membrane Elements Revenue million Forecast, by Country 2019 & 2032
- Table 80: Global Industrial Membrane Elements Volume K Forecast, by Country 2019 & 2032
- Table 81: China Industrial Membrane Elements Revenue (million) Forecast, by Application 2019 & 2032
- Table 82: China Industrial Membrane Elements Volume (K) Forecast, by Application 2019 & 2032
- Table 83: India Industrial Membrane Elements Revenue (million) Forecast, by Application 2019 & 2032
- Table 84: India Industrial Membrane Elements Volume (K) Forecast, by Application 2019 & 2032
- Table 85: Japan Industrial Membrane Elements Revenue (million) Forecast, by Application 2019 & 2032
- Table 86: Japan Industrial Membrane Elements Volume (K) Forecast, by Application 2019 & 2032
- Table 87: South Korea Industrial Membrane Elements Revenue (million) Forecast, by Application 2019 & 2032
- Table 88: South Korea Industrial Membrane Elements Volume (K) Forecast, by Application 2019 & 2032
- Table 89: ASEAN Industrial Membrane Elements Revenue (million) Forecast, by Application 2019 & 2032
- Table 90: ASEAN Industrial Membrane Elements Volume (K) Forecast, by Application 2019 & 2032
- Table 91: Oceania Industrial Membrane Elements Revenue (million) Forecast, by Application 2019 & 2032
- Table 92: Oceania Industrial Membrane Elements Volume (K) Forecast, by Application 2019 & 2032
- Table 93: Rest of Asia Pacific Industrial Membrane Elements Revenue (million) Forecast, by Application 2019 & 2032
- Table 94: Rest of Asia Pacific Industrial Membrane Elements Volume (K) Forecast, by Application 2019 & 2032
Frequently Asked Questions
1. What is the projected Compound Annual Growth Rate (CAGR) of the Industrial Membrane Elements?
The projected CAGR is approximately 6.3%.
2. Which companies are prominent players in the Industrial Membrane Elements?
Key companies in the market include DuPont, Toray, Nitto, SUEZ, LG Chem, MANN+HUMMEL, Hunan Keensen Technology, N-Tech Environmental Protection Science And Technology, Vontron Technology, Jozzon Membrane Technology, Suzhou Feymer Membrane Technology, UltraClean Membrane, Zhejiang E-MEM New Material Technology, Ningbo Rixin Hengli Technology, Hunan Ovay Technology, AROMEM PTE, Jiangsu Bangtec Environmental Sci-Tech, Jingqingyuan (Yangzhou) Water Treatment Equipment, Beijing OriginWater Separation Membrane Technology, HID Membrane.
3. What are the main segments of the Industrial Membrane Elements?
The market segments include Application, Type.
4. Can you provide details about the market size?
The market size is estimated to be USD 9279 million as of 2022.
5. What are some drivers contributing to market growth?
N/A
6. What are the notable trends driving market growth?
N/A
7. Are there any restraints impacting market growth?
N/A
8. Can you provide examples of recent developments in the market?
N/A
9. What pricing options are available for accessing the report?
Pricing options include single-user, multi-user, and enterprise licenses priced at USD 3950.00, USD 5925.00, and USD 7900.00 respectively.
10. Is the market size provided in terms of value or volume?
The market size is provided in terms of value, measured in million and volume, measured in K.
11. Are there any specific market keywords associated with the report?
Yes, the market keyword associated with the report is "Industrial Membrane Elements," which aids in identifying and referencing the specific market segment covered.
12. How do I determine which pricing option suits my needs best?
The pricing options vary based on user requirements and access needs. Individual users may opt for single-user licenses, while businesses requiring broader access may choose multi-user or enterprise licenses for cost-effective access to the report.
13. Are there any additional resources or data provided in the Industrial Membrane Elements report?
While the report offers comprehensive insights, it's advisable to review the specific contents or supplementary materials provided to ascertain if additional resources or data are available.
14. How can I stay updated on further developments or reports in the Industrial Membrane Elements?
To stay informed about further developments, trends, and reports in the Industrial Membrane Elements, consider subscribing to industry newsletters, following relevant companies and organizations, or regularly checking reputable industry news sources and publications.
Methodology
Step 1 - Identification of Relevant Samples Size from Population Database


Step 2 - Approaches for Defining Global Market Size (Value, Volume* & Price*)

Note*: In applicable scenarios
Step 3 - Data Sources
Primary Research
- Web Analytics
- Survey Reports
- Research Institute
- Latest Research Reports
- Opinion Leaders
Secondary Research
- Annual Reports
- White Paper
- Latest Press Release
- Industry Association
- Paid Database
- Investor Presentations

Step 4 - Data Triangulation
Involves using different sources of information in order to increase the validity of a study
These sources are likely to be stakeholders in a program - participants, other researchers, program staff, other community members, and so on.
Then we put all data in single framework & apply various statistical tools to find out the dynamic on the market.
During the analysis stage, feedback from the stakeholder groups would be compared to determine areas of agreement as well as areas of divergence
