

Key Insights
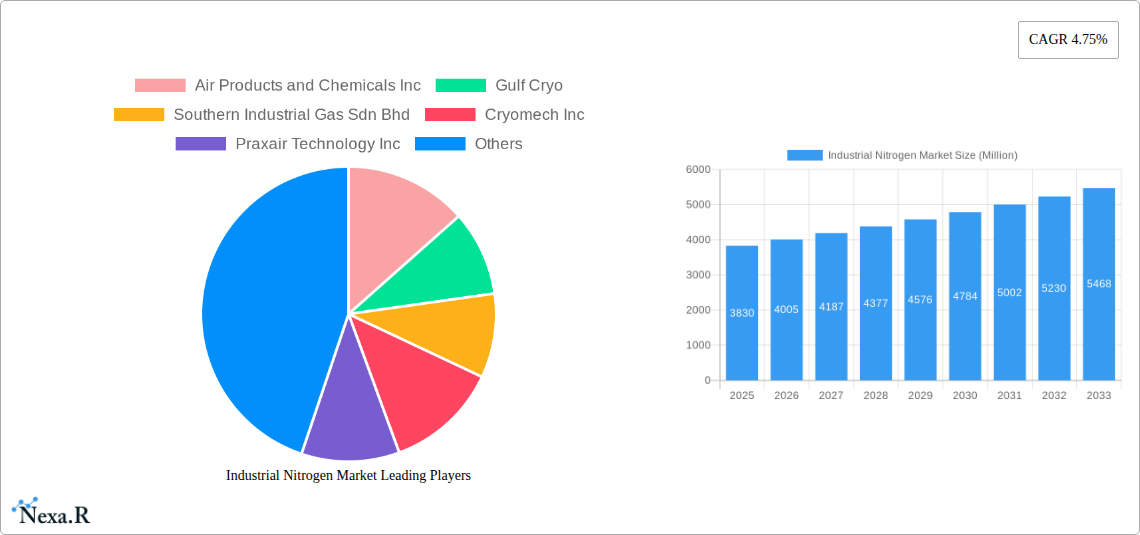
The industrial nitrogen market, valued at $3.83 billion in 2025, is projected to experience robust growth, driven by a Compound Annual Growth Rate (CAGR) of 4.75% from 2025 to 2033. This expansion is fueled by several key factors. The burgeoning chemical and pharmaceutical industries are significant consumers of nitrogen, utilizing it in various processes like ammonia production and inert atmosphere creation. Furthermore, the growing healthcare sector, particularly in cryogenic applications, is contributing significantly to market demand. The transportation industry's reliance on nitrogen for tire inflation and other applications further fuels market growth. Technological advancements in nitrogen generation and storage, including the development of more efficient and cost-effective cylinder and packaged gas solutions, are also positively impacting market dynamics. However, fluctuations in raw material prices and stringent environmental regulations pose potential challenges to consistent growth. The market is segmented by storage type (cylinder, packaged gas), function (coolant, refrigerant), and end-user industry (chemical & pharmaceutical, healthcare, transportation, others). Major players like Air Products and Chemicals Inc., Linde plc, and Air Liquide are shaping the competitive landscape through strategic partnerships, technological innovation, and geographical expansion. The Asia-Pacific region, particularly China and India, is expected to dominate market share due to rapid industrialization and increasing demand across various sectors.
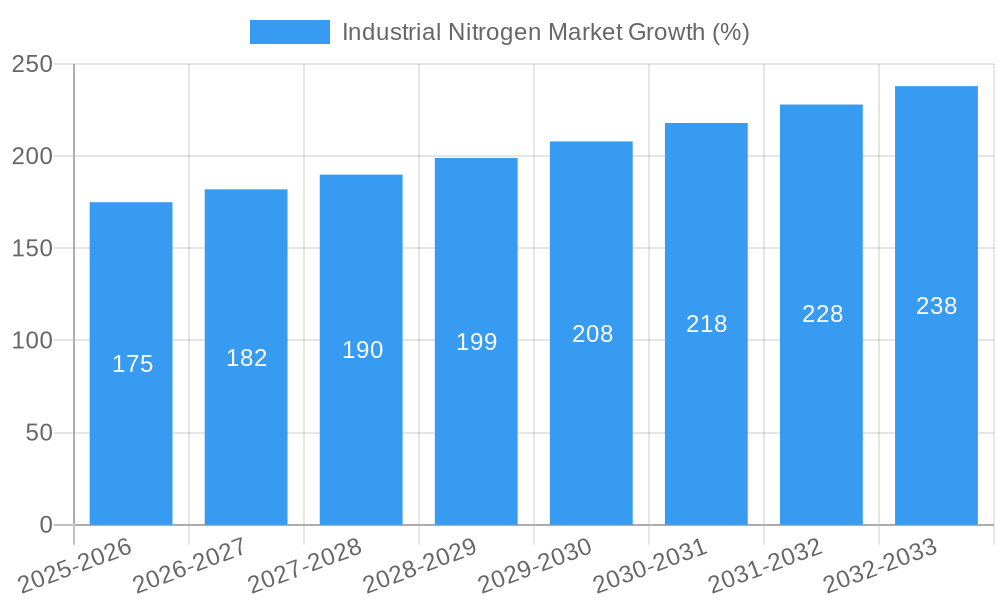
The forecast period (2025-2033) anticipates consistent growth, with the market size likely exceeding $5 billion by 2033. Regional variations in growth are expected, with North America and Europe maintaining steady expansion while the Asia-Pacific region displays potentially higher growth rates due to its rapidly developing industrial base. Future growth will depend on continued investment in industrial infrastructure, technological improvements in nitrogen production and delivery, and the adoption of sustainable practices within the industry. The competitive landscape is expected to remain dynamic, with mergers, acquisitions, and strategic alliances shaping the market structure in the years to come. Companies will need to focus on efficient operations, technological innovation, and adapting to evolving regulatory environments to maintain their market share.
Industrial Nitrogen Market Report: 2019-2033
This comprehensive report provides an in-depth analysis of the Industrial Nitrogen Market, encompassing market dynamics, growth trends, regional dominance, product landscape, key players, and future outlook. The report covers the period from 2019 to 2033, with 2025 as the base year and a forecast period spanning 2025-2033. The market is segmented by storage type (Cylinder, Packaged Gas), function (Coolant, Refrigerant), and end-user industry (Chemical & Pharmaceutical, Healthcare, Transportation, Other End-user Industries). This report is crucial for industry professionals, investors, and stakeholders seeking to understand the current market landscape and future growth potential of industrial nitrogen.
Industrial Nitrogen Market Dynamics & Structure
The industrial nitrogen market is characterized by moderate concentration, with key players like Air Products and Chemicals Inc, Linde plc, Air Liquide, and Messer Group holding significant market share. The market is driven by technological innovations in air separation technologies, leading to increased efficiency and reduced production costs. Stringent regulatory frameworks concerning environmental emissions influence production practices. Competitive substitutes, such as ammonia, exist, but nitrogen's unique properties maintain its dominant position in numerous applications. End-user demographics are shifting towards sectors with higher growth potential, such as healthcare and advanced manufacturing. M&A activity within the industry is moderate, with deals primarily focused on expanding geographic reach and enhancing production capacity.
- Market Concentration: Moderately concentrated, with top 5 players holding approximately xx% market share (2025).
- Technological Innovation: Focus on energy-efficient air separation units (ASUs) and cryogenic technologies.
- Regulatory Landscape: Stringent emission regulations driving investment in cleaner production methods.
- Competitive Substitutes: Limited substitutes due to nitrogen's unique properties; ammonia is a primary competitor in specific applications.
- M&A Activity: xx major mergers and acquisitions in the past 5 years, primarily focused on capacity expansion and geographic diversification.
Industrial Nitrogen Market Growth Trends & Insights
The global industrial nitrogen market is experiencing steady growth, driven by increasing demand across various end-use sectors. The market size, estimated at xx million units in 2025, is projected to reach xx million units by 2033, exhibiting a CAGR of xx% during the forecast period. Adoption rates are highest in established industrial sectors, while emerging applications are driving incremental growth. Technological disruptions, such as the development of advanced ASUs, are enhancing efficiency and reducing costs, further fueling market expansion. Consumer behavior shifts, driven by sustainability concerns, are increasingly influencing procurement decisions. The shift towards cleaner production technologies is also a significant driver.
Dominant Regions, Countries, or Segments in Industrial Nitrogen Market
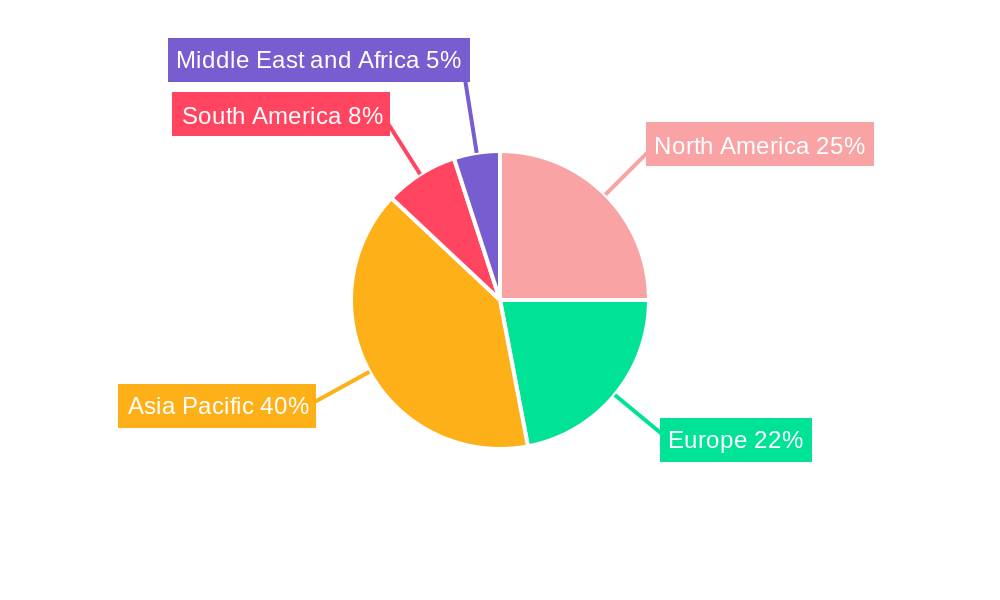
North America and Asia-Pacific are the leading regions in the industrial nitrogen market, driven by robust industrial activity and significant investments in healthcare and manufacturing infrastructure. Within these regions, the US and China are the dominant countries. The packaged gas segment holds a larger market share compared to the cylinder segment due to its cost-effectiveness for large-scale applications. The coolant function segment dominates, driven by its widespread use in various industrial processes. The chemical and pharmaceutical industry is the largest end-user segment, followed by healthcare.
- Key Drivers: Strong industrial growth in North America and Asia-Pacific, increasing healthcare infrastructure investment, and growing demand in emerging economies.
- Dominant Segments: Packaged gas storage type, coolant function, and the chemical and pharmaceutical end-user industry.
- Market Share: North America holds approximately xx% market share, while Asia-Pacific holds approximately xx%.
Industrial Nitrogen Market Product Landscape
Industrial nitrogen products are primarily differentiated by purity levels and delivery methods. Innovations focus on enhancing purity levels for specialized applications and improving the efficiency of delivery systems. Technological advancements encompass the development of more efficient and cost-effective air separation units (ASUs) and improved cryogenic storage and transportation technologies. Unique selling propositions include higher purity levels, customized delivery solutions, and reliable supply chains.
Key Drivers, Barriers & Challenges in Industrial Nitrogen Market
Key Drivers:
- Growing demand from the chemical, pharmaceutical, and food and beverage industries.
- Expanding healthcare sector driving demand for medical-grade nitrogen.
- Technological advancements leading to enhanced efficiency and reduced production costs.
Challenges and Restraints:
- Fluctuations in energy prices impacting production costs.
- Stringent environmental regulations requiring investments in emission control technologies.
- Intense competition among major players leading to price pressure.
Emerging Opportunities in Industrial Nitrogen Market
- Growing demand for nitrogen in emerging markets.
- Increasing adoption of nitrogen in new applications such as 3D printing and semiconductor manufacturing.
- Development of sustainable and environmentally friendly nitrogen production methods.
Growth Accelerators in the Industrial Nitrogen Market Industry
The industrial nitrogen market's long-term growth is fueled by several key accelerators. Technological advancements in air separation techniques, particularly those focused on energy efficiency, are significantly reducing production costs and expanding capacity. Strategic partnerships and mergers and acquisitions are consolidating market share and improving supply chain management. Expansion into new markets and the development of innovative applications, such as those in the advanced materials sector, are further accelerating growth.
Key Players Shaping the Industrial Nitrogen Market Market
- Air Products and Chemicals Inc
- Gulf Cryo
- Southern Industrial Gas Sdn Bhd
- Cryomech Inc
- Praxair Technology Inc (Linde plc)
- Linde plc
- TAIYO NIPPON SANSO CORPORATION
- MVS Engineering Pvt Ltd
- Messer Group
- Air Liquide
Notable Milestones in Industrial Nitrogen Market Sector
- April 2022: Linde plc expands production capacity by up to 50% to meet a long-term agreement with a major space launch firm in Florida. This signifies growing demand from the aerospace sector.
- February 2022: INOX Air Products opens a new air separation plant in Hosur, India, doubling liquid nitrogen production to meet rising healthcare and industrial demands. This demonstrates strong growth in the Indian market.
In-Depth Industrial Nitrogen Market Market Outlook
The future of the industrial nitrogen market appears promising, driven by consistent growth across various end-use sectors. Strategic investments in advanced technologies, coupled with expanding global infrastructure and rising consumer demand, are poised to propel the market toward significant expansion in the coming years. Strategic partnerships and focus on sustainability will be key to long-term success in this competitive market.
Industrial Nitrogen Market Segmentation
-
1. Storage Type
- 1.1. Cylinder
- 1.2. Packaged Gas
-
2. Function
- 2.1. Coolant
- 2.2. Refrigerant
-
3. End-user Industry
- 3.1. Chemical and Pharmaceutical
- 3.2. Healthcare
- 3.3. Transportation
- 3.4. Other End-user Industries
Industrial Nitrogen Market Segmentation By Geography
-
1. Asia Pacific
- 1.1. China
- 1.2. India
- 1.3. Japan
- 1.4. South Korea
- 1.5. Rest of Asia Pacific
-
2. North America
- 2.1. United States
- 2.2. Canada
- 2.3. Mexico
-
3. Europe
- 3.1. Germany
- 3.2. United Kingdom
- 3.3. Italy
- 3.4. France
- 3.5. Rest of Europe
-
4. South America
- 4.1. Brazil
- 4.2. Argentina
- 4.3. Rest of South America
-
5. Middle East and Africa
- 5.1. Saudi Arabia
- 5.2. South Africa
- 5.3. Rest of Middle East and Africa
Industrial Nitrogen Market REPORT HIGHLIGHTS
| Aspects | Details |
|---|---|
| Study Period | 2019-2033 |
| Base Year | 2024 |
| Estimated Year | 2025 |
| Forecast Period | 2025-2033 |
| Historical Period | 2019-2024 |
| Growth Rate | CAGR of 4.75% from 2019-2033 |
| Segmentation |
|
Table of Contents
- 1. Introduction
- 1.1. Research Scope
- 1.2. Market Segmentation
- 1.3. Research Methodology
- 1.4. Definitions and Assumptions
- 2. Executive Summary
- 2.1. Introduction
- 3. Market Dynamics
- 3.1. Introduction
- 3.2. Market Drivers
- 3.2.1. Increasing Demand from the Chemical and Pharmaceutical Industry; Growing Application in the Healthcare Industry; Other Drivers
- 3.3. Market Restrains
- 3.3.1. Regulatory Restrictions in Maintaining Liquid Nitrogen Plant; Other Restraints
- 3.4. Market Trends
- 3.4.1. Growing Demand from the Chemical and Pharmaceutical Industry
- 4. Market Factor Analysis
- 4.1. Porters Five Forces
- 4.2. Supply/Value Chain
- 4.3. PESTEL analysis
- 4.4. Market Entropy
- 4.5. Patent/Trademark Analysis
- 5. Global Industrial Nitrogen Market Analysis, Insights and Forecast, 2019-2031
- 5.1. Market Analysis, Insights and Forecast - by Storage Type
- 5.1.1. Cylinder
- 5.1.2. Packaged Gas
- 5.2. Market Analysis, Insights and Forecast - by Function
- 5.2.1. Coolant
- 5.2.2. Refrigerant
- 5.3. Market Analysis, Insights and Forecast - by End-user Industry
- 5.3.1. Chemical and Pharmaceutical
- 5.3.2. Healthcare
- 5.3.3. Transportation
- 5.3.4. Other End-user Industries
- 5.4. Market Analysis, Insights and Forecast - by Region
- 5.4.1. Asia Pacific
- 5.4.2. North America
- 5.4.3. Europe
- 5.4.4. South America
- 5.4.5. Middle East and Africa
- 5.1. Market Analysis, Insights and Forecast - by Storage Type
- 6. Asia Pacific Industrial Nitrogen Market Analysis, Insights and Forecast, 2019-2031
- 6.1. Market Analysis, Insights and Forecast - by Storage Type
- 6.1.1. Cylinder
- 6.1.2. Packaged Gas
- 6.2. Market Analysis, Insights and Forecast - by Function
- 6.2.1. Coolant
- 6.2.2. Refrigerant
- 6.3. Market Analysis, Insights and Forecast - by End-user Industry
- 6.3.1. Chemical and Pharmaceutical
- 6.3.2. Healthcare
- 6.3.3. Transportation
- 6.3.4. Other End-user Industries
- 6.1. Market Analysis, Insights and Forecast - by Storage Type
- 7. North America Industrial Nitrogen Market Analysis, Insights and Forecast, 2019-2031
- 7.1. Market Analysis, Insights and Forecast - by Storage Type
- 7.1.1. Cylinder
- 7.1.2. Packaged Gas
- 7.2. Market Analysis, Insights and Forecast - by Function
- 7.2.1. Coolant
- 7.2.2. Refrigerant
- 7.3. Market Analysis, Insights and Forecast - by End-user Industry
- 7.3.1. Chemical and Pharmaceutical
- 7.3.2. Healthcare
- 7.3.3. Transportation
- 7.3.4. Other End-user Industries
- 7.1. Market Analysis, Insights and Forecast - by Storage Type
- 8. Europe Industrial Nitrogen Market Analysis, Insights and Forecast, 2019-2031
- 8.1. Market Analysis, Insights and Forecast - by Storage Type
- 8.1.1. Cylinder
- 8.1.2. Packaged Gas
- 8.2. Market Analysis, Insights and Forecast - by Function
- 8.2.1. Coolant
- 8.2.2. Refrigerant
- 8.3. Market Analysis, Insights and Forecast - by End-user Industry
- 8.3.1. Chemical and Pharmaceutical
- 8.3.2. Healthcare
- 8.3.3. Transportation
- 8.3.4. Other End-user Industries
- 8.1. Market Analysis, Insights and Forecast - by Storage Type
- 9. South America Industrial Nitrogen Market Analysis, Insights and Forecast, 2019-2031
- 9.1. Market Analysis, Insights and Forecast - by Storage Type
- 9.1.1. Cylinder
- 9.1.2. Packaged Gas
- 9.2. Market Analysis, Insights and Forecast - by Function
- 9.2.1. Coolant
- 9.2.2. Refrigerant
- 9.3. Market Analysis, Insights and Forecast - by End-user Industry
- 9.3.1. Chemical and Pharmaceutical
- 9.3.2. Healthcare
- 9.3.3. Transportation
- 9.3.4. Other End-user Industries
- 9.1. Market Analysis, Insights and Forecast - by Storage Type
- 10. Middle East and Africa Industrial Nitrogen Market Analysis, Insights and Forecast, 2019-2031
- 10.1. Market Analysis, Insights and Forecast - by Storage Type
- 10.1.1. Cylinder
- 10.1.2. Packaged Gas
- 10.2. Market Analysis, Insights and Forecast - by Function
- 10.2.1. Coolant
- 10.2.2. Refrigerant
- 10.3. Market Analysis, Insights and Forecast - by End-user Industry
- 10.3.1. Chemical and Pharmaceutical
- 10.3.2. Healthcare
- 10.3.3. Transportation
- 10.3.4. Other End-user Industries
- 10.1. Market Analysis, Insights and Forecast - by Storage Type
- 11. Asia Pacific Industrial Nitrogen Market Analysis, Insights and Forecast, 2019-2031
- 11.1. Market Analysis, Insights and Forecast - By Country/Sub-region
- 11.1.1 China
- 11.1.2 India
- 11.1.3 Japan
- 11.1.4 South Korea
- 11.1.5 Rest of Asia Pacific
- 12. North America Industrial Nitrogen Market Analysis, Insights and Forecast, 2019-2031
- 12.1. Market Analysis, Insights and Forecast - By Country/Sub-region
- 12.1.1 United States
- 12.1.2 Canada
- 12.1.3 Mexico
- 13. Europe Industrial Nitrogen Market Analysis, Insights and Forecast, 2019-2031
- 13.1. Market Analysis, Insights and Forecast - By Country/Sub-region
- 13.1.1 Germany
- 13.1.2 United Kingdom
- 13.1.3 Italy
- 13.1.4 France
- 13.1.5 Rest of Europe
- 14. South America Industrial Nitrogen Market Analysis, Insights and Forecast, 2019-2031
- 14.1. Market Analysis, Insights and Forecast - By Country/Sub-region
- 14.1.1 Brazil
- 14.1.2 Argentina
- 14.1.3 Rest of South America
- 15. Middle East and Africa Industrial Nitrogen Market Analysis, Insights and Forecast, 2019-2031
- 15.1. Market Analysis, Insights and Forecast - By Country/Sub-region
- 15.1.1 Saudi Arabia
- 15.1.2 South Africa
- 15.1.3 Rest of Middle East and Africa
- 16. Competitive Analysis
- 16.1. Global Market Share Analysis 2024
- 16.2. Company Profiles
- 16.2.1 Air Products and Chemicals Inc
- 16.2.1.1. Overview
- 16.2.1.2. Products
- 16.2.1.3. SWOT Analysis
- 16.2.1.4. Recent Developments
- 16.2.1.5. Financials (Based on Availability)
- 16.2.2 Gulf Cryo
- 16.2.2.1. Overview
- 16.2.2.2. Products
- 16.2.2.3. SWOT Analysis
- 16.2.2.4. Recent Developments
- 16.2.2.5. Financials (Based on Availability)
- 16.2.3 Southern Industrial Gas Sdn Bhd
- 16.2.3.1. Overview
- 16.2.3.2. Products
- 16.2.3.3. SWOT Analysis
- 16.2.3.4. Recent Developments
- 16.2.3.5. Financials (Based on Availability)
- 16.2.4 Cryomech Inc
- 16.2.4.1. Overview
- 16.2.4.2. Products
- 16.2.4.3. SWOT Analysis
- 16.2.4.4. Recent Developments
- 16.2.4.5. Financials (Based on Availability)
- 16.2.5 Praxair Technology Inc
- 16.2.5.1. Overview
- 16.2.5.2. Products
- 16.2.5.3. SWOT Analysis
- 16.2.5.4. Recent Developments
- 16.2.5.5. Financials (Based on Availability)
- 16.2.6 Linde plc
- 16.2.6.1. Overview
- 16.2.6.2. Products
- 16.2.6.3. SWOT Analysis
- 16.2.6.4. Recent Developments
- 16.2.6.5. Financials (Based on Availability)
- 16.2.7 TAIYO NIPPON SANSO CORPORATION*List Not Exhaustive
- 16.2.7.1. Overview
- 16.2.7.2. Products
- 16.2.7.3. SWOT Analysis
- 16.2.7.4. Recent Developments
- 16.2.7.5. Financials (Based on Availability)
- 16.2.8 MVS Engineering Pvt Ltd
- 16.2.8.1. Overview
- 16.2.8.2. Products
- 16.2.8.3. SWOT Analysis
- 16.2.8.4. Recent Developments
- 16.2.8.5. Financials (Based on Availability)
- 16.2.9 Messer Group
- 16.2.9.1. Overview
- 16.2.9.2. Products
- 16.2.9.3. SWOT Analysis
- 16.2.9.4. Recent Developments
- 16.2.9.5. Financials (Based on Availability)
- 16.2.10 Air Liquide
- 16.2.10.1. Overview
- 16.2.10.2. Products
- 16.2.10.3. SWOT Analysis
- 16.2.10.4. Recent Developments
- 16.2.10.5. Financials (Based on Availability)
- 16.2.1 Air Products and Chemicals Inc
List of Figures
- Figure 1: Global Industrial Nitrogen Market Revenue Breakdown (Million, %) by Region 2024 & 2032
- Figure 2: Global Industrial Nitrogen Market Volume Breakdown (K Tons, %) by Region 2024 & 2032
- Figure 3: Asia Pacific Industrial Nitrogen Market Revenue (Million), by Country 2024 & 2032
- Figure 4: Asia Pacific Industrial Nitrogen Market Volume (K Tons), by Country 2024 & 2032
- Figure 5: Asia Pacific Industrial Nitrogen Market Revenue Share (%), by Country 2024 & 2032
- Figure 6: Asia Pacific Industrial Nitrogen Market Volume Share (%), by Country 2024 & 2032
- Figure 7: North America Industrial Nitrogen Market Revenue (Million), by Country 2024 & 2032
- Figure 8: North America Industrial Nitrogen Market Volume (K Tons), by Country 2024 & 2032
- Figure 9: North America Industrial Nitrogen Market Revenue Share (%), by Country 2024 & 2032
- Figure 10: North America Industrial Nitrogen Market Volume Share (%), by Country 2024 & 2032
- Figure 11: Europe Industrial Nitrogen Market Revenue (Million), by Country 2024 & 2032
- Figure 12: Europe Industrial Nitrogen Market Volume (K Tons), by Country 2024 & 2032
- Figure 13: Europe Industrial Nitrogen Market Revenue Share (%), by Country 2024 & 2032
- Figure 14: Europe Industrial Nitrogen Market Volume Share (%), by Country 2024 & 2032
- Figure 15: South America Industrial Nitrogen Market Revenue (Million), by Country 2024 & 2032
- Figure 16: South America Industrial Nitrogen Market Volume (K Tons), by Country 2024 & 2032
- Figure 17: South America Industrial Nitrogen Market Revenue Share (%), by Country 2024 & 2032
- Figure 18: South America Industrial Nitrogen Market Volume Share (%), by Country 2024 & 2032
- Figure 19: Middle East and Africa Industrial Nitrogen Market Revenue (Million), by Country 2024 & 2032
- Figure 20: Middle East and Africa Industrial Nitrogen Market Volume (K Tons), by Country 2024 & 2032
- Figure 21: Middle East and Africa Industrial Nitrogen Market Revenue Share (%), by Country 2024 & 2032
- Figure 22: Middle East and Africa Industrial Nitrogen Market Volume Share (%), by Country 2024 & 2032
- Figure 23: Asia Pacific Industrial Nitrogen Market Revenue (Million), by Storage Type 2024 & 2032
- Figure 24: Asia Pacific Industrial Nitrogen Market Volume (K Tons), by Storage Type 2024 & 2032
- Figure 25: Asia Pacific Industrial Nitrogen Market Revenue Share (%), by Storage Type 2024 & 2032
- Figure 26: Asia Pacific Industrial Nitrogen Market Volume Share (%), by Storage Type 2024 & 2032
- Figure 27: Asia Pacific Industrial Nitrogen Market Revenue (Million), by Function 2024 & 2032
- Figure 28: Asia Pacific Industrial Nitrogen Market Volume (K Tons), by Function 2024 & 2032
- Figure 29: Asia Pacific Industrial Nitrogen Market Revenue Share (%), by Function 2024 & 2032
- Figure 30: Asia Pacific Industrial Nitrogen Market Volume Share (%), by Function 2024 & 2032
- Figure 31: Asia Pacific Industrial Nitrogen Market Revenue (Million), by End-user Industry 2024 & 2032
- Figure 32: Asia Pacific Industrial Nitrogen Market Volume (K Tons), by End-user Industry 2024 & 2032
- Figure 33: Asia Pacific Industrial Nitrogen Market Revenue Share (%), by End-user Industry 2024 & 2032
- Figure 34: Asia Pacific Industrial Nitrogen Market Volume Share (%), by End-user Industry 2024 & 2032
- Figure 35: Asia Pacific Industrial Nitrogen Market Revenue (Million), by Country 2024 & 2032
- Figure 36: Asia Pacific Industrial Nitrogen Market Volume (K Tons), by Country 2024 & 2032
- Figure 37: Asia Pacific Industrial Nitrogen Market Revenue Share (%), by Country 2024 & 2032
- Figure 38: Asia Pacific Industrial Nitrogen Market Volume Share (%), by Country 2024 & 2032
- Figure 39: North America Industrial Nitrogen Market Revenue (Million), by Storage Type 2024 & 2032
- Figure 40: North America Industrial Nitrogen Market Volume (K Tons), by Storage Type 2024 & 2032
- Figure 41: North America Industrial Nitrogen Market Revenue Share (%), by Storage Type 2024 & 2032
- Figure 42: North America Industrial Nitrogen Market Volume Share (%), by Storage Type 2024 & 2032
- Figure 43: North America Industrial Nitrogen Market Revenue (Million), by Function 2024 & 2032
- Figure 44: North America Industrial Nitrogen Market Volume (K Tons), by Function 2024 & 2032
- Figure 45: North America Industrial Nitrogen Market Revenue Share (%), by Function 2024 & 2032
- Figure 46: North America Industrial Nitrogen Market Volume Share (%), by Function 2024 & 2032
- Figure 47: North America Industrial Nitrogen Market Revenue (Million), by End-user Industry 2024 & 2032
- Figure 48: North America Industrial Nitrogen Market Volume (K Tons), by End-user Industry 2024 & 2032
- Figure 49: North America Industrial Nitrogen Market Revenue Share (%), by End-user Industry 2024 & 2032
- Figure 50: North America Industrial Nitrogen Market Volume Share (%), by End-user Industry 2024 & 2032
- Figure 51: North America Industrial Nitrogen Market Revenue (Million), by Country 2024 & 2032
- Figure 52: North America Industrial Nitrogen Market Volume (K Tons), by Country 2024 & 2032
- Figure 53: North America Industrial Nitrogen Market Revenue Share (%), by Country 2024 & 2032
- Figure 54: North America Industrial Nitrogen Market Volume Share (%), by Country 2024 & 2032
- Figure 55: Europe Industrial Nitrogen Market Revenue (Million), by Storage Type 2024 & 2032
- Figure 56: Europe Industrial Nitrogen Market Volume (K Tons), by Storage Type 2024 & 2032
- Figure 57: Europe Industrial Nitrogen Market Revenue Share (%), by Storage Type 2024 & 2032
- Figure 58: Europe Industrial Nitrogen Market Volume Share (%), by Storage Type 2024 & 2032
- Figure 59: Europe Industrial Nitrogen Market Revenue (Million), by Function 2024 & 2032
- Figure 60: Europe Industrial Nitrogen Market Volume (K Tons), by Function 2024 & 2032
- Figure 61: Europe Industrial Nitrogen Market Revenue Share (%), by Function 2024 & 2032
- Figure 62: Europe Industrial Nitrogen Market Volume Share (%), by Function 2024 & 2032
- Figure 63: Europe Industrial Nitrogen Market Revenue (Million), by End-user Industry 2024 & 2032
- Figure 64: Europe Industrial Nitrogen Market Volume (K Tons), by End-user Industry 2024 & 2032
- Figure 65: Europe Industrial Nitrogen Market Revenue Share (%), by End-user Industry 2024 & 2032
- Figure 66: Europe Industrial Nitrogen Market Volume Share (%), by End-user Industry 2024 & 2032
- Figure 67: Europe Industrial Nitrogen Market Revenue (Million), by Country 2024 & 2032
- Figure 68: Europe Industrial Nitrogen Market Volume (K Tons), by Country 2024 & 2032
- Figure 69: Europe Industrial Nitrogen Market Revenue Share (%), by Country 2024 & 2032
- Figure 70: Europe Industrial Nitrogen Market Volume Share (%), by Country 2024 & 2032
- Figure 71: South America Industrial Nitrogen Market Revenue (Million), by Storage Type 2024 & 2032
- Figure 72: South America Industrial Nitrogen Market Volume (K Tons), by Storage Type 2024 & 2032
- Figure 73: South America Industrial Nitrogen Market Revenue Share (%), by Storage Type 2024 & 2032
- Figure 74: South America Industrial Nitrogen Market Volume Share (%), by Storage Type 2024 & 2032
- Figure 75: South America Industrial Nitrogen Market Revenue (Million), by Function 2024 & 2032
- Figure 76: South America Industrial Nitrogen Market Volume (K Tons), by Function 2024 & 2032
- Figure 77: South America Industrial Nitrogen Market Revenue Share (%), by Function 2024 & 2032
- Figure 78: South America Industrial Nitrogen Market Volume Share (%), by Function 2024 & 2032
- Figure 79: South America Industrial Nitrogen Market Revenue (Million), by End-user Industry 2024 & 2032
- Figure 80: South America Industrial Nitrogen Market Volume (K Tons), by End-user Industry 2024 & 2032
- Figure 81: South America Industrial Nitrogen Market Revenue Share (%), by End-user Industry 2024 & 2032
- Figure 82: South America Industrial Nitrogen Market Volume Share (%), by End-user Industry 2024 & 2032
- Figure 83: South America Industrial Nitrogen Market Revenue (Million), by Country 2024 & 2032
- Figure 84: South America Industrial Nitrogen Market Volume (K Tons), by Country 2024 & 2032
- Figure 85: South America Industrial Nitrogen Market Revenue Share (%), by Country 2024 & 2032
- Figure 86: South America Industrial Nitrogen Market Volume Share (%), by Country 2024 & 2032
- Figure 87: Middle East and Africa Industrial Nitrogen Market Revenue (Million), by Storage Type 2024 & 2032
- Figure 88: Middle East and Africa Industrial Nitrogen Market Volume (K Tons), by Storage Type 2024 & 2032
- Figure 89: Middle East and Africa Industrial Nitrogen Market Revenue Share (%), by Storage Type 2024 & 2032
- Figure 90: Middle East and Africa Industrial Nitrogen Market Volume Share (%), by Storage Type 2024 & 2032
- Figure 91: Middle East and Africa Industrial Nitrogen Market Revenue (Million), by Function 2024 & 2032
- Figure 92: Middle East and Africa Industrial Nitrogen Market Volume (K Tons), by Function 2024 & 2032
- Figure 93: Middle East and Africa Industrial Nitrogen Market Revenue Share (%), by Function 2024 & 2032
- Figure 94: Middle East and Africa Industrial Nitrogen Market Volume Share (%), by Function 2024 & 2032
- Figure 95: Middle East and Africa Industrial Nitrogen Market Revenue (Million), by End-user Industry 2024 & 2032
- Figure 96: Middle East and Africa Industrial Nitrogen Market Volume (K Tons), by End-user Industry 2024 & 2032
- Figure 97: Middle East and Africa Industrial Nitrogen Market Revenue Share (%), by End-user Industry 2024 & 2032
- Figure 98: Middle East and Africa Industrial Nitrogen Market Volume Share (%), by End-user Industry 2024 & 2032
- Figure 99: Middle East and Africa Industrial Nitrogen Market Revenue (Million), by Country 2024 & 2032
- Figure 100: Middle East and Africa Industrial Nitrogen Market Volume (K Tons), by Country 2024 & 2032
- Figure 101: Middle East and Africa Industrial Nitrogen Market Revenue Share (%), by Country 2024 & 2032
- Figure 102: Middle East and Africa Industrial Nitrogen Market Volume Share (%), by Country 2024 & 2032
List of Tables
- Table 1: Global Industrial Nitrogen Market Revenue Million Forecast, by Region 2019 & 2032
- Table 2: Global Industrial Nitrogen Market Volume K Tons Forecast, by Region 2019 & 2032
- Table 3: Global Industrial Nitrogen Market Revenue Million Forecast, by Storage Type 2019 & 2032
- Table 4: Global Industrial Nitrogen Market Volume K Tons Forecast, by Storage Type 2019 & 2032
- Table 5: Global Industrial Nitrogen Market Revenue Million Forecast, by Function 2019 & 2032
- Table 6: Global Industrial Nitrogen Market Volume K Tons Forecast, by Function 2019 & 2032
- Table 7: Global Industrial Nitrogen Market Revenue Million Forecast, by End-user Industry 2019 & 2032
- Table 8: Global Industrial Nitrogen Market Volume K Tons Forecast, by End-user Industry 2019 & 2032
- Table 9: Global Industrial Nitrogen Market Revenue Million Forecast, by Region 2019 & 2032
- Table 10: Global Industrial Nitrogen Market Volume K Tons Forecast, by Region 2019 & 2032
- Table 11: Global Industrial Nitrogen Market Revenue Million Forecast, by Country 2019 & 2032
- Table 12: Global Industrial Nitrogen Market Volume K Tons Forecast, by Country 2019 & 2032
- Table 13: China Industrial Nitrogen Market Revenue (Million) Forecast, by Application 2019 & 2032
- Table 14: China Industrial Nitrogen Market Volume (K Tons) Forecast, by Application 2019 & 2032
- Table 15: India Industrial Nitrogen Market Revenue (Million) Forecast, by Application 2019 & 2032
- Table 16: India Industrial Nitrogen Market Volume (K Tons) Forecast, by Application 2019 & 2032
- Table 17: Japan Industrial Nitrogen Market Revenue (Million) Forecast, by Application 2019 & 2032
- Table 18: Japan Industrial Nitrogen Market Volume (K Tons) Forecast, by Application 2019 & 2032
- Table 19: South Korea Industrial Nitrogen Market Revenue (Million) Forecast, by Application 2019 & 2032
- Table 20: South Korea Industrial Nitrogen Market Volume (K Tons) Forecast, by Application 2019 & 2032
- Table 21: Rest of Asia Pacific Industrial Nitrogen Market Revenue (Million) Forecast, by Application 2019 & 2032
- Table 22: Rest of Asia Pacific Industrial Nitrogen Market Volume (K Tons) Forecast, by Application 2019 & 2032
- Table 23: Global Industrial Nitrogen Market Revenue Million Forecast, by Country 2019 & 2032
- Table 24: Global Industrial Nitrogen Market Volume K Tons Forecast, by Country 2019 & 2032
- Table 25: United States Industrial Nitrogen Market Revenue (Million) Forecast, by Application 2019 & 2032
- Table 26: United States Industrial Nitrogen Market Volume (K Tons) Forecast, by Application 2019 & 2032
- Table 27: Canada Industrial Nitrogen Market Revenue (Million) Forecast, by Application 2019 & 2032
- Table 28: Canada Industrial Nitrogen Market Volume (K Tons) Forecast, by Application 2019 & 2032
- Table 29: Mexico Industrial Nitrogen Market Revenue (Million) Forecast, by Application 2019 & 2032
- Table 30: Mexico Industrial Nitrogen Market Volume (K Tons) Forecast, by Application 2019 & 2032
- Table 31: Global Industrial Nitrogen Market Revenue Million Forecast, by Country 2019 & 2032
- Table 32: Global Industrial Nitrogen Market Volume K Tons Forecast, by Country 2019 & 2032
- Table 33: Germany Industrial Nitrogen Market Revenue (Million) Forecast, by Application 2019 & 2032
- Table 34: Germany Industrial Nitrogen Market Volume (K Tons) Forecast, by Application 2019 & 2032
- Table 35: United Kingdom Industrial Nitrogen Market Revenue (Million) Forecast, by Application 2019 & 2032
- Table 36: United Kingdom Industrial Nitrogen Market Volume (K Tons) Forecast, by Application 2019 & 2032
- Table 37: Italy Industrial Nitrogen Market Revenue (Million) Forecast, by Application 2019 & 2032
- Table 38: Italy Industrial Nitrogen Market Volume (K Tons) Forecast, by Application 2019 & 2032
- Table 39: France Industrial Nitrogen Market Revenue (Million) Forecast, by Application 2019 & 2032
- Table 40: France Industrial Nitrogen Market Volume (K Tons) Forecast, by Application 2019 & 2032
- Table 41: Rest of Europe Industrial Nitrogen Market Revenue (Million) Forecast, by Application 2019 & 2032
- Table 42: Rest of Europe Industrial Nitrogen Market Volume (K Tons) Forecast, by Application 2019 & 2032
- Table 43: Global Industrial Nitrogen Market Revenue Million Forecast, by Country 2019 & 2032
- Table 44: Global Industrial Nitrogen Market Volume K Tons Forecast, by Country 2019 & 2032
- Table 45: Brazil Industrial Nitrogen Market Revenue (Million) Forecast, by Application 2019 & 2032
- Table 46: Brazil Industrial Nitrogen Market Volume (K Tons) Forecast, by Application 2019 & 2032
- Table 47: Argentina Industrial Nitrogen Market Revenue (Million) Forecast, by Application 2019 & 2032
- Table 48: Argentina Industrial Nitrogen Market Volume (K Tons) Forecast, by Application 2019 & 2032
- Table 49: Rest of South America Industrial Nitrogen Market Revenue (Million) Forecast, by Application 2019 & 2032
- Table 50: Rest of South America Industrial Nitrogen Market Volume (K Tons) Forecast, by Application 2019 & 2032
- Table 51: Global Industrial Nitrogen Market Revenue Million Forecast, by Country 2019 & 2032
- Table 52: Global Industrial Nitrogen Market Volume K Tons Forecast, by Country 2019 & 2032
- Table 53: Saudi Arabia Industrial Nitrogen Market Revenue (Million) Forecast, by Application 2019 & 2032
- Table 54: Saudi Arabia Industrial Nitrogen Market Volume (K Tons) Forecast, by Application 2019 & 2032
- Table 55: South Africa Industrial Nitrogen Market Revenue (Million) Forecast, by Application 2019 & 2032
- Table 56: South Africa Industrial Nitrogen Market Volume (K Tons) Forecast, by Application 2019 & 2032
- Table 57: Rest of Middle East and Africa Industrial Nitrogen Market Revenue (Million) Forecast, by Application 2019 & 2032
- Table 58: Rest of Middle East and Africa Industrial Nitrogen Market Volume (K Tons) Forecast, by Application 2019 & 2032
- Table 59: Global Industrial Nitrogen Market Revenue Million Forecast, by Storage Type 2019 & 2032
- Table 60: Global Industrial Nitrogen Market Volume K Tons Forecast, by Storage Type 2019 & 2032
- Table 61: Global Industrial Nitrogen Market Revenue Million Forecast, by Function 2019 & 2032
- Table 62: Global Industrial Nitrogen Market Volume K Tons Forecast, by Function 2019 & 2032
- Table 63: Global Industrial Nitrogen Market Revenue Million Forecast, by End-user Industry 2019 & 2032
- Table 64: Global Industrial Nitrogen Market Volume K Tons Forecast, by End-user Industry 2019 & 2032
- Table 65: Global Industrial Nitrogen Market Revenue Million Forecast, by Country 2019 & 2032
- Table 66: Global Industrial Nitrogen Market Volume K Tons Forecast, by Country 2019 & 2032
- Table 67: China Industrial Nitrogen Market Revenue (Million) Forecast, by Application 2019 & 2032
- Table 68: China Industrial Nitrogen Market Volume (K Tons) Forecast, by Application 2019 & 2032
- Table 69: India Industrial Nitrogen Market Revenue (Million) Forecast, by Application 2019 & 2032
- Table 70: India Industrial Nitrogen Market Volume (K Tons) Forecast, by Application 2019 & 2032
- Table 71: Japan Industrial Nitrogen Market Revenue (Million) Forecast, by Application 2019 & 2032
- Table 72: Japan Industrial Nitrogen Market Volume (K Tons) Forecast, by Application 2019 & 2032
- Table 73: South Korea Industrial Nitrogen Market Revenue (Million) Forecast, by Application 2019 & 2032
- Table 74: South Korea Industrial Nitrogen Market Volume (K Tons) Forecast, by Application 2019 & 2032
- Table 75: Rest of Asia Pacific Industrial Nitrogen Market Revenue (Million) Forecast, by Application 2019 & 2032
- Table 76: Rest of Asia Pacific Industrial Nitrogen Market Volume (K Tons) Forecast, by Application 2019 & 2032
- Table 77: Global Industrial Nitrogen Market Revenue Million Forecast, by Storage Type 2019 & 2032
- Table 78: Global Industrial Nitrogen Market Volume K Tons Forecast, by Storage Type 2019 & 2032
- Table 79: Global Industrial Nitrogen Market Revenue Million Forecast, by Function 2019 & 2032
- Table 80: Global Industrial Nitrogen Market Volume K Tons Forecast, by Function 2019 & 2032
- Table 81: Global Industrial Nitrogen Market Revenue Million Forecast, by End-user Industry 2019 & 2032
- Table 82: Global Industrial Nitrogen Market Volume K Tons Forecast, by End-user Industry 2019 & 2032
- Table 83: Global Industrial Nitrogen Market Revenue Million Forecast, by Country 2019 & 2032
- Table 84: Global Industrial Nitrogen Market Volume K Tons Forecast, by Country 2019 & 2032
- Table 85: United States Industrial Nitrogen Market Revenue (Million) Forecast, by Application 2019 & 2032
- Table 86: United States Industrial Nitrogen Market Volume (K Tons) Forecast, by Application 2019 & 2032
- Table 87: Canada Industrial Nitrogen Market Revenue (Million) Forecast, by Application 2019 & 2032
- Table 88: Canada Industrial Nitrogen Market Volume (K Tons) Forecast, by Application 2019 & 2032
- Table 89: Mexico Industrial Nitrogen Market Revenue (Million) Forecast, by Application 2019 & 2032
- Table 90: Mexico Industrial Nitrogen Market Volume (K Tons) Forecast, by Application 2019 & 2032
- Table 91: Global Industrial Nitrogen Market Revenue Million Forecast, by Storage Type 2019 & 2032
- Table 92: Global Industrial Nitrogen Market Volume K Tons Forecast, by Storage Type 2019 & 2032
- Table 93: Global Industrial Nitrogen Market Revenue Million Forecast, by Function 2019 & 2032
- Table 94: Global Industrial Nitrogen Market Volume K Tons Forecast, by Function 2019 & 2032
- Table 95: Global Industrial Nitrogen Market Revenue Million Forecast, by End-user Industry 2019 & 2032
- Table 96: Global Industrial Nitrogen Market Volume K Tons Forecast, by End-user Industry 2019 & 2032
- Table 97: Global Industrial Nitrogen Market Revenue Million Forecast, by Country 2019 & 2032
- Table 98: Global Industrial Nitrogen Market Volume K Tons Forecast, by Country 2019 & 2032
- Table 99: Germany Industrial Nitrogen Market Revenue (Million) Forecast, by Application 2019 & 2032
- Table 100: Germany Industrial Nitrogen Market Volume (K Tons) Forecast, by Application 2019 & 2032
- Table 101: United Kingdom Industrial Nitrogen Market Revenue (Million) Forecast, by Application 2019 & 2032
- Table 102: United Kingdom Industrial Nitrogen Market Volume (K Tons) Forecast, by Application 2019 & 2032
- Table 103: Italy Industrial Nitrogen Market Revenue (Million) Forecast, by Application 2019 & 2032
- Table 104: Italy Industrial Nitrogen Market Volume (K Tons) Forecast, by Application 2019 & 2032
- Table 105: France Industrial Nitrogen Market Revenue (Million) Forecast, by Application 2019 & 2032
- Table 106: France Industrial Nitrogen Market Volume (K Tons) Forecast, by Application 2019 & 2032
- Table 107: Rest of Europe Industrial Nitrogen Market Revenue (Million) Forecast, by Application 2019 & 2032
- Table 108: Rest of Europe Industrial Nitrogen Market Volume (K Tons) Forecast, by Application 2019 & 2032
- Table 109: Global Industrial Nitrogen Market Revenue Million Forecast, by Storage Type 2019 & 2032
- Table 110: Global Industrial Nitrogen Market Volume K Tons Forecast, by Storage Type 2019 & 2032
- Table 111: Global Industrial Nitrogen Market Revenue Million Forecast, by Function 2019 & 2032
- Table 112: Global Industrial Nitrogen Market Volume K Tons Forecast, by Function 2019 & 2032
- Table 113: Global Industrial Nitrogen Market Revenue Million Forecast, by End-user Industry 2019 & 2032
- Table 114: Global Industrial Nitrogen Market Volume K Tons Forecast, by End-user Industry 2019 & 2032
- Table 115: Global Industrial Nitrogen Market Revenue Million Forecast, by Country 2019 & 2032
- Table 116: Global Industrial Nitrogen Market Volume K Tons Forecast, by Country 2019 & 2032
- Table 117: Brazil Industrial Nitrogen Market Revenue (Million) Forecast, by Application 2019 & 2032
- Table 118: Brazil Industrial Nitrogen Market Volume (K Tons) Forecast, by Application 2019 & 2032
- Table 119: Argentina Industrial Nitrogen Market Revenue (Million) Forecast, by Application 2019 & 2032
- Table 120: Argentina Industrial Nitrogen Market Volume (K Tons) Forecast, by Application 2019 & 2032
- Table 121: Rest of South America Industrial Nitrogen Market Revenue (Million) Forecast, by Application 2019 & 2032
- Table 122: Rest of South America Industrial Nitrogen Market Volume (K Tons) Forecast, by Application 2019 & 2032
- Table 123: Global Industrial Nitrogen Market Revenue Million Forecast, by Storage Type 2019 & 2032
- Table 124: Global Industrial Nitrogen Market Volume K Tons Forecast, by Storage Type 2019 & 2032
- Table 125: Global Industrial Nitrogen Market Revenue Million Forecast, by Function 2019 & 2032
- Table 126: Global Industrial Nitrogen Market Volume K Tons Forecast, by Function 2019 & 2032
- Table 127: Global Industrial Nitrogen Market Revenue Million Forecast, by End-user Industry 2019 & 2032
- Table 128: Global Industrial Nitrogen Market Volume K Tons Forecast, by End-user Industry 2019 & 2032
- Table 129: Global Industrial Nitrogen Market Revenue Million Forecast, by Country 2019 & 2032
- Table 130: Global Industrial Nitrogen Market Volume K Tons Forecast, by Country 2019 & 2032
- Table 131: Saudi Arabia Industrial Nitrogen Market Revenue (Million) Forecast, by Application 2019 & 2032
- Table 132: Saudi Arabia Industrial Nitrogen Market Volume (K Tons) Forecast, by Application 2019 & 2032
- Table 133: South Africa Industrial Nitrogen Market Revenue (Million) Forecast, by Application 2019 & 2032
- Table 134: South Africa Industrial Nitrogen Market Volume (K Tons) Forecast, by Application 2019 & 2032
- Table 135: Rest of Middle East and Africa Industrial Nitrogen Market Revenue (Million) Forecast, by Application 2019 & 2032
- Table 136: Rest of Middle East and Africa Industrial Nitrogen Market Volume (K Tons) Forecast, by Application 2019 & 2032
Frequently Asked Questions
1. What is the projected Compound Annual Growth Rate (CAGR) of the Industrial Nitrogen Market?
The projected CAGR is approximately 4.75%.
2. Which companies are prominent players in the Industrial Nitrogen Market?
Key companies in the market include Air Products and Chemicals Inc, Gulf Cryo, Southern Industrial Gas Sdn Bhd, Cryomech Inc, Praxair Technology Inc, Linde plc, TAIYO NIPPON SANSO CORPORATION*List Not Exhaustive, MVS Engineering Pvt Ltd, Messer Group, Air Liquide.
3. What are the main segments of the Industrial Nitrogen Market?
The market segments include Storage Type, Function, End-user Industry.
4. Can you provide details about the market size?
The market size is estimated to be USD 3830 Million as of 2022.
5. What are some drivers contributing to market growth?
Increasing Demand from the Chemical and Pharmaceutical Industry; Growing Application in the Healthcare Industry; Other Drivers.
6. What are the notable trends driving market growth?
Growing Demand from the Chemical and Pharmaceutical Industry.
7. Are there any restraints impacting market growth?
Regulatory Restrictions in Maintaining Liquid Nitrogen Plant; Other Restraints.
8. Can you provide examples of recent developments in the market?
April 2022: Linde plc signed another long-term arrangement to supply bulk industrial gases with a major space launch firm in Florida. Linde will deliver liquid nitrogen to the client from its air separation facility in Mims, Florida, expanding to increase production capacity by up to 50%. The extra capacity, expected to begin operations in 2023, will fulfill the new agreement's demands and increase demand from clients in the aerospace, healthcare, manufacturing, food processing, and water treatment end sectors.
9. What pricing options are available for accessing the report?
Pricing options include single-user, multi-user, and enterprise licenses priced at USD 4750, USD 5250, and USD 8750 respectively.
10. Is the market size provided in terms of value or volume?
The market size is provided in terms of value, measured in Million and volume, measured in K Tons.
11. Are there any specific market keywords associated with the report?
Yes, the market keyword associated with the report is "Industrial Nitrogen Market," which aids in identifying and referencing the specific market segment covered.
12. How do I determine which pricing option suits my needs best?
The pricing options vary based on user requirements and access needs. Individual users may opt for single-user licenses, while businesses requiring broader access may choose multi-user or enterprise licenses for cost-effective access to the report.
13. Are there any additional resources or data provided in the Industrial Nitrogen Market report?
While the report offers comprehensive insights, it's advisable to review the specific contents or supplementary materials provided to ascertain if additional resources or data are available.
14. How can I stay updated on further developments or reports in the Industrial Nitrogen Market?
To stay informed about further developments, trends, and reports in the Industrial Nitrogen Market, consider subscribing to industry newsletters, following relevant companies and organizations, or regularly checking reputable industry news sources and publications.
Methodology
Step 1 - Identification of Relevant Samples Size from Population Database


Step 2 - Approaches for Defining Global Market Size (Value, Volume* & Price*)

Note*: In applicable scenarios
Step 3 - Data Sources
Primary Research
- Web Analytics
- Survey Reports
- Research Institute
- Latest Research Reports
- Opinion Leaders
Secondary Research
- Annual Reports
- White Paper
- Latest Press Release
- Industry Association
- Paid Database
- Investor Presentations

Step 4 - Data Triangulation
Involves using different sources of information in order to increase the validity of a study
These sources are likely to be stakeholders in a program - participants, other researchers, program staff, other community members, and so on.
Then we put all data in single framework & apply various statistical tools to find out the dynamic on the market.
During the analysis stage, feedback from the stakeholder groups would be compared to determine areas of agreement as well as areas of divergence
