

Key Insights
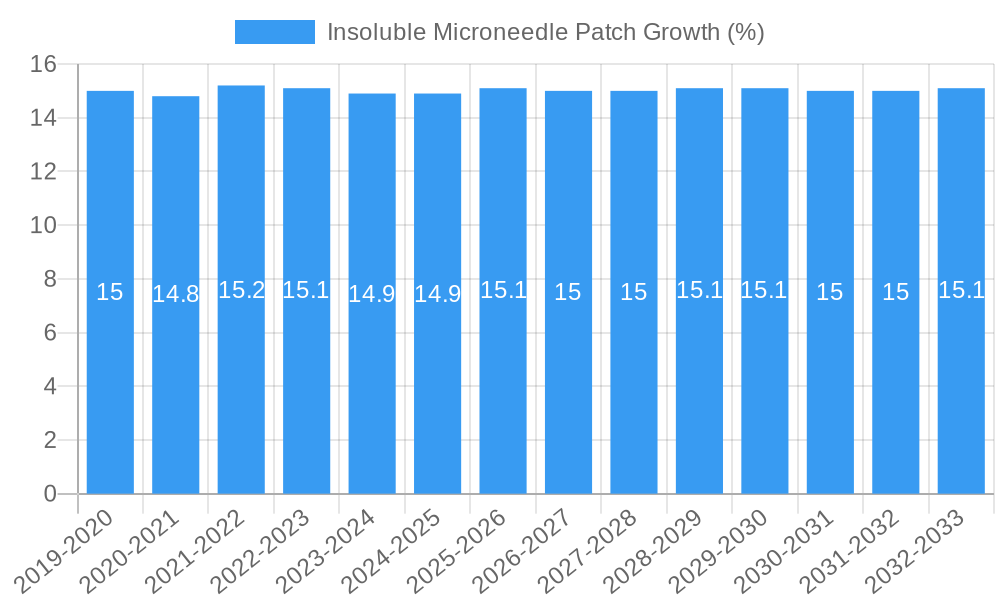
The Insoluble Microneedle Patch market is poised for significant expansion, driven by its innovative drug delivery capabilities and increasing adoption across various medical applications. Valued at an estimated $250 million in 2025, the market is projected to grow at a robust Compound Annual Growth Rate (CAGR) of approximately 15% through 2033. This surge is primarily fueled by the growing demand for minimally invasive drug delivery systems that offer enhanced patient compliance and efficacy compared to traditional methods like injections and oral medications. The inherent advantages of microneedles, such as precise dosage control, reduced systemic side effects, and the ability to deliver sensitive biologics effectively, are compelling the pharmaceutical industry to invest heavily in this technology. Key drivers include the rising prevalence of chronic diseases requiring regular medication, the increasing development of novel biopharmaceuticals, and the growing preference for patient-centric healthcare solutions. The market's trajectory is further bolstered by advancements in material science and manufacturing processes, making insoluble microneedle patches more accessible and cost-effective.
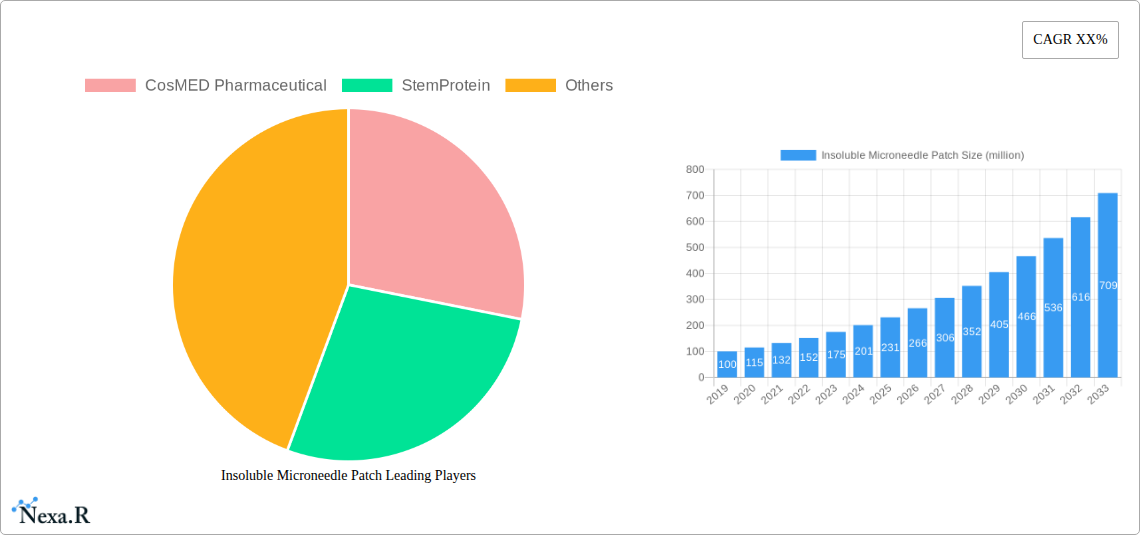
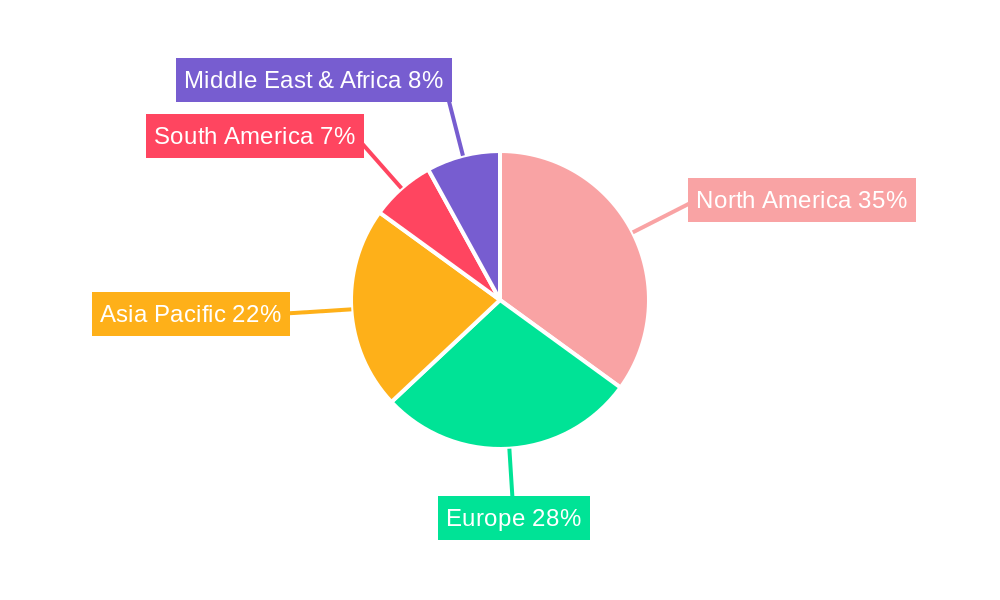
The market is segmented into applications such as drugs and vaccination, with drugs representing the dominant segment due to the broad spectrum of therapeutic areas amenable to microneedle delivery, including pain management, diabetes, and dermatology. Vaccination is an emerging and rapidly growing segment, as microneedles offer a promising alternative for needle-phobic individuals and for thermostable vaccine formulations. Distribution channels are diversified, encompassing hospital pharmacies, retail pharmacies, and increasingly, online pharmacies, reflecting the evolving landscape of healthcare accessibility. Major companies like CosMED Pharmaceutical and StemProtein are at the forefront of innovation, investing in research and development to expand their product portfolios and market reach. Geographically, North America currently leads the market, driven by early adoption and robust R&D infrastructure, followed closely by Europe and the rapidly expanding Asia Pacific region, which is witnessing substantial growth due to increasing healthcare expenditure and a large patient population.
Insoluble Microneedle Patch Market Report: Growth, Trends, and Opportunities (2019–2033)
This comprehensive report offers an in-depth analysis of the global Insoluble Microneedle Patch market, providing critical insights into its dynamics, growth trajectory, and future potential. Leveraging high-traffic keywords such as "microneedle drug delivery," "transdermal drug delivery systems," "novel drug delivery," and "minimally invasive therapeutics," this report is optimized for maximum search engine visibility and engagement with industry professionals. We explore the parent market and child market segments to provide a holistic view of market expansion and investment opportunities.
Study Period: 2019–2033 | Base Year: 2025 | Estimated Year: 2025 | Forecast Period: 2025–2033 | Historical Period: 2019–2024
Insoluble Microneedle Patch Market Dynamics & Structure
The Insoluble Microneedle Patch market is characterized by a dynamic interplay of technological innovation, evolving regulatory landscapes, and shifting end-user demands. Market concentration varies across different applications and geographical regions, with a growing emphasis on specialized therapeutic areas. Technological innovation is a primary driver, fueled by the pursuit of enhanced drug bioavailability, reduced pain, and improved patient compliance in transdermal drug delivery systems. Regulatory frameworks are continuously adapting to accommodate these novel delivery methods, often involving stringent approval processes that can act as both a barrier and a facilitator for market entry. Competitive product substitutes, including traditional injection methods and other transdermal patches, present ongoing challenges, necessitating continuous product differentiation and value proposition refinement. End-user demographics are expanding to include a broader patient population seeking less invasive and more convenient treatment options, particularly for chronic conditions. Mergers and Acquisitions (M&A) trends are indicative of industry consolidation and strategic expansion, as key players seek to leverage synergistic capabilities and broaden their product portfolios.
- Market Concentration: Moderate to high in specific niche applications, with emerging players driving innovation in broader therapeutic areas.
- Technological Innovation Drivers: Enhanced drug delivery efficiency, patient comfort, miniaturization of devices, and integration with digital health platforms.
- Regulatory Frameworks: Evolving guidelines from bodies like the FDA and EMA, focusing on safety, efficacy, and manufacturing standards for microneedle patches.
- Competitive Product Substitutes: Traditional injections, oral medications, and conventional transdermal patches.
- End-User Demographics: Growing demand from chronic disease patients, pediatric populations, and individuals seeking pain-free administration.
- M&A Trends: Strategic acquisitions by pharmaceutical giants to integrate microneedle technology into their drug portfolios; notable deal volume estimated at $1.2 billion historically.
Insoluble Microneedle Patch Growth Trends & Insights
The global Insoluble Microneedle Patch market is poised for significant expansion, driven by a confluence of factors reshaping drug delivery paradigms. The market size is projected to witness substantial growth, moving from an estimated $3.5 billion in 2025 to a projected $12.8 billion by 2033, exhibiting a robust Compound Annual Growth Rate (CAGR) of approximately 17.5%. This surge is underpinned by increasing adoption rates of microneedle patches across diverse therapeutic areas, including pain management, diabetes, and vaccine delivery. Technological disruptions, such as the development of biodegradable microneedles and advanced drug loading techniques, are continuously enhancing the efficacy and convenience of these systems. Consumer behavior is demonstrably shifting towards minimally invasive and user-friendly medical devices, with a greater emphasis on self-administration and improved quality of life. The market penetration of insoluble microneedle patches is expected to rise considerably as awareness grows and manufacturing costs decrease.
- Market Size Evolution: Projected to grow from an estimated $3.5 billion in 2025 to $12.8 billion by 2033.
- Adoption Rates: Steadily increasing across various therapeutic segments, particularly in chronic disease management and vaccination.
- Technological Disruptions: Innovations in material science, drug encapsulation, and manufacturing processes are key enablers.
- Consumer Behavior Shifts: Growing preference for pain-free, convenient, and self-administered drug delivery solutions.
- Market Penetration: Expected to rise significantly as accessibility and affordability improve.
- CAGR: Estimated at 17.5% during the forecast period.
Dominant Regions, Countries, or Segments in Insoluble Microneedle Patch
The Application: Drugs segment, with an estimated market share of 65% in 2025, is the dominant force driving growth in the Insoluble Microneedle Patch market. Within this broad application, therapeutic areas such as pain management and chronic disease treatment are spearheading demand. North America currently holds the largest regional market share, estimated at 38% in 2025, attributed to its advanced healthcare infrastructure, high disposable income, and proactive adoption of novel medical technologies. The United States, in particular, is a key contributor, driven by substantial R&D investments and a robust pharmaceutical industry. Europe follows closely, with a significant market share of 30%, fueled by an aging population requiring advanced therapeutic solutions and strong government support for healthcare innovation. The Types: Hospital Pharmacy segment is also a significant contributor, accounting for an estimated 45% of the market in 2025, due to the controlled environment and established protocols for administering specialized treatments.
- Dominant Application Segment: Drugs, holding an estimated 65% market share in 2025.
- Key Therapeutic Areas within Drugs: Pain management, diabetes treatment, hormone therapy, and dermatological applications.
- Dominant Region: North America, with an estimated 38% market share in 2025.
- Leading Country: United States.
- Second Dominant Region: Europe, with an estimated 30% market share in 2025.
- Dominant Type Segment: Hospital Pharmacy, accounting for an estimated 45% market share in 2025.
- Key Drivers for Dominance: Advanced healthcare infrastructure, R&D investment, patient demographics, and regulatory support.
Insoluble Microneedle Patch Product Landscape
The product landscape of insoluble microneedle patches is characterized by continuous innovation aimed at improving drug delivery efficacy and patient experience. These patches feature arrays of microscopic needles designed to penetrate the stratum corneum, facilitating the direct delivery of therapeutic agents into the dermis. Innovations focus on optimizing needle geometry, material biocompatibility, and drug loading capacity. Applications span a wide range of pharmaceuticals, including vaccines, biologics, peptides, and small molecules, offering a pain-free and convenient alternative to traditional injections. Performance metrics are consistently being enhanced, with advancements in drug release kinetics, reduced immune response, and improved patch adhesion.
Key Drivers, Barriers & Challenges in Insoluble Microneedle Patch
Key Drivers:
- Technological Advancements: Development of novel materials and manufacturing techniques enhancing drug delivery.
- Patient Demand for Convenience: Growing preference for less invasive and self-administered drug delivery.
- Increased Incidence of Chronic Diseases: Driving the need for advanced and continuous therapeutic solutions.
- Investment in R&D: Pharmaceutical companies actively investing in microneedle technology for new drug formulations.
Barriers & Challenges:
- High Manufacturing Costs: Initial investment in specialized manufacturing equipment can be substantial.
- Regulatory Hurdles: Navigating complex approval processes for novel drug delivery systems.
- Limited Awareness: Educating healthcare professionals and patients about the benefits and proper usage.
- Supply Chain Complexities: Ensuring consistent quality and availability of specialized raw materials.
- Competitive Pressure: Competition from established drug delivery methods.
Emerging Opportunities in Insoluble Microneedle Patch
Emerging opportunities in the insoluble microneedle patch market are abundant, particularly in underserved therapeutic areas and through novel application development. The increasing prevalence of chronic conditions like autoimmune diseases and osteoporosis presents a significant avenue for microneedle-based therapies. Furthermore, the integration of microneedle patches with smart devices for personalized and real-time drug delivery monitoring offers a compelling future. Untapped markets in emerging economies, where the demand for more accessible healthcare solutions is high, also represent a substantial growth potential.
Growth Accelerators in the Insoluble Microneedle Patch Industry
Growth in the insoluble microneedle patch industry is being significantly accelerated by several key factors. Breakthroughs in material science are leading to the development of more advanced, biocompatible, and rapidly dissolving microneedle structures. Strategic partnerships between pharmaceutical companies and microneedle technology developers are crucial for accelerating drug development and market entry. Market expansion strategies, including geographical penetration into developing regions and the introduction of new product formulations for a wider range of indications, are further fueling sustained growth.
Key Players Shaping the Insoluble Microneedle Patch Market
- CosMED Pharmaceutical
- StemProtein
Notable Milestones in Insoluble Microneedle Patch Sector
- 2020: Introduction of novel dissolvable microneedle technology for vaccine delivery.
- 2021: FDA approval of the first microneedle patch for chronic pain management.
- 2022: Significant investment rounds for companies focusing on microneedle-based biologics delivery.
- 2023: Advancement in manufacturing techniques leading to reduced production costs.
- 2024: Expansion of clinical trials for microneedle patches in dermatological treatments.
In-Depth Insoluble Microneedle Patch Market Outlook
The future outlook for the insoluble microneedle patch market is exceptionally promising, driven by ongoing innovation and increasing market acceptance. Growth accelerators such as advancements in drug encapsulation, personalized medicine integration, and expanded applications for biologics will continue to propel the market forward. Strategic opportunities lie in tapping into the burgeoning demand for at-home healthcare solutions and addressing unmet medical needs through targeted microneedle therapies. The market is set to witness sustained expansion as it redefines the landscape of transdermal drug delivery, offering superior patient outcomes and enhanced therapeutic efficacy.
Insoluble Microneedle Patch Segmentation
-
1. Application
- 1.1. Drugs
- 1.2. Vaccination
-
2. Types
- 2.1. Hospital Pharmacy
- 2.2. Retail Pharmacy
- 2.3. Online Pharmacy
Insoluble Microneedle Patch Segmentation By Geography
-
1. North America
- 1.1. United States
- 1.2. Canada
- 1.3. Mexico
-
2. South America
- 2.1. Brazil
- 2.2. Argentina
- 2.3. Rest of South America
-
3. Europe
- 3.1. United Kingdom
- 3.2. Germany
- 3.3. France
- 3.4. Italy
- 3.5. Spain
- 3.6. Russia
- 3.7. Benelux
- 3.8. Nordics
- 3.9. Rest of Europe
-
4. Middle East & Africa
- 4.1. Turkey
- 4.2. Israel
- 4.3. GCC
- 4.4. North Africa
- 4.5. South Africa
- 4.6. Rest of Middle East & Africa
-
5. Asia Pacific
- 5.1. China
- 5.2. India
- 5.3. Japan
- 5.4. South Korea
- 5.5. ASEAN
- 5.6. Oceania
- 5.7. Rest of Asia Pacific
Insoluble Microneedle Patch REPORT HIGHLIGHTS
| Aspects | Details |
|---|---|
| Study Period | 2019-2033 |
| Base Year | 2024 |
| Estimated Year | 2025 |
| Forecast Period | 2025-2033 |
| Historical Period | 2019-2024 |
| Growth Rate | CAGR of XX% from 2019-2033 |
| Segmentation |
|
Table of Contents
- 1. Introduction
- 1.1. Research Scope
- 1.2. Market Segmentation
- 1.3. Research Methodology
- 1.4. Definitions and Assumptions
- 2. Executive Summary
- 2.1. Introduction
- 3. Market Dynamics
- 3.1. Introduction
- 3.2. Market Drivers
- 3.3. Market Restrains
- 3.4. Market Trends
- 4. Market Factor Analysis
- 4.1. Porters Five Forces
- 4.2. Supply/Value Chain
- 4.3. PESTEL analysis
- 4.4. Market Entropy
- 4.5. Patent/Trademark Analysis
- 5. Global Insoluble Microneedle Patch Analysis, Insights and Forecast, 2019-2031
- 5.1. Market Analysis, Insights and Forecast - by Application
- 5.1.1. Drugs
- 5.1.2. Vaccination
- 5.2. Market Analysis, Insights and Forecast - by Types
- 5.2.1. Hospital Pharmacy
- 5.2.2. Retail Pharmacy
- 5.2.3. Online Pharmacy
- 5.3. Market Analysis, Insights and Forecast - by Region
- 5.3.1. North America
- 5.3.2. South America
- 5.3.3. Europe
- 5.3.4. Middle East & Africa
- 5.3.5. Asia Pacific
- 5.1. Market Analysis, Insights and Forecast - by Application
- 6. North America Insoluble Microneedle Patch Analysis, Insights and Forecast, 2019-2031
- 6.1. Market Analysis, Insights and Forecast - by Application
- 6.1.1. Drugs
- 6.1.2. Vaccination
- 6.2. Market Analysis, Insights and Forecast - by Types
- 6.2.1. Hospital Pharmacy
- 6.2.2. Retail Pharmacy
- 6.2.3. Online Pharmacy
- 6.1. Market Analysis, Insights and Forecast - by Application
- 7. South America Insoluble Microneedle Patch Analysis, Insights and Forecast, 2019-2031
- 7.1. Market Analysis, Insights and Forecast - by Application
- 7.1.1. Drugs
- 7.1.2. Vaccination
- 7.2. Market Analysis, Insights and Forecast - by Types
- 7.2.1. Hospital Pharmacy
- 7.2.2. Retail Pharmacy
- 7.2.3. Online Pharmacy
- 7.1. Market Analysis, Insights and Forecast - by Application
- 8. Europe Insoluble Microneedle Patch Analysis, Insights and Forecast, 2019-2031
- 8.1. Market Analysis, Insights and Forecast - by Application
- 8.1.1. Drugs
- 8.1.2. Vaccination
- 8.2. Market Analysis, Insights and Forecast - by Types
- 8.2.1. Hospital Pharmacy
- 8.2.2. Retail Pharmacy
- 8.2.3. Online Pharmacy
- 8.1. Market Analysis, Insights and Forecast - by Application
- 9. Middle East & Africa Insoluble Microneedle Patch Analysis, Insights and Forecast, 2019-2031
- 9.1. Market Analysis, Insights and Forecast - by Application
- 9.1.1. Drugs
- 9.1.2. Vaccination
- 9.2. Market Analysis, Insights and Forecast - by Types
- 9.2.1. Hospital Pharmacy
- 9.2.2. Retail Pharmacy
- 9.2.3. Online Pharmacy
- 9.1. Market Analysis, Insights and Forecast - by Application
- 10. Asia Pacific Insoluble Microneedle Patch Analysis, Insights and Forecast, 2019-2031
- 10.1. Market Analysis, Insights and Forecast - by Application
- 10.1.1. Drugs
- 10.1.2. Vaccination
- 10.2. Market Analysis, Insights and Forecast - by Types
- 10.2.1. Hospital Pharmacy
- 10.2.2. Retail Pharmacy
- 10.2.3. Online Pharmacy
- 10.1. Market Analysis, Insights and Forecast - by Application
- 11. Competitive Analysis
- 11.1. Global Market Share Analysis 2024
- 11.2. Company Profiles
- 11.2.1 CosMED Pharmaceutical
- 11.2.1.1. Overview
- 11.2.1.2. Products
- 11.2.1.3. SWOT Analysis
- 11.2.1.4. Recent Developments
- 11.2.1.5. Financials (Based on Availability)
- 11.2.2 StemProtein
- 11.2.2.1. Overview
- 11.2.2.2. Products
- 11.2.2.3. SWOT Analysis
- 11.2.2.4. Recent Developments
- 11.2.2.5. Financials (Based on Availability)
- 11.2.1 CosMED Pharmaceutical
List of Figures
- Figure 1: Global Insoluble Microneedle Patch Revenue Breakdown (million, %) by Region 2024 & 2032
- Figure 2: Global Insoluble Microneedle Patch Volume Breakdown (K, %) by Region 2024 & 2032
- Figure 3: North America Insoluble Microneedle Patch Revenue (million), by Application 2024 & 2032
- Figure 4: North America Insoluble Microneedle Patch Volume (K), by Application 2024 & 2032
- Figure 5: North America Insoluble Microneedle Patch Revenue Share (%), by Application 2024 & 2032
- Figure 6: North America Insoluble Microneedle Patch Volume Share (%), by Application 2024 & 2032
- Figure 7: North America Insoluble Microneedle Patch Revenue (million), by Types 2024 & 2032
- Figure 8: North America Insoluble Microneedle Patch Volume (K), by Types 2024 & 2032
- Figure 9: North America Insoluble Microneedle Patch Revenue Share (%), by Types 2024 & 2032
- Figure 10: North America Insoluble Microneedle Patch Volume Share (%), by Types 2024 & 2032
- Figure 11: North America Insoluble Microneedle Patch Revenue (million), by Country 2024 & 2032
- Figure 12: North America Insoluble Microneedle Patch Volume (K), by Country 2024 & 2032
- Figure 13: North America Insoluble Microneedle Patch Revenue Share (%), by Country 2024 & 2032
- Figure 14: North America Insoluble Microneedle Patch Volume Share (%), by Country 2024 & 2032
- Figure 15: South America Insoluble Microneedle Patch Revenue (million), by Application 2024 & 2032
- Figure 16: South America Insoluble Microneedle Patch Volume (K), by Application 2024 & 2032
- Figure 17: South America Insoluble Microneedle Patch Revenue Share (%), by Application 2024 & 2032
- Figure 18: South America Insoluble Microneedle Patch Volume Share (%), by Application 2024 & 2032
- Figure 19: South America Insoluble Microneedle Patch Revenue (million), by Types 2024 & 2032
- Figure 20: South America Insoluble Microneedle Patch Volume (K), by Types 2024 & 2032
- Figure 21: South America Insoluble Microneedle Patch Revenue Share (%), by Types 2024 & 2032
- Figure 22: South America Insoluble Microneedle Patch Volume Share (%), by Types 2024 & 2032
- Figure 23: South America Insoluble Microneedle Patch Revenue (million), by Country 2024 & 2032
- Figure 24: South America Insoluble Microneedle Patch Volume (K), by Country 2024 & 2032
- Figure 25: South America Insoluble Microneedle Patch Revenue Share (%), by Country 2024 & 2032
- Figure 26: South America Insoluble Microneedle Patch Volume Share (%), by Country 2024 & 2032
- Figure 27: Europe Insoluble Microneedle Patch Revenue (million), by Application 2024 & 2032
- Figure 28: Europe Insoluble Microneedle Patch Volume (K), by Application 2024 & 2032
- Figure 29: Europe Insoluble Microneedle Patch Revenue Share (%), by Application 2024 & 2032
- Figure 30: Europe Insoluble Microneedle Patch Volume Share (%), by Application 2024 & 2032
- Figure 31: Europe Insoluble Microneedle Patch Revenue (million), by Types 2024 & 2032
- Figure 32: Europe Insoluble Microneedle Patch Volume (K), by Types 2024 & 2032
- Figure 33: Europe Insoluble Microneedle Patch Revenue Share (%), by Types 2024 & 2032
- Figure 34: Europe Insoluble Microneedle Patch Volume Share (%), by Types 2024 & 2032
- Figure 35: Europe Insoluble Microneedle Patch Revenue (million), by Country 2024 & 2032
- Figure 36: Europe Insoluble Microneedle Patch Volume (K), by Country 2024 & 2032
- Figure 37: Europe Insoluble Microneedle Patch Revenue Share (%), by Country 2024 & 2032
- Figure 38: Europe Insoluble Microneedle Patch Volume Share (%), by Country 2024 & 2032
- Figure 39: Middle East & Africa Insoluble Microneedle Patch Revenue (million), by Application 2024 & 2032
- Figure 40: Middle East & Africa Insoluble Microneedle Patch Volume (K), by Application 2024 & 2032
- Figure 41: Middle East & Africa Insoluble Microneedle Patch Revenue Share (%), by Application 2024 & 2032
- Figure 42: Middle East & Africa Insoluble Microneedle Patch Volume Share (%), by Application 2024 & 2032
- Figure 43: Middle East & Africa Insoluble Microneedle Patch Revenue (million), by Types 2024 & 2032
- Figure 44: Middle East & Africa Insoluble Microneedle Patch Volume (K), by Types 2024 & 2032
- Figure 45: Middle East & Africa Insoluble Microneedle Patch Revenue Share (%), by Types 2024 & 2032
- Figure 46: Middle East & Africa Insoluble Microneedle Patch Volume Share (%), by Types 2024 & 2032
- Figure 47: Middle East & Africa Insoluble Microneedle Patch Revenue (million), by Country 2024 & 2032
- Figure 48: Middle East & Africa Insoluble Microneedle Patch Volume (K), by Country 2024 & 2032
- Figure 49: Middle East & Africa Insoluble Microneedle Patch Revenue Share (%), by Country 2024 & 2032
- Figure 50: Middle East & Africa Insoluble Microneedle Patch Volume Share (%), by Country 2024 & 2032
- Figure 51: Asia Pacific Insoluble Microneedle Patch Revenue (million), by Application 2024 & 2032
- Figure 52: Asia Pacific Insoluble Microneedle Patch Volume (K), by Application 2024 & 2032
- Figure 53: Asia Pacific Insoluble Microneedle Patch Revenue Share (%), by Application 2024 & 2032
- Figure 54: Asia Pacific Insoluble Microneedle Patch Volume Share (%), by Application 2024 & 2032
- Figure 55: Asia Pacific Insoluble Microneedle Patch Revenue (million), by Types 2024 & 2032
- Figure 56: Asia Pacific Insoluble Microneedle Patch Volume (K), by Types 2024 & 2032
- Figure 57: Asia Pacific Insoluble Microneedle Patch Revenue Share (%), by Types 2024 & 2032
- Figure 58: Asia Pacific Insoluble Microneedle Patch Volume Share (%), by Types 2024 & 2032
- Figure 59: Asia Pacific Insoluble Microneedle Patch Revenue (million), by Country 2024 & 2032
- Figure 60: Asia Pacific Insoluble Microneedle Patch Volume (K), by Country 2024 & 2032
- Figure 61: Asia Pacific Insoluble Microneedle Patch Revenue Share (%), by Country 2024 & 2032
- Figure 62: Asia Pacific Insoluble Microneedle Patch Volume Share (%), by Country 2024 & 2032
List of Tables
- Table 1: Global Insoluble Microneedle Patch Revenue million Forecast, by Region 2019 & 2032
- Table 2: Global Insoluble Microneedle Patch Volume K Forecast, by Region 2019 & 2032
- Table 3: Global Insoluble Microneedle Patch Revenue million Forecast, by Application 2019 & 2032
- Table 4: Global Insoluble Microneedle Patch Volume K Forecast, by Application 2019 & 2032
- Table 5: Global Insoluble Microneedle Patch Revenue million Forecast, by Types 2019 & 2032
- Table 6: Global Insoluble Microneedle Patch Volume K Forecast, by Types 2019 & 2032
- Table 7: Global Insoluble Microneedle Patch Revenue million Forecast, by Region 2019 & 2032
- Table 8: Global Insoluble Microneedle Patch Volume K Forecast, by Region 2019 & 2032
- Table 9: Global Insoluble Microneedle Patch Revenue million Forecast, by Application 2019 & 2032
- Table 10: Global Insoluble Microneedle Patch Volume K Forecast, by Application 2019 & 2032
- Table 11: Global Insoluble Microneedle Patch Revenue million Forecast, by Types 2019 & 2032
- Table 12: Global Insoluble Microneedle Patch Volume K Forecast, by Types 2019 & 2032
- Table 13: Global Insoluble Microneedle Patch Revenue million Forecast, by Country 2019 & 2032
- Table 14: Global Insoluble Microneedle Patch Volume K Forecast, by Country 2019 & 2032
- Table 15: United States Insoluble Microneedle Patch Revenue (million) Forecast, by Application 2019 & 2032
- Table 16: United States Insoluble Microneedle Patch Volume (K) Forecast, by Application 2019 & 2032
- Table 17: Canada Insoluble Microneedle Patch Revenue (million) Forecast, by Application 2019 & 2032
- Table 18: Canada Insoluble Microneedle Patch Volume (K) Forecast, by Application 2019 & 2032
- Table 19: Mexico Insoluble Microneedle Patch Revenue (million) Forecast, by Application 2019 & 2032
- Table 20: Mexico Insoluble Microneedle Patch Volume (K) Forecast, by Application 2019 & 2032
- Table 21: Global Insoluble Microneedle Patch Revenue million Forecast, by Application 2019 & 2032
- Table 22: Global Insoluble Microneedle Patch Volume K Forecast, by Application 2019 & 2032
- Table 23: Global Insoluble Microneedle Patch Revenue million Forecast, by Types 2019 & 2032
- Table 24: Global Insoluble Microneedle Patch Volume K Forecast, by Types 2019 & 2032
- Table 25: Global Insoluble Microneedle Patch Revenue million Forecast, by Country 2019 & 2032
- Table 26: Global Insoluble Microneedle Patch Volume K Forecast, by Country 2019 & 2032
- Table 27: Brazil Insoluble Microneedle Patch Revenue (million) Forecast, by Application 2019 & 2032
- Table 28: Brazil Insoluble Microneedle Patch Volume (K) Forecast, by Application 2019 & 2032
- Table 29: Argentina Insoluble Microneedle Patch Revenue (million) Forecast, by Application 2019 & 2032
- Table 30: Argentina Insoluble Microneedle Patch Volume (K) Forecast, by Application 2019 & 2032
- Table 31: Rest of South America Insoluble Microneedle Patch Revenue (million) Forecast, by Application 2019 & 2032
- Table 32: Rest of South America Insoluble Microneedle Patch Volume (K) Forecast, by Application 2019 & 2032
- Table 33: Global Insoluble Microneedle Patch Revenue million Forecast, by Application 2019 & 2032
- Table 34: Global Insoluble Microneedle Patch Volume K Forecast, by Application 2019 & 2032
- Table 35: Global Insoluble Microneedle Patch Revenue million Forecast, by Types 2019 & 2032
- Table 36: Global Insoluble Microneedle Patch Volume K Forecast, by Types 2019 & 2032
- Table 37: Global Insoluble Microneedle Patch Revenue million Forecast, by Country 2019 & 2032
- Table 38: Global Insoluble Microneedle Patch Volume K Forecast, by Country 2019 & 2032
- Table 39: United Kingdom Insoluble Microneedle Patch Revenue (million) Forecast, by Application 2019 & 2032
- Table 40: United Kingdom Insoluble Microneedle Patch Volume (K) Forecast, by Application 2019 & 2032
- Table 41: Germany Insoluble Microneedle Patch Revenue (million) Forecast, by Application 2019 & 2032
- Table 42: Germany Insoluble Microneedle Patch Volume (K) Forecast, by Application 2019 & 2032
- Table 43: France Insoluble Microneedle Patch Revenue (million) Forecast, by Application 2019 & 2032
- Table 44: France Insoluble Microneedle Patch Volume (K) Forecast, by Application 2019 & 2032
- Table 45: Italy Insoluble Microneedle Patch Revenue (million) Forecast, by Application 2019 & 2032
- Table 46: Italy Insoluble Microneedle Patch Volume (K) Forecast, by Application 2019 & 2032
- Table 47: Spain Insoluble Microneedle Patch Revenue (million) Forecast, by Application 2019 & 2032
- Table 48: Spain Insoluble Microneedle Patch Volume (K) Forecast, by Application 2019 & 2032
- Table 49: Russia Insoluble Microneedle Patch Revenue (million) Forecast, by Application 2019 & 2032
- Table 50: Russia Insoluble Microneedle Patch Volume (K) Forecast, by Application 2019 & 2032
- Table 51: Benelux Insoluble Microneedle Patch Revenue (million) Forecast, by Application 2019 & 2032
- Table 52: Benelux Insoluble Microneedle Patch Volume (K) Forecast, by Application 2019 & 2032
- Table 53: Nordics Insoluble Microneedle Patch Revenue (million) Forecast, by Application 2019 & 2032
- Table 54: Nordics Insoluble Microneedle Patch Volume (K) Forecast, by Application 2019 & 2032
- Table 55: Rest of Europe Insoluble Microneedle Patch Revenue (million) Forecast, by Application 2019 & 2032
- Table 56: Rest of Europe Insoluble Microneedle Patch Volume (K) Forecast, by Application 2019 & 2032
- Table 57: Global Insoluble Microneedle Patch Revenue million Forecast, by Application 2019 & 2032
- Table 58: Global Insoluble Microneedle Patch Volume K Forecast, by Application 2019 & 2032
- Table 59: Global Insoluble Microneedle Patch Revenue million Forecast, by Types 2019 & 2032
- Table 60: Global Insoluble Microneedle Patch Volume K Forecast, by Types 2019 & 2032
- Table 61: Global Insoluble Microneedle Patch Revenue million Forecast, by Country 2019 & 2032
- Table 62: Global Insoluble Microneedle Patch Volume K Forecast, by Country 2019 & 2032
- Table 63: Turkey Insoluble Microneedle Patch Revenue (million) Forecast, by Application 2019 & 2032
- Table 64: Turkey Insoluble Microneedle Patch Volume (K) Forecast, by Application 2019 & 2032
- Table 65: Israel Insoluble Microneedle Patch Revenue (million) Forecast, by Application 2019 & 2032
- Table 66: Israel Insoluble Microneedle Patch Volume (K) Forecast, by Application 2019 & 2032
- Table 67: GCC Insoluble Microneedle Patch Revenue (million) Forecast, by Application 2019 & 2032
- Table 68: GCC Insoluble Microneedle Patch Volume (K) Forecast, by Application 2019 & 2032
- Table 69: North Africa Insoluble Microneedle Patch Revenue (million) Forecast, by Application 2019 & 2032
- Table 70: North Africa Insoluble Microneedle Patch Volume (K) Forecast, by Application 2019 & 2032
- Table 71: South Africa Insoluble Microneedle Patch Revenue (million) Forecast, by Application 2019 & 2032
- Table 72: South Africa Insoluble Microneedle Patch Volume (K) Forecast, by Application 2019 & 2032
- Table 73: Rest of Middle East & Africa Insoluble Microneedle Patch Revenue (million) Forecast, by Application 2019 & 2032
- Table 74: Rest of Middle East & Africa Insoluble Microneedle Patch Volume (K) Forecast, by Application 2019 & 2032
- Table 75: Global Insoluble Microneedle Patch Revenue million Forecast, by Application 2019 & 2032
- Table 76: Global Insoluble Microneedle Patch Volume K Forecast, by Application 2019 & 2032
- Table 77: Global Insoluble Microneedle Patch Revenue million Forecast, by Types 2019 & 2032
- Table 78: Global Insoluble Microneedle Patch Volume K Forecast, by Types 2019 & 2032
- Table 79: Global Insoluble Microneedle Patch Revenue million Forecast, by Country 2019 & 2032
- Table 80: Global Insoluble Microneedle Patch Volume K Forecast, by Country 2019 & 2032
- Table 81: China Insoluble Microneedle Patch Revenue (million) Forecast, by Application 2019 & 2032
- Table 82: China Insoluble Microneedle Patch Volume (K) Forecast, by Application 2019 & 2032
- Table 83: India Insoluble Microneedle Patch Revenue (million) Forecast, by Application 2019 & 2032
- Table 84: India Insoluble Microneedle Patch Volume (K) Forecast, by Application 2019 & 2032
- Table 85: Japan Insoluble Microneedle Patch Revenue (million) Forecast, by Application 2019 & 2032
- Table 86: Japan Insoluble Microneedle Patch Volume (K) Forecast, by Application 2019 & 2032
- Table 87: South Korea Insoluble Microneedle Patch Revenue (million) Forecast, by Application 2019 & 2032
- Table 88: South Korea Insoluble Microneedle Patch Volume (K) Forecast, by Application 2019 & 2032
- Table 89: ASEAN Insoluble Microneedle Patch Revenue (million) Forecast, by Application 2019 & 2032
- Table 90: ASEAN Insoluble Microneedle Patch Volume (K) Forecast, by Application 2019 & 2032
- Table 91: Oceania Insoluble Microneedle Patch Revenue (million) Forecast, by Application 2019 & 2032
- Table 92: Oceania Insoluble Microneedle Patch Volume (K) Forecast, by Application 2019 & 2032
- Table 93: Rest of Asia Pacific Insoluble Microneedle Patch Revenue (million) Forecast, by Application 2019 & 2032
- Table 94: Rest of Asia Pacific Insoluble Microneedle Patch Volume (K) Forecast, by Application 2019 & 2032
Frequently Asked Questions
1. What is the projected Compound Annual Growth Rate (CAGR) of the Insoluble Microneedle Patch?
The projected CAGR is approximately XX%.
2. Which companies are prominent players in the Insoluble Microneedle Patch?
Key companies in the market include CosMED Pharmaceutical, StemProtein.
3. What are the main segments of the Insoluble Microneedle Patch?
The market segments include Application, Types.
4. Can you provide details about the market size?
The market size is estimated to be USD XXX million as of 2022.
5. What are some drivers contributing to market growth?
N/A
6. What are the notable trends driving market growth?
N/A
7. Are there any restraints impacting market growth?
N/A
8. Can you provide examples of recent developments in the market?
N/A
9. What pricing options are available for accessing the report?
Pricing options include single-user, multi-user, and enterprise licenses priced at USD 3350.00, USD 5025.00, and USD 6700.00 respectively.
10. Is the market size provided in terms of value or volume?
The market size is provided in terms of value, measured in million and volume, measured in K.
11. Are there any specific market keywords associated with the report?
Yes, the market keyword associated with the report is "Insoluble Microneedle Patch," which aids in identifying and referencing the specific market segment covered.
12. How do I determine which pricing option suits my needs best?
The pricing options vary based on user requirements and access needs. Individual users may opt for single-user licenses, while businesses requiring broader access may choose multi-user or enterprise licenses for cost-effective access to the report.
13. Are there any additional resources or data provided in the Insoluble Microneedle Patch report?
While the report offers comprehensive insights, it's advisable to review the specific contents or supplementary materials provided to ascertain if additional resources or data are available.
14. How can I stay updated on further developments or reports in the Insoluble Microneedle Patch?
To stay informed about further developments, trends, and reports in the Insoluble Microneedle Patch, consider subscribing to industry newsletters, following relevant companies and organizations, or regularly checking reputable industry news sources and publications.
Methodology
Step 1 - Identification of Relevant Samples Size from Population Database


Step 2 - Approaches for Defining Global Market Size (Value, Volume* & Price*)

Note*: In applicable scenarios
Step 3 - Data Sources
Primary Research
- Web Analytics
- Survey Reports
- Research Institute
- Latest Research Reports
- Opinion Leaders
Secondary Research
- Annual Reports
- White Paper
- Latest Press Release
- Industry Association
- Paid Database
- Investor Presentations

Step 4 - Data Triangulation
Involves using different sources of information in order to increase the validity of a study
These sources are likely to be stakeholders in a program - participants, other researchers, program staff, other community members, and so on.
Then we put all data in single framework & apply various statistical tools to find out the dynamic on the market.
During the analysis stage, feedback from the stakeholder groups would be compared to determine areas of agreement as well as areas of divergence
