

Key Insights
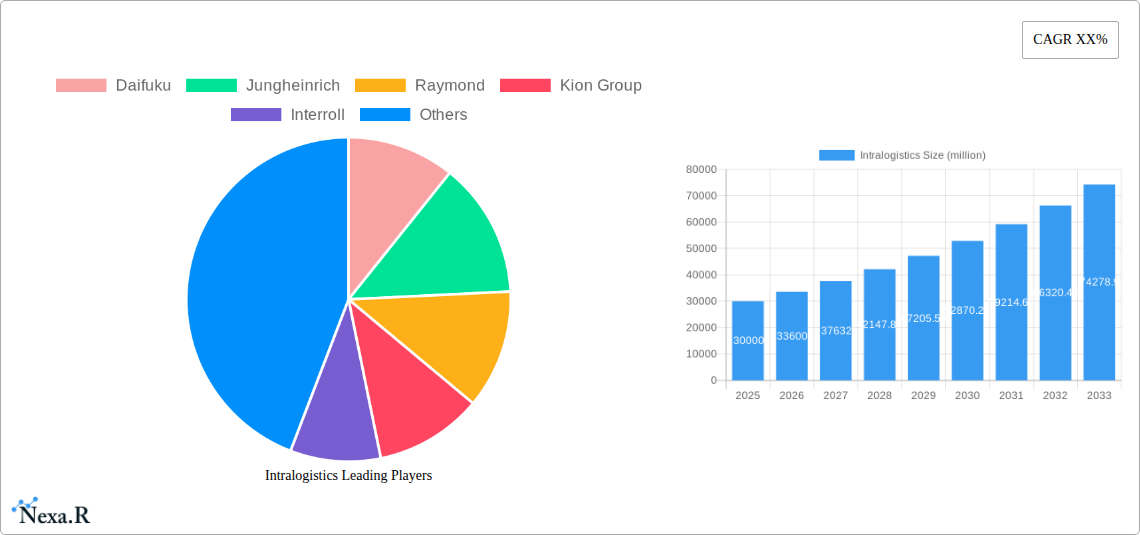
The global intralogistics market is experiencing robust growth, projected to reach a substantial USD 30 billion by 2025 and expand at a Compound Annual Growth Rate (CAGR) of approximately 12% through 2033. This expansion is fundamentally driven by the accelerating adoption of automation across diverse industries, aimed at optimizing warehouse operations, improving efficiency, and reducing labor costs. Key growth catalysts include the surge in e-commerce, necessitating faster order fulfillment and more sophisticated inventory management. Furthermore, the imperative for enhanced supply chain resilience, particularly in light of recent global disruptions, is pushing businesses to invest in intelligent and flexible intralogistics solutions. The demand for advanced technologies such as Automated Storage and Retrieval Systems (AS/RS), Automated Guided Vehicles (AGVs), and Vertical Lift Modules (VLMs) is soaring as companies seek to maximize space utilization and streamline material flow.
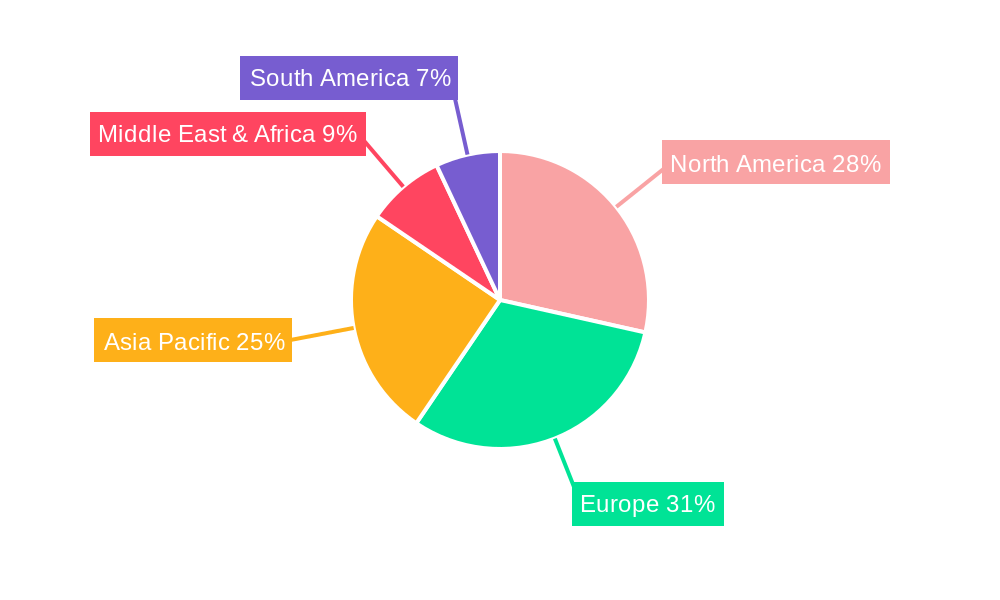
The market segmentation reveals a dynamic landscape. In terms of applications, Logistics and Warehousing, Food & Beverages, and Retail & e-Commerce are anticipated to be the dominant sectors, accounting for a significant portion of the market value, estimated to be in the range of USD 18-20 billion by 2025. These sectors are at the forefront of adopting automated solutions to meet increasing consumer demands for speed and accuracy. From a technological standpoint, AS/RS and AGVs are expected to capture the largest market share, driven by their proven ability to enhance productivity and safety. Geographically, Asia Pacific, led by China and India, is projected to be the fastest-growing region, fueled by rapid industrialization and the burgeoning e-commerce sector. North America and Europe will continue to hold significant market shares, driven by established industries and a strong focus on technological innovation and operational efficiency. However, rising implementation costs and the need for skilled personnel to manage these advanced systems represent key challenges that may moderate growth in certain segments.
Unleash Operational Efficiency: The Definitive Intralogistics Market Report (2019-2033)
This comprehensive report offers an in-depth analysis of the global intralogistics market, a critical sector driving efficiency and innovation across diverse industries. Covering a study period from 2019 to 2033, with a base year of 2025 and a forecast period from 2025 to 2033, this report provides actionable insights for stakeholders. We delve into the parent market, exploring the broader economic and industrial landscapes that shape intralogistics, and dissect the child markets, highlighting specific segments and their unique growth trajectories. Prepare to gain unparalleled clarity on market size, growth trends, competitive landscapes, and future opportunities in this rapidly evolving domain.
Intralogistics Market Dynamics & Structure
The intralogistics market exhibits a moderately concentrated structure, with a significant presence of both large, established players and agile, niche providers. Technological innovation serves as the primary engine for market growth, driven by the relentless pursuit of automation, AI integration, and data analytics to optimize warehouse operations. Regulatory frameworks, particularly those concerning workplace safety and environmental sustainability, are increasingly influencing market dynamics, demanding more sophisticated and compliant intralogistics solutions. Competitive product substitutes, while present, are primarily focused on incremental improvements rather than disruptive shifts, underscoring the value of integrated, end-to-end intralogistics systems. End-user demographics are shifting towards a demand for flexible, scalable, and data-driven solutions, with a growing emphasis on sustainability and reduced operational footprints. Mergers and acquisitions (M&A) trends reveal a strategic consolidation phase, as larger companies aim to expand their product portfolios and market reach, with approximately 15-20 significant M&A deals anticipated annually.
- Market Concentration: Dominated by a mix of global giants and specialized solution providers.
- Technological Innovation Drivers: Automation, AI, IoT, robotics, and data analytics are key.
- Regulatory Frameworks: Focus on safety, sustainability, and labor regulations influencing solution design.
- Competitive Product Substitutes: Limited disruptive alternatives to integrated systems, focus on feature enhancements.
- End-User Demographics: Increasing demand for flexible, scalable, sustainable, and data-rich solutions.
- M&A Trends: Strategic consolidation to enhance market share and technological capabilities.
Intralogistics Growth Trends & Insights
The global intralogistics market is poised for robust expansion, projected to reach $150,000 million by 2025, with a Compound Annual Growth Rate (CAGR) of 12.5% during the forecast period (2025-2033). This significant growth is fueled by the escalating demand for operational efficiency, reduced labor costs, and enhanced supply chain visibility across diverse industries. The adoption rates of automated solutions, including Automated Storage and Retrieval Systems (AS/RS) and Automated Guided Vehicles (AGVs), are accelerating rapidly. Technological disruptions, such as the integration of Artificial Intelligence (AI) in warehouse management systems (WMS) and the proliferation of collaborative robots (cobots), are transforming traditional warehousing paradigms. Consumer behavior shifts, particularly the surge in e-commerce and the expectation of faster delivery times, are placing unprecedented pressure on logistics and warehousing infrastructure, making sophisticated intralogistics solutions indispensable. The market penetration of advanced intralogistics technologies is expected to climb from 45% in the base year to over 70% by 2033. The increasing complexity of supply chains and the need for real-time inventory management are also significant growth drivers. Furthermore, government initiatives promoting industrial automation and smart manufacturing are further bolstering market expansion. The estimated market size for intralogistics solutions in 2025 is $150,000 million, with a projected CAGR of 12.5% through 2033.
Dominant Regions, Countries, or Segments in Intralogistics
North America, particularly the United States, is currently the dominant region in the intralogistics market, driven by its advanced technological infrastructure, a mature e-commerce sector, and significant investments in automation across various industries. The Retail & e-Commerce segment stands out as the most prominent application, accounting for an estimated 40% of the global intralogistics market share in 2025. This dominance is attributed to the rapid growth of online retail, the increasing demand for faster fulfillment, and the need for efficient inventory management to handle a vast array of SKUs. The Automated Storage and Retrieval Systems (AS/RS) segment within the "Types" classification is also a significant market driver, capturing an estimated 30% market share in 2025. Key drivers for AS/RS dominance include their ability to maximize storage density, reduce labor requirements, and improve order picking accuracy. Economic policies that encourage automation and digital transformation, coupled with substantial investments in logistics infrastructure, are further solidifying North America's leading position. The U.S. intralogistics market size is projected to reach $70,000 million in 2025.
- Dominant Region: North America (primarily the United States).
- Dominant Application Segment: Retail & e-Commerce, representing approximately 40% of the market in 2025.
- Dominant Type Segment: Automated Storage and Retrieval Systems (AS/RS), accounting for roughly 30% of the market in 2025.
- Key Drivers in North America: Advanced technological infrastructure, mature e-commerce sector, strong automation investments, supportive economic policies, and robust logistics infrastructure.
- Growth Potential in Retail & e-Commerce: Continued expansion fueled by online sales and evolving consumer expectations for speed and convenience.
- Growth Potential in AS/RS: Increasing adoption for space optimization, labor reduction, and accuracy enhancement in warehousing.
Intralogistics Product Landscape
The intralogistics product landscape is characterized by a rapid evolution of intelligent automation solutions. Automated Storage and Retrieval Systems (AS/RS) are offering enhanced throughput and greater scalability, while Automated Guided Vehicles (AGVs) and Autonomous Mobile Robots (AMRs) are becoming more sophisticated with advanced navigation and payload capabilities. Vertical Lift Modules (VLMs) are optimizing vertical space utilization for high-density storage of smaller items. Industrial robots, particularly collaborative robots (cobots), are increasingly integrated into picking, packing, and palletizing processes, offering flexibility and human-robot collaboration. The unique selling propositions of these products lie in their ability to significantly reduce operational costs, improve accuracy, enhance safety, and boost overall productivity. Technological advancements are focused on AI-driven optimization, predictive maintenance, and seamless integration with existing enterprise resource planning (ERP) and warehouse management systems (WMS).
Key Drivers, Barriers & Challenges in Intralogistics
The intralogistics market is propelled by a confluence of factors. Key drivers include the escalating demand for efficient supply chain management driven by e-commerce growth, the imperative to reduce operational costs and labor dependencies, and significant technological advancements in robotics and automation. Furthermore, government incentives promoting industrial automation and smart manufacturing, coupled with the need for enhanced workplace safety, are crucial growth accelerators.
However, the market faces several challenges and restraints. The high initial investment cost for advanced automation systems remains a significant barrier for small and medium-sized enterprises (SMEs), with initial capital outlay estimated between $0.5 million to $5 million for mid-scale implementations. Supply chain disruptions, particularly concerning the availability of critical components, can impact project timelines and costs, leading to an estimated 10-15% increase in project costs during periods of severe disruption. Regulatory hurdles and the need for skilled labor to operate and maintain sophisticated automated systems also pose challenges, requiring substantial investment in training and development, which can account for 5-10% of operational budgets.
Emerging Opportunities in Intralogistics
Emerging opportunities in the intralogistics sector lie in the untapped potential of sustainable automation solutions, focusing on energy efficiency and reduced environmental impact. The integration of AI-powered predictive analytics for inventory management and demand forecasting presents a significant avenue for optimizing warehouse operations. Furthermore, the expansion of flexible and modular automation systems caters to the growing need for adaptable solutions in dynamic market environments. Untapped markets in developing economies, as well as innovative applications in sectors like pharmaceuticals and cold chain logistics, offer substantial growth prospects. The increasing adoption of IoT sensors for real-time asset tracking and condition monitoring within warehouses is also opening new avenues for value creation.
Growth Accelerators in the Intralogistics Industry
Several catalysts are accelerating growth in the intralogistics industry. Technological breakthroughs, particularly in AI, machine learning, and advanced robotics, are enabling more sophisticated and efficient automated solutions. Strategic partnerships between technology providers, integrators, and end-users are fostering innovation and accelerating market adoption. For instance, collaborations between software companies and hardware manufacturers are leading to more integrated and intelligent systems. Market expansion strategies, including the development of affordable and scalable solutions for SMEs and the increasing penetration into emerging economies, are further driving growth. The continuous innovation in AGV and AMR technology, alongside advancements in AS/RS, is also a key growth accelerator.
Key Players Shaping the Intralogistics Market
- Daifuku
- Jungheinrich
- Raymond
- Kion Group
- Interroll
- Korber
- GBI
- DLL
- Smartlog Group
- Rozitek
- Krones
- Lenze
- Intralogika
- Siemens Global
- Bowe Systec
- Alstef Group
- Hänel
- TGW
- SCIO
- Berghof Automation
- GEBHARDT
- Iss Automation
- KNAPP
- VersaBox
- Godrej Koerber
Notable Milestones in Intralogistics Sector
- 2019: Increased adoption of AI-powered WMS for predictive analytics.
- 2020: Surge in demand for automation solutions driven by the pandemic-induced e-commerce boom.
- 2021: Significant investments in robotics and AGV technology to address labor shortages.
- 2022: Launch of more energy-efficient AS/RS solutions with a focus on sustainability.
- 2023: Growing trend of modular and scalable automation solutions for flexible deployment.
- 2024: Enhanced integration of IoT for real-time data monitoring and control in warehouses.
In-Depth Intralogistics Market Outlook
The intralogistics market outlook is exceptionally positive, characterized by sustained growth driven by relentless innovation and increasing industry adoption. Future market potential is immense, fueled by the ongoing digital transformation of supply chains and the persistent demand for optimized operational efficiency. Strategic opportunities abound for companies that can offer integrated, intelligent, and sustainable intralogistics solutions. The continued evolution of robotics, AI, and IoT technologies will be pivotal in shaping the future of warehousing, leading to more autonomous, agile, and data-driven operations. The expanding reach into emerging markets and the development of tailored solutions for specific industry needs will further solidify the market's upward trajectory.
Intralogistics Segmentation
-
1. Application
- 1.1. Logistics
- 1.2. Food & Beverages
- 1.3. Retail & e-Commerce
- 1.4. Airports
- 1.5. Automotive
- 1.6. Chemicals
- 1.7. Industrial Manufacturing
- 1.8. Others
-
2. Types
- 2.1. Automated Storage and Retrieval Systems
- 2.2. Automated Guided Vehicles
- 2.3. Vertical Lift Modules (VLMs)
- 2.4. Sorting Systems
- 2.5. Industrial Robots
- 2.6. Other
Intralogistics Segmentation By Geography
-
1. North America
- 1.1. United States
- 1.2. Canada
- 1.3. Mexico
-
2. South America
- 2.1. Brazil
- 2.2. Argentina
- 2.3. Rest of South America
-
3. Europe
- 3.1. United Kingdom
- 3.2. Germany
- 3.3. France
- 3.4. Italy
- 3.5. Spain
- 3.6. Russia
- 3.7. Benelux
- 3.8. Nordics
- 3.9. Rest of Europe
-
4. Middle East & Africa
- 4.1. Turkey
- 4.2. Israel
- 4.3. GCC
- 4.4. North Africa
- 4.5. South Africa
- 4.6. Rest of Middle East & Africa
-
5. Asia Pacific
- 5.1. China
- 5.2. India
- 5.3. Japan
- 5.4. South Korea
- 5.5. ASEAN
- 5.6. Oceania
- 5.7. Rest of Asia Pacific
Intralogistics REPORT HIGHLIGHTS
| Aspects | Details |
|---|---|
| Study Period | 2019-2033 |
| Base Year | 2024 |
| Estimated Year | 2025 |
| Forecast Period | 2025-2033 |
| Historical Period | 2019-2024 |
| Growth Rate | CAGR of XX% from 2019-2033 |
| Segmentation |
|
Table of Contents
- 1. Introduction
- 1.1. Research Scope
- 1.2. Market Segmentation
- 1.3. Research Methodology
- 1.4. Definitions and Assumptions
- 2. Executive Summary
- 2.1. Introduction
- 3. Market Dynamics
- 3.1. Introduction
- 3.2. Market Drivers
- 3.3. Market Restrains
- 3.4. Market Trends
- 4. Market Factor Analysis
- 4.1. Porters Five Forces
- 4.2. Supply/Value Chain
- 4.3. PESTEL analysis
- 4.4. Market Entropy
- 4.5. Patent/Trademark Analysis
- 5. Global Intralogistics Analysis, Insights and Forecast, 2019-2031
- 5.1. Market Analysis, Insights and Forecast - by Application
- 5.1.1. Logistics
- 5.1.2. Food & Beverages
- 5.1.3. Retail & e-Commerce
- 5.1.4. Airports
- 5.1.5. Automotive
- 5.1.6. Chemicals
- 5.1.7. Industrial Manufacturing
- 5.1.8. Others
- 5.2. Market Analysis, Insights and Forecast - by Types
- 5.2.1. Automated Storage and Retrieval Systems
- 5.2.2. Automated Guided Vehicles
- 5.2.3. Vertical Lift Modules (VLMs)
- 5.2.4. Sorting Systems
- 5.2.5. Industrial Robots
- 5.2.6. Other
- 5.3. Market Analysis, Insights and Forecast - by Region
- 5.3.1. North America
- 5.3.2. South America
- 5.3.3. Europe
- 5.3.4. Middle East & Africa
- 5.3.5. Asia Pacific
- 5.1. Market Analysis, Insights and Forecast - by Application
- 6. North America Intralogistics Analysis, Insights and Forecast, 2019-2031
- 6.1. Market Analysis, Insights and Forecast - by Application
- 6.1.1. Logistics
- 6.1.2. Food & Beverages
- 6.1.3. Retail & e-Commerce
- 6.1.4. Airports
- 6.1.5. Automotive
- 6.1.6. Chemicals
- 6.1.7. Industrial Manufacturing
- 6.1.8. Others
- 6.2. Market Analysis, Insights and Forecast - by Types
- 6.2.1. Automated Storage and Retrieval Systems
- 6.2.2. Automated Guided Vehicles
- 6.2.3. Vertical Lift Modules (VLMs)
- 6.2.4. Sorting Systems
- 6.2.5. Industrial Robots
- 6.2.6. Other
- 6.1. Market Analysis, Insights and Forecast - by Application
- 7. South America Intralogistics Analysis, Insights and Forecast, 2019-2031
- 7.1. Market Analysis, Insights and Forecast - by Application
- 7.1.1. Logistics
- 7.1.2. Food & Beverages
- 7.1.3. Retail & e-Commerce
- 7.1.4. Airports
- 7.1.5. Automotive
- 7.1.6. Chemicals
- 7.1.7. Industrial Manufacturing
- 7.1.8. Others
- 7.2. Market Analysis, Insights and Forecast - by Types
- 7.2.1. Automated Storage and Retrieval Systems
- 7.2.2. Automated Guided Vehicles
- 7.2.3. Vertical Lift Modules (VLMs)
- 7.2.4. Sorting Systems
- 7.2.5. Industrial Robots
- 7.2.6. Other
- 7.1. Market Analysis, Insights and Forecast - by Application
- 8. Europe Intralogistics Analysis, Insights and Forecast, 2019-2031
- 8.1. Market Analysis, Insights and Forecast - by Application
- 8.1.1. Logistics
- 8.1.2. Food & Beverages
- 8.1.3. Retail & e-Commerce
- 8.1.4. Airports
- 8.1.5. Automotive
- 8.1.6. Chemicals
- 8.1.7. Industrial Manufacturing
- 8.1.8. Others
- 8.2. Market Analysis, Insights and Forecast - by Types
- 8.2.1. Automated Storage and Retrieval Systems
- 8.2.2. Automated Guided Vehicles
- 8.2.3. Vertical Lift Modules (VLMs)
- 8.2.4. Sorting Systems
- 8.2.5. Industrial Robots
- 8.2.6. Other
- 8.1. Market Analysis, Insights and Forecast - by Application
- 9. Middle East & Africa Intralogistics Analysis, Insights and Forecast, 2019-2031
- 9.1. Market Analysis, Insights and Forecast - by Application
- 9.1.1. Logistics
- 9.1.2. Food & Beverages
- 9.1.3. Retail & e-Commerce
- 9.1.4. Airports
- 9.1.5. Automotive
- 9.1.6. Chemicals
- 9.1.7. Industrial Manufacturing
- 9.1.8. Others
- 9.2. Market Analysis, Insights and Forecast - by Types
- 9.2.1. Automated Storage and Retrieval Systems
- 9.2.2. Automated Guided Vehicles
- 9.2.3. Vertical Lift Modules (VLMs)
- 9.2.4. Sorting Systems
- 9.2.5. Industrial Robots
- 9.2.6. Other
- 9.1. Market Analysis, Insights and Forecast - by Application
- 10. Asia Pacific Intralogistics Analysis, Insights and Forecast, 2019-2031
- 10.1. Market Analysis, Insights and Forecast - by Application
- 10.1.1. Logistics
- 10.1.2. Food & Beverages
- 10.1.3. Retail & e-Commerce
- 10.1.4. Airports
- 10.1.5. Automotive
- 10.1.6. Chemicals
- 10.1.7. Industrial Manufacturing
- 10.1.8. Others
- 10.2. Market Analysis, Insights and Forecast - by Types
- 10.2.1. Automated Storage and Retrieval Systems
- 10.2.2. Automated Guided Vehicles
- 10.2.3. Vertical Lift Modules (VLMs)
- 10.2.4. Sorting Systems
- 10.2.5. Industrial Robots
- 10.2.6. Other
- 10.1. Market Analysis, Insights and Forecast - by Application
- 11. Competitive Analysis
- 11.1. Global Market Share Analysis 2024
- 11.2. Company Profiles
- 11.2.1 Daifuku
- 11.2.1.1. Overview
- 11.2.1.2. Products
- 11.2.1.3. SWOT Analysis
- 11.2.1.4. Recent Developments
- 11.2.1.5. Financials (Based on Availability)
- 11.2.2 Jungheinrich
- 11.2.2.1. Overview
- 11.2.2.2. Products
- 11.2.2.3. SWOT Analysis
- 11.2.2.4. Recent Developments
- 11.2.2.5. Financials (Based on Availability)
- 11.2.3 Raymond
- 11.2.3.1. Overview
- 11.2.3.2. Products
- 11.2.3.3. SWOT Analysis
- 11.2.3.4. Recent Developments
- 11.2.3.5. Financials (Based on Availability)
- 11.2.4 Kion Group
- 11.2.4.1. Overview
- 11.2.4.2. Products
- 11.2.4.3. SWOT Analysis
- 11.2.4.4. Recent Developments
- 11.2.4.5. Financials (Based on Availability)
- 11.2.5 Interroll
- 11.2.5.1. Overview
- 11.2.5.2. Products
- 11.2.5.3. SWOT Analysis
- 11.2.5.4. Recent Developments
- 11.2.5.5. Financials (Based on Availability)
- 11.2.6 Korber
- 11.2.6.1. Overview
- 11.2.6.2. Products
- 11.2.6.3. SWOT Analysis
- 11.2.6.4. Recent Developments
- 11.2.6.5. Financials (Based on Availability)
- 11.2.7 GBI
- 11.2.7.1. Overview
- 11.2.7.2. Products
- 11.2.7.3. SWOT Analysis
- 11.2.7.4. Recent Developments
- 11.2.7.5. Financials (Based on Availability)
- 11.2.8 DLL
- 11.2.8.1. Overview
- 11.2.8.2. Products
- 11.2.8.3. SWOT Analysis
- 11.2.8.4. Recent Developments
- 11.2.8.5. Financials (Based on Availability)
- 11.2.9 Smartlog Group
- 11.2.9.1. Overview
- 11.2.9.2. Products
- 11.2.9.3. SWOT Analysis
- 11.2.9.4. Recent Developments
- 11.2.9.5. Financials (Based on Availability)
- 11.2.10 Rozitek
- 11.2.10.1. Overview
- 11.2.10.2. Products
- 11.2.10.3. SWOT Analysis
- 11.2.10.4. Recent Developments
- 11.2.10.5. Financials (Based on Availability)
- 11.2.11 Krones
- 11.2.11.1. Overview
- 11.2.11.2. Products
- 11.2.11.3. SWOT Analysis
- 11.2.11.4. Recent Developments
- 11.2.11.5. Financials (Based on Availability)
- 11.2.12 Lenze
- 11.2.12.1. Overview
- 11.2.12.2. Products
- 11.2.12.3. SWOT Analysis
- 11.2.12.4. Recent Developments
- 11.2.12.5. Financials (Based on Availability)
- 11.2.13 Intralogika
- 11.2.13.1. Overview
- 11.2.13.2. Products
- 11.2.13.3. SWOT Analysis
- 11.2.13.4. Recent Developments
- 11.2.13.5. Financials (Based on Availability)
- 11.2.14 Siemens Global
- 11.2.14.1. Overview
- 11.2.14.2. Products
- 11.2.14.3. SWOT Analysis
- 11.2.14.4. Recent Developments
- 11.2.14.5. Financials (Based on Availability)
- 11.2.15 Bowe Systec
- 11.2.15.1. Overview
- 11.2.15.2. Products
- 11.2.15.3. SWOT Analysis
- 11.2.15.4. Recent Developments
- 11.2.15.5. Financials (Based on Availability)
- 11.2.16 Alstef Group
- 11.2.16.1. Overview
- 11.2.16.2. Products
- 11.2.16.3. SWOT Analysis
- 11.2.16.4. Recent Developments
- 11.2.16.5. Financials (Based on Availability)
- 11.2.17 Hänel
- 11.2.17.1. Overview
- 11.2.17.2. Products
- 11.2.17.3. SWOT Analysis
- 11.2.17.4. Recent Developments
- 11.2.17.5. Financials (Based on Availability)
- 11.2.18 TGW
- 11.2.18.1. Overview
- 11.2.18.2. Products
- 11.2.18.3. SWOT Analysis
- 11.2.18.4. Recent Developments
- 11.2.18.5. Financials (Based on Availability)
- 11.2.19 SCIO
- 11.2.19.1. Overview
- 11.2.19.2. Products
- 11.2.19.3. SWOT Analysis
- 11.2.19.4. Recent Developments
- 11.2.19.5. Financials (Based on Availability)
- 11.2.20 Berghof Automation
- 11.2.20.1. Overview
- 11.2.20.2. Products
- 11.2.20.3. SWOT Analysis
- 11.2.20.4. Recent Developments
- 11.2.20.5. Financials (Based on Availability)
- 11.2.21 GEBHARDT
- 11.2.21.1. Overview
- 11.2.21.2. Products
- 11.2.21.3. SWOT Analysis
- 11.2.21.4. Recent Developments
- 11.2.21.5. Financials (Based on Availability)
- 11.2.22 Iss Automation
- 11.2.22.1. Overview
- 11.2.22.2. Products
- 11.2.22.3. SWOT Analysis
- 11.2.22.4. Recent Developments
- 11.2.22.5. Financials (Based on Availability)
- 11.2.23 KNAPP
- 11.2.23.1. Overview
- 11.2.23.2. Products
- 11.2.23.3. SWOT Analysis
- 11.2.23.4. Recent Developments
- 11.2.23.5. Financials (Based on Availability)
- 11.2.24 VersaBox
- 11.2.24.1. Overview
- 11.2.24.2. Products
- 11.2.24.3. SWOT Analysis
- 11.2.24.4. Recent Developments
- 11.2.24.5. Financials (Based on Availability)
- 11.2.25 Godrej Koerber
- 11.2.25.1. Overview
- 11.2.25.2. Products
- 11.2.25.3. SWOT Analysis
- 11.2.25.4. Recent Developments
- 11.2.25.5. Financials (Based on Availability)
- 11.2.1 Daifuku
List of Figures
- Figure 1: Global Intralogistics Revenue Breakdown (million, %) by Region 2024 & 2032
- Figure 2: North America Intralogistics Revenue (million), by Application 2024 & 2032
- Figure 3: North America Intralogistics Revenue Share (%), by Application 2024 & 2032
- Figure 4: North America Intralogistics Revenue (million), by Types 2024 & 2032
- Figure 5: North America Intralogistics Revenue Share (%), by Types 2024 & 2032
- Figure 6: North America Intralogistics Revenue (million), by Country 2024 & 2032
- Figure 7: North America Intralogistics Revenue Share (%), by Country 2024 & 2032
- Figure 8: South America Intralogistics Revenue (million), by Application 2024 & 2032
- Figure 9: South America Intralogistics Revenue Share (%), by Application 2024 & 2032
- Figure 10: South America Intralogistics Revenue (million), by Types 2024 & 2032
- Figure 11: South America Intralogistics Revenue Share (%), by Types 2024 & 2032
- Figure 12: South America Intralogistics Revenue (million), by Country 2024 & 2032
- Figure 13: South America Intralogistics Revenue Share (%), by Country 2024 & 2032
- Figure 14: Europe Intralogistics Revenue (million), by Application 2024 & 2032
- Figure 15: Europe Intralogistics Revenue Share (%), by Application 2024 & 2032
- Figure 16: Europe Intralogistics Revenue (million), by Types 2024 & 2032
- Figure 17: Europe Intralogistics Revenue Share (%), by Types 2024 & 2032
- Figure 18: Europe Intralogistics Revenue (million), by Country 2024 & 2032
- Figure 19: Europe Intralogistics Revenue Share (%), by Country 2024 & 2032
- Figure 20: Middle East & Africa Intralogistics Revenue (million), by Application 2024 & 2032
- Figure 21: Middle East & Africa Intralogistics Revenue Share (%), by Application 2024 & 2032
- Figure 22: Middle East & Africa Intralogistics Revenue (million), by Types 2024 & 2032
- Figure 23: Middle East & Africa Intralogistics Revenue Share (%), by Types 2024 & 2032
- Figure 24: Middle East & Africa Intralogistics Revenue (million), by Country 2024 & 2032
- Figure 25: Middle East & Africa Intralogistics Revenue Share (%), by Country 2024 & 2032
- Figure 26: Asia Pacific Intralogistics Revenue (million), by Application 2024 & 2032
- Figure 27: Asia Pacific Intralogistics Revenue Share (%), by Application 2024 & 2032
- Figure 28: Asia Pacific Intralogistics Revenue (million), by Types 2024 & 2032
- Figure 29: Asia Pacific Intralogistics Revenue Share (%), by Types 2024 & 2032
- Figure 30: Asia Pacific Intralogistics Revenue (million), by Country 2024 & 2032
- Figure 31: Asia Pacific Intralogistics Revenue Share (%), by Country 2024 & 2032
List of Tables
- Table 1: Global Intralogistics Revenue million Forecast, by Region 2019 & 2032
- Table 2: Global Intralogistics Revenue million Forecast, by Application 2019 & 2032
- Table 3: Global Intralogistics Revenue million Forecast, by Types 2019 & 2032
- Table 4: Global Intralogistics Revenue million Forecast, by Region 2019 & 2032
- Table 5: Global Intralogistics Revenue million Forecast, by Application 2019 & 2032
- Table 6: Global Intralogistics Revenue million Forecast, by Types 2019 & 2032
- Table 7: Global Intralogistics Revenue million Forecast, by Country 2019 & 2032
- Table 8: United States Intralogistics Revenue (million) Forecast, by Application 2019 & 2032
- Table 9: Canada Intralogistics Revenue (million) Forecast, by Application 2019 & 2032
- Table 10: Mexico Intralogistics Revenue (million) Forecast, by Application 2019 & 2032
- Table 11: Global Intralogistics Revenue million Forecast, by Application 2019 & 2032
- Table 12: Global Intralogistics Revenue million Forecast, by Types 2019 & 2032
- Table 13: Global Intralogistics Revenue million Forecast, by Country 2019 & 2032
- Table 14: Brazil Intralogistics Revenue (million) Forecast, by Application 2019 & 2032
- Table 15: Argentina Intralogistics Revenue (million) Forecast, by Application 2019 & 2032
- Table 16: Rest of South America Intralogistics Revenue (million) Forecast, by Application 2019 & 2032
- Table 17: Global Intralogistics Revenue million Forecast, by Application 2019 & 2032
- Table 18: Global Intralogistics Revenue million Forecast, by Types 2019 & 2032
- Table 19: Global Intralogistics Revenue million Forecast, by Country 2019 & 2032
- Table 20: United Kingdom Intralogistics Revenue (million) Forecast, by Application 2019 & 2032
- Table 21: Germany Intralogistics Revenue (million) Forecast, by Application 2019 & 2032
- Table 22: France Intralogistics Revenue (million) Forecast, by Application 2019 & 2032
- Table 23: Italy Intralogistics Revenue (million) Forecast, by Application 2019 & 2032
- Table 24: Spain Intralogistics Revenue (million) Forecast, by Application 2019 & 2032
- Table 25: Russia Intralogistics Revenue (million) Forecast, by Application 2019 & 2032
- Table 26: Benelux Intralogistics Revenue (million) Forecast, by Application 2019 & 2032
- Table 27: Nordics Intralogistics Revenue (million) Forecast, by Application 2019 & 2032
- Table 28: Rest of Europe Intralogistics Revenue (million) Forecast, by Application 2019 & 2032
- Table 29: Global Intralogistics Revenue million Forecast, by Application 2019 & 2032
- Table 30: Global Intralogistics Revenue million Forecast, by Types 2019 & 2032
- Table 31: Global Intralogistics Revenue million Forecast, by Country 2019 & 2032
- Table 32: Turkey Intralogistics Revenue (million) Forecast, by Application 2019 & 2032
- Table 33: Israel Intralogistics Revenue (million) Forecast, by Application 2019 & 2032
- Table 34: GCC Intralogistics Revenue (million) Forecast, by Application 2019 & 2032
- Table 35: North Africa Intralogistics Revenue (million) Forecast, by Application 2019 & 2032
- Table 36: South Africa Intralogistics Revenue (million) Forecast, by Application 2019 & 2032
- Table 37: Rest of Middle East & Africa Intralogistics Revenue (million) Forecast, by Application 2019 & 2032
- Table 38: Global Intralogistics Revenue million Forecast, by Application 2019 & 2032
- Table 39: Global Intralogistics Revenue million Forecast, by Types 2019 & 2032
- Table 40: Global Intralogistics Revenue million Forecast, by Country 2019 & 2032
- Table 41: China Intralogistics Revenue (million) Forecast, by Application 2019 & 2032
- Table 42: India Intralogistics Revenue (million) Forecast, by Application 2019 & 2032
- Table 43: Japan Intralogistics Revenue (million) Forecast, by Application 2019 & 2032
- Table 44: South Korea Intralogistics Revenue (million) Forecast, by Application 2019 & 2032
- Table 45: ASEAN Intralogistics Revenue (million) Forecast, by Application 2019 & 2032
- Table 46: Oceania Intralogistics Revenue (million) Forecast, by Application 2019 & 2032
- Table 47: Rest of Asia Pacific Intralogistics Revenue (million) Forecast, by Application 2019 & 2032
Frequently Asked Questions
1. What is the projected Compound Annual Growth Rate (CAGR) of the Intralogistics?
The projected CAGR is approximately XX%.
2. Which companies are prominent players in the Intralogistics?
Key companies in the market include Daifuku, Jungheinrich, Raymond, Kion Group, Interroll, Korber, GBI, DLL, Smartlog Group, Rozitek, Krones, Lenze, Intralogika, Siemens Global, Bowe Systec, Alstef Group, Hänel, TGW, SCIO, Berghof Automation, GEBHARDT, Iss Automation, KNAPP, VersaBox, Godrej Koerber.
3. What are the main segments of the Intralogistics?
The market segments include Application, Types.
4. Can you provide details about the market size?
The market size is estimated to be USD XXX million as of 2022.
5. What are some drivers contributing to market growth?
N/A
6. What are the notable trends driving market growth?
N/A
7. Are there any restraints impacting market growth?
N/A
8. Can you provide examples of recent developments in the market?
N/A
9. What pricing options are available for accessing the report?
Pricing options include single-user, multi-user, and enterprise licenses priced at USD 3350.00, USD 5025.00, and USD 6700.00 respectively.
10. Is the market size provided in terms of value or volume?
The market size is provided in terms of value, measured in million.
11. Are there any specific market keywords associated with the report?
Yes, the market keyword associated with the report is "Intralogistics," which aids in identifying and referencing the specific market segment covered.
12. How do I determine which pricing option suits my needs best?
The pricing options vary based on user requirements and access needs. Individual users may opt for single-user licenses, while businesses requiring broader access may choose multi-user or enterprise licenses for cost-effective access to the report.
13. Are there any additional resources or data provided in the Intralogistics report?
While the report offers comprehensive insights, it's advisable to review the specific contents or supplementary materials provided to ascertain if additional resources or data are available.
14. How can I stay updated on further developments or reports in the Intralogistics?
To stay informed about further developments, trends, and reports in the Intralogistics, consider subscribing to industry newsletters, following relevant companies and organizations, or regularly checking reputable industry news sources and publications.
Methodology
Step 1 - Identification of Relevant Samples Size from Population Database


Step 2 - Approaches for Defining Global Market Size (Value, Volume* & Price*)

Note*: In applicable scenarios
Step 3 - Data Sources
Primary Research
- Web Analytics
- Survey Reports
- Research Institute
- Latest Research Reports
- Opinion Leaders
Secondary Research
- Annual Reports
- White Paper
- Latest Press Release
- Industry Association
- Paid Database
- Investor Presentations

Step 4 - Data Triangulation
Involves using different sources of information in order to increase the validity of a study
These sources are likely to be stakeholders in a program - participants, other researchers, program staff, other community members, and so on.
Then we put all data in single framework & apply various statistical tools to find out the dynamic on the market.
During the analysis stage, feedback from the stakeholder groups would be compared to determine areas of agreement as well as areas of divergence
