

Key Insights
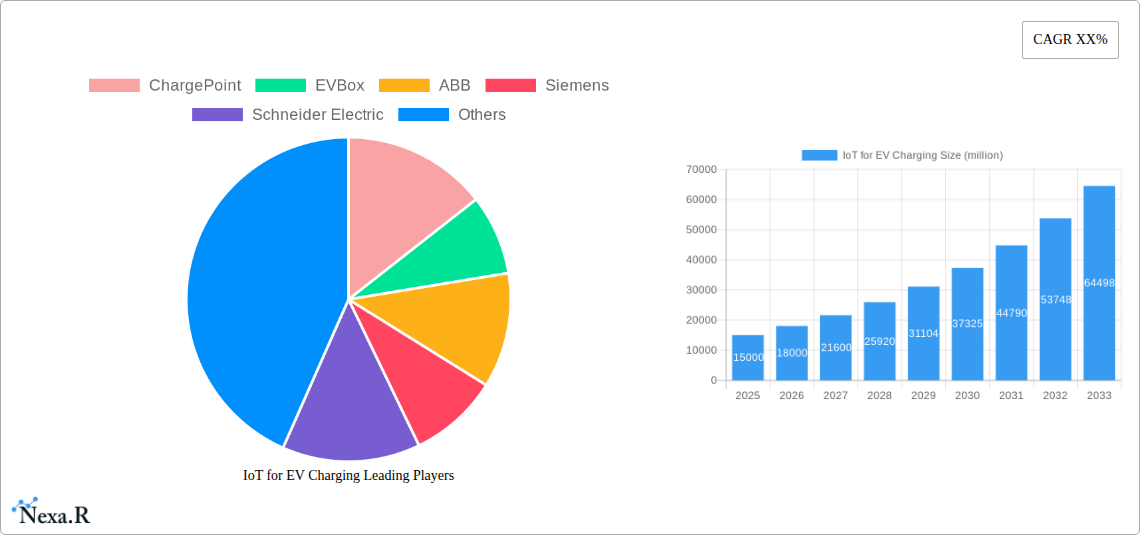
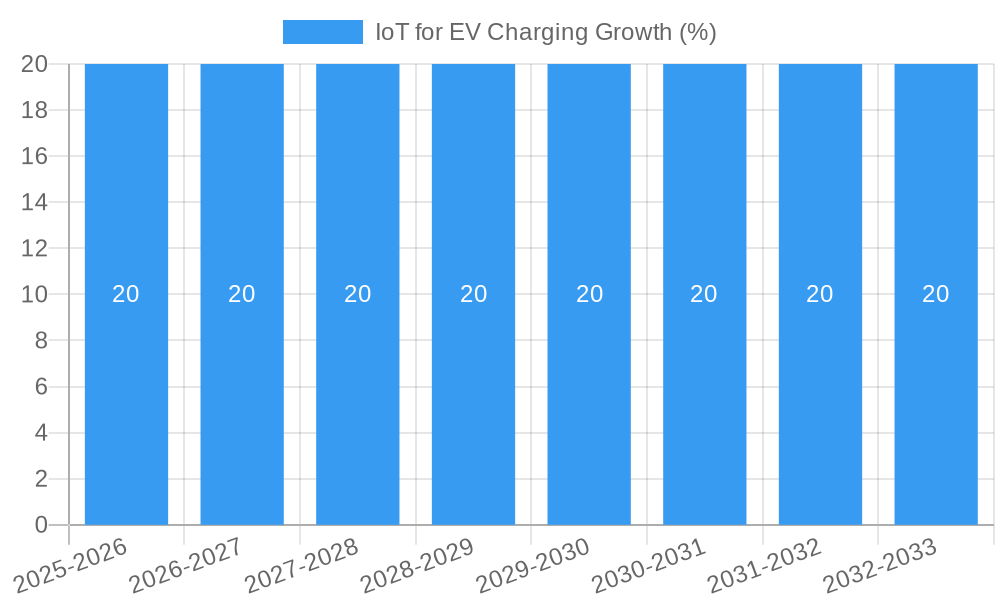
The global IoT for EV Charging market is poised for substantial expansion, projected to reach approximately $15,000 million by 2025, with a robust Compound Annual Growth Rate (CAGR) of around 20% anticipated throughout the forecast period (2025-2033). This significant growth is fueled by the accelerating adoption of electric vehicles globally, driven by increasing environmental consciousness, supportive government regulations, and declining battery costs. The integration of IoT technology is crucial for optimizing the EV charging experience, enabling features such as smart grid integration, dynamic load balancing, remote monitoring and control, and seamless payment solutions. These advancements are vital for managing the burgeoning demand on the electricity grid and ensuring the efficient deployment and operation of charging infrastructure. The market is segmented across various applications, including residential, commercial, and public charging, each presenting unique opportunities and challenges for IoT integration.
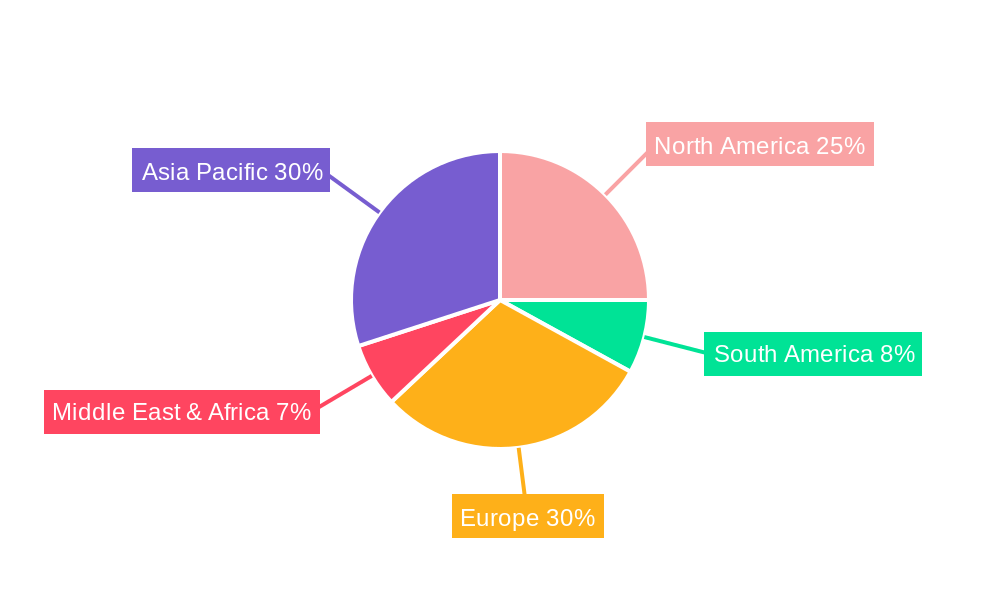
Key drivers propelling this market forward include the growing need for intelligent charging solutions that can effectively manage the load on the grid and reduce energy costs. Innovations in charging settlement, advanced data analytics for usage patterns, and sophisticated remote control capabilities are transforming the EV charging landscape. While the market is experiencing rapid growth, certain restraints, such as the high initial investment costs for IoT-enabled charging infrastructure and cybersecurity concerns, need to be addressed. Nevertheless, the continuous development of smart charging technologies, coupled with the expansion of EV charging networks by leading companies like ChargePoint, EVBox, ABB, and Siemens, indicates a bright future. Regional market dynamics are expected to be led by Asia Pacific, particularly China and India, owing to their massive EV market penetration and government initiatives, followed by Europe and North America, all of which are investing heavily in smart charging solutions.
This comprehensive report delves into the burgeoning IoT for EV Charging market, a critical component of the global electric vehicle (EV) ecosystem. Analyzing market dynamics, growth trends, regional dominance, product innovation, and key players from 2019–2033, this study provides invaluable insights for stakeholders seeking to capitalize on the transformative power of connected charging solutions. With a base year of 2025 and an extensive forecast period of 2025–2033, this report offers a forward-looking perspective on a rapidly evolving industry. We examine parent and child market segments, including Residential Charging, Commercial Charging, and Public Charging applications, and key types such as Charging Settlement, Data Analysis, Remote Control, and Others.
IoT for EV Charging Market Dynamics & Structure
The IoT for EV Charging market exhibits a moderately concentrated structure, with leading players like ChargePoint, EVBox, ABB, Siemens, and Schneider Electric dominating innovation and deployment. Technological innovation is primarily driven by advancements in connectivity (5G, LoRaWAN), AI for smart grid integration and load balancing, and secure payment systems. Regulatory frameworks, particularly those promoting EV adoption and smart grid mandates, significantly influence market penetration. Competitive product substitutes include non-IoT enabled charging stations and traditional fossil fuel refueling, though the convenience and data-driven insights of IoT solutions are increasingly differentiating them. End-user demographics are shifting from early adopters to a broader consumer base, with a growing demand for seamless charging experiences. Merger and acquisition (M&A) trends are on the rise as larger energy and technology companies seek to integrate EV charging infrastructure into their portfolios, with an estimated 15 M&A deals recorded between 2022 and 2024. Barriers to innovation include the high cost of initial infrastructure deployment and the complexity of interoperability standards across different charging networks and vehicle models.
IoT for EV Charging Growth Trends & Insights
The IoT for EV Charging market is poised for exponential growth, projected to reach USD 25,000 million by 2033, exhibiting a robust Compound Annual Growth Rate (CAGR) of 18.5% from 2025 to 2033. This significant expansion is fueled by the accelerating adoption of electric vehicles globally, driven by government incentives, environmental concerns, and decreasing battery costs. The market penetration of IoT-enabled EV charging solutions is expected to surge from 25% in 2025 to 60% by 2033. Technological disruptions, such as the integration of vehicle-to-grid (V2G) capabilities, smart charging algorithms optimizing energy consumption and grid stability, and enhanced cybersecurity measures, are transforming the user experience. Consumer behavior is evolving, with a greater expectation for convenient, app-based charging management, real-time status updates, and integrated payment solutions. The increasing demand for data analytics to optimize charging station utilization, predict maintenance needs, and inform grid management strategies further propels market expansion. The growth of smart cities initiatives and the integration of EV charging into broader energy management systems also contribute to this upward trajectory. The market size for IoT for EV Charging was an estimated USD 7,500 million in 2025.
Dominant Regions, Countries, or Segments in IoT for EV Charging
North America, particularly the United States, is emerging as a dominant region in the IoT for EV Charging market, driven by proactive government policies, substantial investments in EV infrastructure, and a high rate of EV adoption. Within North America, California leads in charging infrastructure deployment and smart grid integration initiatives. The Public Charging segment is a significant growth driver, accounting for an estimated 40% of the total market share in 2025, due to increasing demand from ride-sharing services, fleet operators, and public access points. Charging Settlement and Data Analysis are critical types within this segment, projected to grow at a CAGR of 19.2% and 18.8% respectively, as efficient billing and intelligent network management become paramount. Key drivers include federal tax credits for charging infrastructure, state-level mandates for zero-emission vehicle sales, and the proactive expansion of charging networks by companies like ChargePoint and Shell Recharge. The market share of Public Charging is expected to reach 45% by 2033. Economic policies promoting renewable energy integration and the development of smart grids further bolster this dominance. The United States is projected to hold a 30% market share of the global IoT for EV Charging market by 2033.
IoT for EV Charging Product Landscape
The IoT for EV Charging product landscape is characterized by intelligent, connected charging solutions offering advanced features. Innovations focus on bidirectional charging capabilities, allowing EVs to feed power back into the grid, and smart scheduling for optimized energy tariffs. Performance metrics are measured by charging speed, grid interaction capabilities, and user experience through intuitive mobile applications. Unique selling propositions include seamless integration with smart home ecosystems, real-time diagnostics for predictive maintenance, and secure, contactless payment options. Technological advancements in wireless charging, battery management integration, and AI-driven load balancing are further enhancing product offerings.
Key Drivers, Barriers & Challenges in IoT for EV Charging
Key Drivers:
- Rapid EV Adoption: Government incentives, falling battery costs, and growing environmental awareness are accelerating EV sales, directly boosting demand for charging infrastructure.
- Smart Grid Integration: The need for grid stability and efficient energy management is driving the adoption of IoT-enabled charging for load balancing and V2G capabilities.
- Technological Advancements: Innovations in connectivity, AI, and data analytics are enhancing the functionality and user experience of EV charging solutions.
- Commercial Fleet Electrification: Businesses are electrifying their fleets, creating a significant demand for scalable and managed charging solutions.
Barriers & Challenges:
- High Initial Investment: The cost of deploying robust IoT infrastructure and smart chargers can be substantial, posing a barrier for smaller operators and consumers.
- Interoperability Standards: Lack of universal standards across different charging networks and vehicle manufacturers can create fragmentation and user inconvenience.
- Cybersecurity Threats: Connected charging stations are vulnerable to cyberattacks, necessitating robust security measures.
- Regulatory Uncertainty: Evolving regulations and differing policies across regions can slow down widespread adoption.
- Grid Capacity Limitations: In certain areas, the existing grid infrastructure may struggle to support a large influx of EV charging demand without significant upgrades.
Emerging Opportunities in IoT for EV Charging
Emerging opportunities lie in the development of decentralized energy networks and microgrids where EV batteries play a crucial role in energy storage and distribution. The expansion of charging solutions for heavy-duty vehicles and commercial fleets presents a significant untapped market. Furthermore, the integration of IoT for EV charging with smart city initiatives, enabling vehicle-to-everything (V2X) communication for traffic management and public safety, offers substantial growth potential. The increasing demand for mobile and portable charging solutions, particularly in underserved regions, also represents an emerging niche.
Growth Accelerators in the IoT for EV Charging Industry
Several factors are acting as growth accelerators for the IoT for EV Charging industry. The continuous innovation in battery technology, leading to longer EV ranges and faster charging times, directly fuels the demand for advanced charging infrastructure. Strategic partnerships between EV manufacturers, charging infrastructure providers, and energy utilities are crucial for creating integrated ecosystems and streamlining the user experience. Market expansion strategies, including global rollout of smart charging solutions and the development of tailored offerings for different geographical and economic contexts, are also key. The increasing focus on sustainability and the circular economy is driving the development of charging solutions that utilize renewable energy sources and support grid balancing.
Key Players Shaping the IoT for EV Charging Market
- ChargePoint
- EVBox
- ABB
- Siemens
- Schneider Electric
- Webasto
- Delta Electronics
- Shell Recharge
- BeiLai Technology
- Tele2 IoT
- Emnify
- Zaptec
- Hypercharge
- GreenFlux
- Pod Point
- Clenergy EV
- SparkCharge
Notable Milestones in IoT for EV Charging Sector
- 2021: ChargePoint goes public, signaling increased investor confidence in the EV charging market.
- 2022: ABB launches its Terra 360 kW charger, setting new benchmarks for ultra-fast charging.
- 2023 (Q2): Tele2 IoT partners with a major automotive manufacturer to deploy connected charging solutions across Europe.
- 2023 (Q4): Siemens announces significant investment in smart grid technology for EV charging integration.
- 2024 (Q1): Emnify secures Series B funding to expand its global IoT connectivity platform for EV charging.
- 2024 (Q3): GreenFlux announces expansion into new markets, focusing on fleet charging solutions.
- 2025 (est. Q1): Major utility companies are expected to launch pilot programs for V2G services powered by IoT charging.
In-Depth IoT for EV Charging Market Outlook
The future of the IoT for EV Charging market is exceptionally promising, driven by a confluence of technological advancements, supportive policies, and evolving consumer demands. Growth accelerators, including advancements in AI for predictive charging and grid optimization, alongside the increasing integration of renewable energy sources, will further solidify its trajectory. Strategic partnerships will continue to be pivotal in creating seamless charging experiences and expanding infrastructure reach. The market is set to witness a significant shift towards more intelligent, interconnected, and sustainable charging solutions, transforming the EV ownership experience and contributing significantly to a cleaner energy future.
IoT for EV Charging Segmentation
-
1. Application
- 1.1. Residential Charging
- 1.2. Commercial Charging
- 1.3. Public Charging
-
2. Types
- 2.1. Charging Settlement
- 2.2. Data Analysis
- 2.3. Remote Control
- 2.4. Others
IoT for EV Charging Segmentation By Geography
-
1. North America
- 1.1. United States
- 1.2. Canada
- 1.3. Mexico
-
2. South America
- 2.1. Brazil
- 2.2. Argentina
- 2.3. Rest of South America
-
3. Europe
- 3.1. United Kingdom
- 3.2. Germany
- 3.3. France
- 3.4. Italy
- 3.5. Spain
- 3.6. Russia
- 3.7. Benelux
- 3.8. Nordics
- 3.9. Rest of Europe
-
4. Middle East & Africa
- 4.1. Turkey
- 4.2. Israel
- 4.3. GCC
- 4.4. North Africa
- 4.5. South Africa
- 4.6. Rest of Middle East & Africa
-
5. Asia Pacific
- 5.1. China
- 5.2. India
- 5.3. Japan
- 5.4. South Korea
- 5.5. ASEAN
- 5.6. Oceania
- 5.7. Rest of Asia Pacific
IoT for EV Charging REPORT HIGHLIGHTS
| Aspects | Details |
|---|---|
| Study Period | 2019-2033 |
| Base Year | 2024 |
| Estimated Year | 2025 |
| Forecast Period | 2025-2033 |
| Historical Period | 2019-2024 |
| Growth Rate | CAGR of XX% from 2019-2033 |
| Segmentation |
|
Table of Contents
- 1. Introduction
- 1.1. Research Scope
- 1.2. Market Segmentation
- 1.3. Research Methodology
- 1.4. Definitions and Assumptions
- 2. Executive Summary
- 2.1. Introduction
- 3. Market Dynamics
- 3.1. Introduction
- 3.2. Market Drivers
- 3.3. Market Restrains
- 3.4. Market Trends
- 4. Market Factor Analysis
- 4.1. Porters Five Forces
- 4.2. Supply/Value Chain
- 4.3. PESTEL analysis
- 4.4. Market Entropy
- 4.5. Patent/Trademark Analysis
- 5. Global IoT for EV Charging Analysis, Insights and Forecast, 2019-2031
- 5.1. Market Analysis, Insights and Forecast - by Application
- 5.1.1. Residential Charging
- 5.1.2. Commercial Charging
- 5.1.3. Public Charging
- 5.2. Market Analysis, Insights and Forecast - by Types
- 5.2.1. Charging Settlement
- 5.2.2. Data Analysis
- 5.2.3. Remote Control
- 5.2.4. Others
- 5.3. Market Analysis, Insights and Forecast - by Region
- 5.3.1. North America
- 5.3.2. South America
- 5.3.3. Europe
- 5.3.4. Middle East & Africa
- 5.3.5. Asia Pacific
- 5.1. Market Analysis, Insights and Forecast - by Application
- 6. North America IoT for EV Charging Analysis, Insights and Forecast, 2019-2031
- 6.1. Market Analysis, Insights and Forecast - by Application
- 6.1.1. Residential Charging
- 6.1.2. Commercial Charging
- 6.1.3. Public Charging
- 6.2. Market Analysis, Insights and Forecast - by Types
- 6.2.1. Charging Settlement
- 6.2.2. Data Analysis
- 6.2.3. Remote Control
- 6.2.4. Others
- 6.1. Market Analysis, Insights and Forecast - by Application
- 7. South America IoT for EV Charging Analysis, Insights and Forecast, 2019-2031
- 7.1. Market Analysis, Insights and Forecast - by Application
- 7.1.1. Residential Charging
- 7.1.2. Commercial Charging
- 7.1.3. Public Charging
- 7.2. Market Analysis, Insights and Forecast - by Types
- 7.2.1. Charging Settlement
- 7.2.2. Data Analysis
- 7.2.3. Remote Control
- 7.2.4. Others
- 7.1. Market Analysis, Insights and Forecast - by Application
- 8. Europe IoT for EV Charging Analysis, Insights and Forecast, 2019-2031
- 8.1. Market Analysis, Insights and Forecast - by Application
- 8.1.1. Residential Charging
- 8.1.2. Commercial Charging
- 8.1.3. Public Charging
- 8.2. Market Analysis, Insights and Forecast - by Types
- 8.2.1. Charging Settlement
- 8.2.2. Data Analysis
- 8.2.3. Remote Control
- 8.2.4. Others
- 8.1. Market Analysis, Insights and Forecast - by Application
- 9. Middle East & Africa IoT for EV Charging Analysis, Insights and Forecast, 2019-2031
- 9.1. Market Analysis, Insights and Forecast - by Application
- 9.1.1. Residential Charging
- 9.1.2. Commercial Charging
- 9.1.3. Public Charging
- 9.2. Market Analysis, Insights and Forecast - by Types
- 9.2.1. Charging Settlement
- 9.2.2. Data Analysis
- 9.2.3. Remote Control
- 9.2.4. Others
- 9.1. Market Analysis, Insights and Forecast - by Application
- 10. Asia Pacific IoT for EV Charging Analysis, Insights and Forecast, 2019-2031
- 10.1. Market Analysis, Insights and Forecast - by Application
- 10.1.1. Residential Charging
- 10.1.2. Commercial Charging
- 10.1.3. Public Charging
- 10.2. Market Analysis, Insights and Forecast - by Types
- 10.2.1. Charging Settlement
- 10.2.2. Data Analysis
- 10.2.3. Remote Control
- 10.2.4. Others
- 10.1. Market Analysis, Insights and Forecast - by Application
- 11. Competitive Analysis
- 11.1. Global Market Share Analysis 2024
- 11.2. Company Profiles
- 11.2.1 ChargePoint
- 11.2.1.1. Overview
- 11.2.1.2. Products
- 11.2.1.3. SWOT Analysis
- 11.2.1.4. Recent Developments
- 11.2.1.5. Financials (Based on Availability)
- 11.2.2 EVBox
- 11.2.2.1. Overview
- 11.2.2.2. Products
- 11.2.2.3. SWOT Analysis
- 11.2.2.4. Recent Developments
- 11.2.2.5. Financials (Based on Availability)
- 11.2.3 ABB
- 11.2.3.1. Overview
- 11.2.3.2. Products
- 11.2.3.3. SWOT Analysis
- 11.2.3.4. Recent Developments
- 11.2.3.5. Financials (Based on Availability)
- 11.2.4 Siemens
- 11.2.4.1. Overview
- 11.2.4.2. Products
- 11.2.4.3. SWOT Analysis
- 11.2.4.4. Recent Developments
- 11.2.4.5. Financials (Based on Availability)
- 11.2.5 Schneider Electric
- 11.2.5.1. Overview
- 11.2.5.2. Products
- 11.2.5.3. SWOT Analysis
- 11.2.5.4. Recent Developments
- 11.2.5.5. Financials (Based on Availability)
- 11.2.6 Webasto
- 11.2.6.1. Overview
- 11.2.6.2. Products
- 11.2.6.3. SWOT Analysis
- 11.2.6.4. Recent Developments
- 11.2.6.5. Financials (Based on Availability)
- 11.2.7 Delta Electronics
- 11.2.7.1. Overview
- 11.2.7.2. Products
- 11.2.7.3. SWOT Analysis
- 11.2.7.4. Recent Developments
- 11.2.7.5. Financials (Based on Availability)
- 11.2.8 Shell Recharge
- 11.2.8.1. Overview
- 11.2.8.2. Products
- 11.2.8.3. SWOT Analysis
- 11.2.8.4. Recent Developments
- 11.2.8.5. Financials (Based on Availability)
- 11.2.9 BeiLai Technology
- 11.2.9.1. Overview
- 11.2.9.2. Products
- 11.2.9.3. SWOT Analysis
- 11.2.9.4. Recent Developments
- 11.2.9.5. Financials (Based on Availability)
- 11.2.10 Tele2 IoT
- 11.2.10.1. Overview
- 11.2.10.2. Products
- 11.2.10.3. SWOT Analysis
- 11.2.10.4. Recent Developments
- 11.2.10.5. Financials (Based on Availability)
- 11.2.11 Emnify
- 11.2.11.1. Overview
- 11.2.11.2. Products
- 11.2.11.3. SWOT Analysis
- 11.2.11.4. Recent Developments
- 11.2.11.5. Financials (Based on Availability)
- 11.2.12 Zaptec
- 11.2.12.1. Overview
- 11.2.12.2. Products
- 11.2.12.3. SWOT Analysis
- 11.2.12.4. Recent Developments
- 11.2.12.5. Financials (Based on Availability)
- 11.2.13 Hypercharge
- 11.2.13.1. Overview
- 11.2.13.2. Products
- 11.2.13.3. SWOT Analysis
- 11.2.13.4. Recent Developments
- 11.2.13.5. Financials (Based on Availability)
- 11.2.14 GreenFlux
- 11.2.14.1. Overview
- 11.2.14.2. Products
- 11.2.14.3. SWOT Analysis
- 11.2.14.4. Recent Developments
- 11.2.14.5. Financials (Based on Availability)
- 11.2.15 Pod Point
- 11.2.15.1. Overview
- 11.2.15.2. Products
- 11.2.15.3. SWOT Analysis
- 11.2.15.4. Recent Developments
- 11.2.15.5. Financials (Based on Availability)
- 11.2.16 Clenergy EV
- 11.2.16.1. Overview
- 11.2.16.2. Products
- 11.2.16.3. SWOT Analysis
- 11.2.16.4. Recent Developments
- 11.2.16.5. Financials (Based on Availability)
- 11.2.17 SparkCharge
- 11.2.17.1. Overview
- 11.2.17.2. Products
- 11.2.17.3. SWOT Analysis
- 11.2.17.4. Recent Developments
- 11.2.17.5. Financials (Based on Availability)
- 11.2.1 ChargePoint
List of Figures
- Figure 1: Global IoT for EV Charging Revenue Breakdown (million, %) by Region 2024 & 2032
- Figure 2: North America IoT for EV Charging Revenue (million), by Application 2024 & 2032
- Figure 3: North America IoT for EV Charging Revenue Share (%), by Application 2024 & 2032
- Figure 4: North America IoT for EV Charging Revenue (million), by Types 2024 & 2032
- Figure 5: North America IoT for EV Charging Revenue Share (%), by Types 2024 & 2032
- Figure 6: North America IoT for EV Charging Revenue (million), by Country 2024 & 2032
- Figure 7: North America IoT for EV Charging Revenue Share (%), by Country 2024 & 2032
- Figure 8: South America IoT for EV Charging Revenue (million), by Application 2024 & 2032
- Figure 9: South America IoT for EV Charging Revenue Share (%), by Application 2024 & 2032
- Figure 10: South America IoT for EV Charging Revenue (million), by Types 2024 & 2032
- Figure 11: South America IoT for EV Charging Revenue Share (%), by Types 2024 & 2032
- Figure 12: South America IoT for EV Charging Revenue (million), by Country 2024 & 2032
- Figure 13: South America IoT for EV Charging Revenue Share (%), by Country 2024 & 2032
- Figure 14: Europe IoT for EV Charging Revenue (million), by Application 2024 & 2032
- Figure 15: Europe IoT for EV Charging Revenue Share (%), by Application 2024 & 2032
- Figure 16: Europe IoT for EV Charging Revenue (million), by Types 2024 & 2032
- Figure 17: Europe IoT for EV Charging Revenue Share (%), by Types 2024 & 2032
- Figure 18: Europe IoT for EV Charging Revenue (million), by Country 2024 & 2032
- Figure 19: Europe IoT for EV Charging Revenue Share (%), by Country 2024 & 2032
- Figure 20: Middle East & Africa IoT for EV Charging Revenue (million), by Application 2024 & 2032
- Figure 21: Middle East & Africa IoT for EV Charging Revenue Share (%), by Application 2024 & 2032
- Figure 22: Middle East & Africa IoT for EV Charging Revenue (million), by Types 2024 & 2032
- Figure 23: Middle East & Africa IoT for EV Charging Revenue Share (%), by Types 2024 & 2032
- Figure 24: Middle East & Africa IoT for EV Charging Revenue (million), by Country 2024 & 2032
- Figure 25: Middle East & Africa IoT for EV Charging Revenue Share (%), by Country 2024 & 2032
- Figure 26: Asia Pacific IoT for EV Charging Revenue (million), by Application 2024 & 2032
- Figure 27: Asia Pacific IoT for EV Charging Revenue Share (%), by Application 2024 & 2032
- Figure 28: Asia Pacific IoT for EV Charging Revenue (million), by Types 2024 & 2032
- Figure 29: Asia Pacific IoT for EV Charging Revenue Share (%), by Types 2024 & 2032
- Figure 30: Asia Pacific IoT for EV Charging Revenue (million), by Country 2024 & 2032
- Figure 31: Asia Pacific IoT for EV Charging Revenue Share (%), by Country 2024 & 2032
List of Tables
- Table 1: Global IoT for EV Charging Revenue million Forecast, by Region 2019 & 2032
- Table 2: Global IoT for EV Charging Revenue million Forecast, by Application 2019 & 2032
- Table 3: Global IoT for EV Charging Revenue million Forecast, by Types 2019 & 2032
- Table 4: Global IoT for EV Charging Revenue million Forecast, by Region 2019 & 2032
- Table 5: Global IoT for EV Charging Revenue million Forecast, by Application 2019 & 2032
- Table 6: Global IoT for EV Charging Revenue million Forecast, by Types 2019 & 2032
- Table 7: Global IoT for EV Charging Revenue million Forecast, by Country 2019 & 2032
- Table 8: United States IoT for EV Charging Revenue (million) Forecast, by Application 2019 & 2032
- Table 9: Canada IoT for EV Charging Revenue (million) Forecast, by Application 2019 & 2032
- Table 10: Mexico IoT for EV Charging Revenue (million) Forecast, by Application 2019 & 2032
- Table 11: Global IoT for EV Charging Revenue million Forecast, by Application 2019 & 2032
- Table 12: Global IoT for EV Charging Revenue million Forecast, by Types 2019 & 2032
- Table 13: Global IoT for EV Charging Revenue million Forecast, by Country 2019 & 2032
- Table 14: Brazil IoT for EV Charging Revenue (million) Forecast, by Application 2019 & 2032
- Table 15: Argentina IoT for EV Charging Revenue (million) Forecast, by Application 2019 & 2032
- Table 16: Rest of South America IoT for EV Charging Revenue (million) Forecast, by Application 2019 & 2032
- Table 17: Global IoT for EV Charging Revenue million Forecast, by Application 2019 & 2032
- Table 18: Global IoT for EV Charging Revenue million Forecast, by Types 2019 & 2032
- Table 19: Global IoT for EV Charging Revenue million Forecast, by Country 2019 & 2032
- Table 20: United Kingdom IoT for EV Charging Revenue (million) Forecast, by Application 2019 & 2032
- Table 21: Germany IoT for EV Charging Revenue (million) Forecast, by Application 2019 & 2032
- Table 22: France IoT for EV Charging Revenue (million) Forecast, by Application 2019 & 2032
- Table 23: Italy IoT for EV Charging Revenue (million) Forecast, by Application 2019 & 2032
- Table 24: Spain IoT for EV Charging Revenue (million) Forecast, by Application 2019 & 2032
- Table 25: Russia IoT for EV Charging Revenue (million) Forecast, by Application 2019 & 2032
- Table 26: Benelux IoT for EV Charging Revenue (million) Forecast, by Application 2019 & 2032
- Table 27: Nordics IoT for EV Charging Revenue (million) Forecast, by Application 2019 & 2032
- Table 28: Rest of Europe IoT for EV Charging Revenue (million) Forecast, by Application 2019 & 2032
- Table 29: Global IoT for EV Charging Revenue million Forecast, by Application 2019 & 2032
- Table 30: Global IoT for EV Charging Revenue million Forecast, by Types 2019 & 2032
- Table 31: Global IoT for EV Charging Revenue million Forecast, by Country 2019 & 2032
- Table 32: Turkey IoT for EV Charging Revenue (million) Forecast, by Application 2019 & 2032
- Table 33: Israel IoT for EV Charging Revenue (million) Forecast, by Application 2019 & 2032
- Table 34: GCC IoT for EV Charging Revenue (million) Forecast, by Application 2019 & 2032
- Table 35: North Africa IoT for EV Charging Revenue (million) Forecast, by Application 2019 & 2032
- Table 36: South Africa IoT for EV Charging Revenue (million) Forecast, by Application 2019 & 2032
- Table 37: Rest of Middle East & Africa IoT for EV Charging Revenue (million) Forecast, by Application 2019 & 2032
- Table 38: Global IoT for EV Charging Revenue million Forecast, by Application 2019 & 2032
- Table 39: Global IoT for EV Charging Revenue million Forecast, by Types 2019 & 2032
- Table 40: Global IoT for EV Charging Revenue million Forecast, by Country 2019 & 2032
- Table 41: China IoT for EV Charging Revenue (million) Forecast, by Application 2019 & 2032
- Table 42: India IoT for EV Charging Revenue (million) Forecast, by Application 2019 & 2032
- Table 43: Japan IoT for EV Charging Revenue (million) Forecast, by Application 2019 & 2032
- Table 44: South Korea IoT for EV Charging Revenue (million) Forecast, by Application 2019 & 2032
- Table 45: ASEAN IoT for EV Charging Revenue (million) Forecast, by Application 2019 & 2032
- Table 46: Oceania IoT for EV Charging Revenue (million) Forecast, by Application 2019 & 2032
- Table 47: Rest of Asia Pacific IoT for EV Charging Revenue (million) Forecast, by Application 2019 & 2032
Frequently Asked Questions
1. What is the projected Compound Annual Growth Rate (CAGR) of the IoT for EV Charging?
The projected CAGR is approximately XX%.
2. Which companies are prominent players in the IoT for EV Charging?
Key companies in the market include ChargePoint, EVBox, ABB, Siemens, Schneider Electric, Webasto, Delta Electronics, Shell Recharge, BeiLai Technology, Tele2 IoT, Emnify, Zaptec, Hypercharge, GreenFlux, Pod Point, Clenergy EV, SparkCharge.
3. What are the main segments of the IoT for EV Charging?
The market segments include Application, Types.
4. Can you provide details about the market size?
The market size is estimated to be USD XXX million as of 2022.
5. What are some drivers contributing to market growth?
N/A
6. What are the notable trends driving market growth?
N/A
7. Are there any restraints impacting market growth?
N/A
8. Can you provide examples of recent developments in the market?
N/A
9. What pricing options are available for accessing the report?
Pricing options include single-user, multi-user, and enterprise licenses priced at USD 2900.00, USD 4350.00, and USD 5800.00 respectively.
10. Is the market size provided in terms of value or volume?
The market size is provided in terms of value, measured in million.
11. Are there any specific market keywords associated with the report?
Yes, the market keyword associated with the report is "IoT for EV Charging," which aids in identifying and referencing the specific market segment covered.
12. How do I determine which pricing option suits my needs best?
The pricing options vary based on user requirements and access needs. Individual users may opt for single-user licenses, while businesses requiring broader access may choose multi-user or enterprise licenses for cost-effective access to the report.
13. Are there any additional resources or data provided in the IoT for EV Charging report?
While the report offers comprehensive insights, it's advisable to review the specific contents or supplementary materials provided to ascertain if additional resources or data are available.
14. How can I stay updated on further developments or reports in the IoT for EV Charging?
To stay informed about further developments, trends, and reports in the IoT for EV Charging, consider subscribing to industry newsletters, following relevant companies and organizations, or regularly checking reputable industry news sources and publications.
Methodology
Step 1 - Identification of Relevant Samples Size from Population Database


Step 2 - Approaches for Defining Global Market Size (Value, Volume* & Price*)

Note*: In applicable scenarios
Step 3 - Data Sources
Primary Research
- Web Analytics
- Survey Reports
- Research Institute
- Latest Research Reports
- Opinion Leaders
Secondary Research
- Annual Reports
- White Paper
- Latest Press Release
- Industry Association
- Paid Database
- Investor Presentations

Step 4 - Data Triangulation
Involves using different sources of information in order to increase the validity of a study
These sources are likely to be stakeholders in a program - participants, other researchers, program staff, other community members, and so on.
Then we put all data in single framework & apply various statistical tools to find out the dynamic on the market.
During the analysis stage, feedback from the stakeholder groups would be compared to determine areas of agreement as well as areas of divergence
