

Key Insights
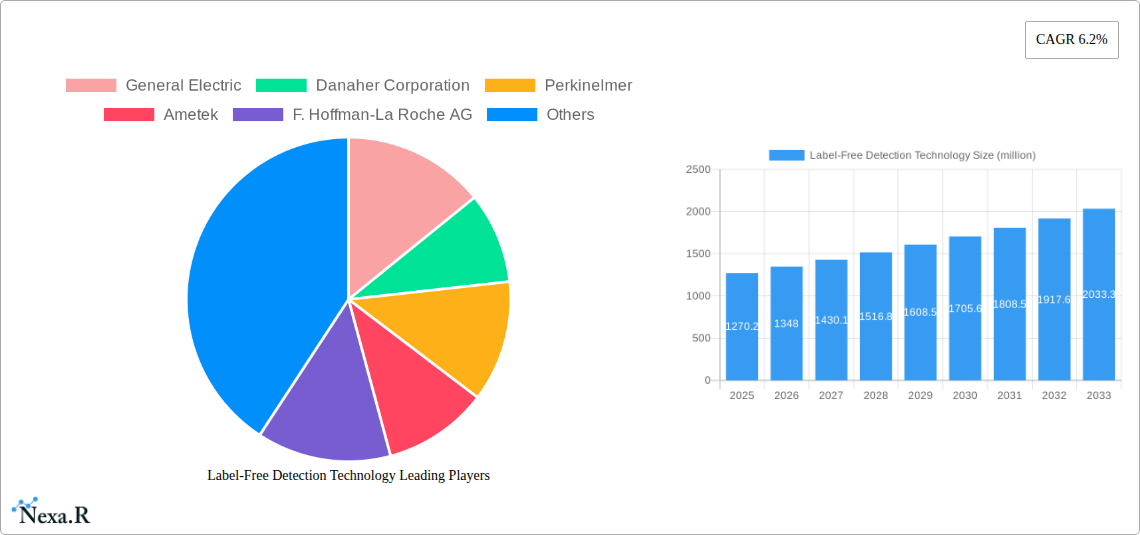
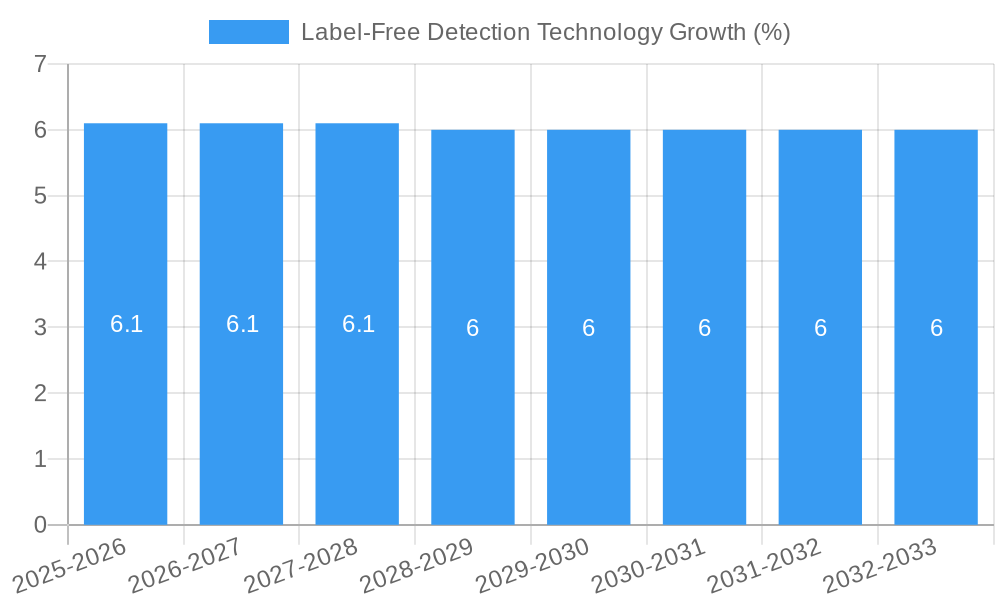
The global Label-Free Detection Technology market is poised for significant expansion, with a current market size of approximately USD 1270.2 million and a projected Compound Annual Growth Rate (CAGR) of 6.2% from 2025 to 2033. This robust growth is fueled by the increasing demand for advanced drug discovery and development processes, particularly within the pharmaceutical and biotechnology sectors. The inherent limitations and complexities associated with traditional labeled detection methods, such as sample preparation time and potential impact on molecular interactions, are driving the adoption of label-free technologies. These innovative approaches offer real-time, label-free analysis, providing deeper insights into molecular binding kinetics, thermodynamics, and concentrations, thereby accelerating research timelines and improving the accuracy of experimental outcomes. The market's expansion is also supported by substantial investments in research and development by leading biotechnology firms and academic institutions, coupled with the increasing prevalence of chronic diseases and the subsequent need for novel therapeutic interventions.
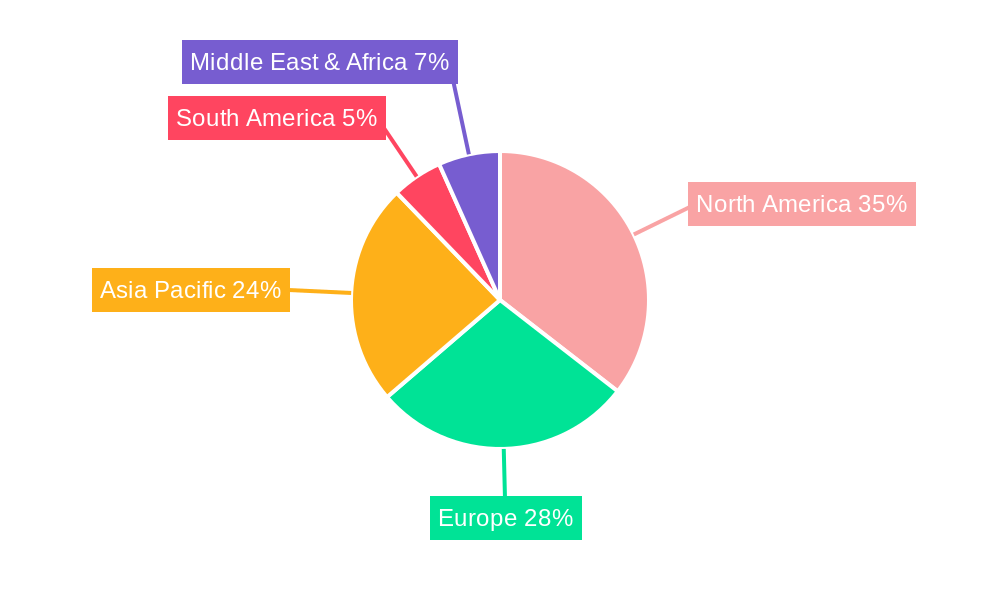
The market is segmented into various key technologies, with Surface Plasmon Resonance (SPR) and Bio-Layer Interferometry (BLI) leading the charge due to their high sensitivity and versatility in analyzing biomolecular interactions. Isothermal Titration Calorimetry (ITC) and Differential Scanning Calorimetry (DSC) also hold significant importance, particularly for thermodynamic characterization. Major players like General Electric, Danaher Corporation, PerkinElmer, and TA Instruments are actively involved in the development and commercialization of cutting-edge label-free detection systems, further propelling market growth. Geographically, North America is anticipated to dominate the market share, driven by a strong presence of research institutions, pharmaceutical giants, and favorable government initiatives. Asia Pacific is expected to witness the fastest growth, propelled by the expanding biopharmaceutical industry in countries like China and India, and increasing R&D expenditures. Despite the promising outlook, challenges such as the high initial cost of advanced instrumentation and the need for specialized expertise in operating these systems may present some restraints to market growth.
This comprehensive report delivers an in-depth analysis of the global Label-Free Detection Technology market, meticulously examining its structure, growth drivers, regional dominance, and future outlook. Spanning from 2019 to 2033, with a base year of 2025 and a detailed forecast period of 2025–2033, this research provides actionable insights for industry stakeholders. We delve into key market segments, including Pharmaceutical and Biotechnology, Academic Research Institutes, and Contract Research Organizations, and explore dominant technologies such as Surface Plasmon Resonance, Bio-Layer Interferometry, Isothermal Titration Calorimetry, and Differential Scanning Calorimetry.
Label-Free Detection Technology Market Dynamics & Structure
The Label-Free Detection Technology market exhibits a moderately concentrated structure, driven by continuous technological innovation and increasing adoption across the pharmaceutical and biotechnology sectors. Key innovation drivers include the demand for higher throughput screening, reduced experimental costs, and enhanced sensitivity in drug discovery and development. Regulatory frameworks, particularly those from agencies like the FDA and EMA, are indirectly shaping the market by promoting robust and reliable analytical methods for biopharmaceutical characterization. Competitive product substitutes, while present in traditional labeling-based assays, are increasingly being superseded by label-free solutions due to their inherent advantages in speed and simplicity. End-user demographics are increasingly leaning towards research-intensive organizations that require sophisticated analytical tools. Mergers and acquisitions (M&A) trends, with an estimated XX deal volumes in the historical period (2019-2024), are observed as companies seek to broaden their technology portfolios and market reach. For instance, the market share of leading players was approximately 45% in 2025, with a continuous trend of consolidation to enhance competitive positioning.
- Market Concentration: Moderately concentrated, with key players holding significant market share.
- Technological Innovation Drivers: High-throughput screening, cost reduction, increased sensitivity, and simplified workflows.
- Regulatory Frameworks: Indirect influence from agencies like FDA and EMA, promoting validated and reliable analytical techniques.
- Competitive Product Substitutes: Traditional labeling-based assays are losing ground to label-free methods.
- End-User Demographics: Predominantly research-intensive organizations in pharmaceuticals, biotechnology, and academia.
- M&A Trends: Increasing consolidation to expand technology portfolios and market presence.
Label-Free Detection Technology Growth Trends & Insights
The global Label-Free Detection Technology market is poised for robust growth, projected to achieve a market size of $XXX million units in 2025 and forecast to reach $YYY million units by 2033, exhibiting a compound annual growth rate (CAGR) of XX.X% during the forecast period (2025–2033). This expansion is fueled by a confluence of factors including accelerated drug discovery pipelines, the increasing complexity of biologics and biosimilars requiring precise characterization, and the growing emphasis on early-stage research and development in academic institutions. Adoption rates of label-free technologies are steadily rising as researchers recognize their ability to streamline experimental processes, reduce the need for costly and time-consuming labeling steps, and provide deeper insights into molecular interactions. Technological disruptions, such as advancements in microfluidics integration and the development of more sensitive and versatile detection platforms, are further democratizing access to label-free analysis. Consumer behavior shifts are evident, with a growing preference for experimental designs that minimize artifacts introduced by labels and offer a more biologically relevant understanding of molecular behavior. The market penetration of these technologies, currently estimated at XX% in the pharmaceutical R&D sector, is expected to climb significantly as their benefits become more widely understood and integrated into standard laboratory practices. Furthermore, the increasing demand for personalized medicine and the development of novel therapeutic modalities are creating new avenues for label-free detection in areas such as protein-protein interactions, nucleic acid binding studies, and antibody-drug conjugate (ADC) characterization.
Dominant Regions, Countries, or Segments in Label-Free Detection Technology
The Pharmaceutical and Biotechnology segment is the undisputed leader in the Label-Free Detection Technology market, driven by the immense R&D investments and the critical need for precise molecular characterization in drug discovery and development. This segment is projected to command a market share of over XX% in 2025, with a sustained growth trajectory. North America, particularly the United States, stands out as the dominant region, accounting for approximately XX% of the global market in 2025. This dominance is attributed to its robust pharmaceutical industry, extensive academic research infrastructure, and significant government funding for life sciences research.
- Dominant Segment: Pharmaceutical and Biotechnology, driven by high R&D expenditure and stringent regulatory requirements for drug characterization.
- Key Drivers: Accelerated drug discovery, increasing complexity of biologics, demand for biosimilar development.
- Market Share (2025): Over XX%
- Growth Potential: High, due to continuous innovation in therapeutic modalities.
- Dominant Region: North America (specifically the United States), due to a strong pharmaceutical ecosystem and substantial R&D investment.
- Key Drivers: Presence of major pharmaceutical companies, leading research universities, government funding initiatives.
- Market Share (2025): Approximately XX%
- Growth Potential: Sustained, fueled by ongoing innovation and industry expansion.
Within the Types of label-free detection technologies, Surface Plasmon Resonance (SPR) continues to be a frontrunner, holding a substantial market share due to its established reliability, versatility, and ability to provide kinetic and affinity data in real-time. However, Bio-Layer Interferometry (BLI) is rapidly gaining traction, offering a cost-effective and user-friendly alternative for many applications.
- Dominant Technology Type: Surface Plasmon Resonance (SPR), favored for its established track record and comprehensive data output.
- Key Drivers: Real-time kinetic analysis, affinity measurements, wide range of applications in drug discovery.
- Market Share (2025): Approximately XX%
- Growth Potential: Stable to moderate, with ongoing technological refinements.
Label-Free Detection Technology Product Landscape
The product landscape of label-free detection technology is characterized by continuous innovation aimed at enhancing sensitivity, throughput, and multiplexing capabilities. Leading companies are introducing advanced SPR and BLI instruments that offer faster association and dissociation rate measurements, enabling more accurate characterization of molecular interactions. Furthermore, advancements in microfluidics are enabling smaller sample volumes and reduced reagent consumption, making these technologies more accessible and cost-effective. Novel applications are emerging in areas such as antibody engineering, vaccine development, and the analysis of viral particles, showcasing the expanding utility of these platforms. The integration of AI and machine learning algorithms into data analysis software is also enhancing the interpretation of complex label-free data, further solidifying their position in cutting-edge research.
Key Drivers, Barriers & Challenges in Label-Free Detection Technology
Key Drivers: The primary forces propelling the label-free detection technology market include the relentless pursuit of efficiency and accuracy in drug discovery and development, the increasing demand for biologics and biosimilars requiring rigorous characterization, and the growing emphasis on fundamental research in academic and government institutions. Technological advancements in sensitivity and multiplexing capabilities are also significant drivers, making these techniques more powerful and versatile. The cost-effectiveness offered by label-free methods, by eliminating the need for expensive labeling reagents and reducing experimental steps, further fuels adoption.
Barriers & Challenges: Despite its growth, the market faces challenges such as the initial capital investment required for sophisticated instrumentation, the need for specialized expertise in operating and interpreting data from these systems, and the presence of established, albeit less efficient, labeling-based methods. Supply chain disruptions for critical components can also impact production and availability. Furthermore, the perceived complexity of some label-free techniques can be a barrier to widespread adoption, especially in smaller research facilities. Regulatory hurdles, while generally supportive of robust analytical methods, can sometimes lead to longer validation timelines for novel label-free approaches in specific regulated applications.
Emerging Opportunities in Label-Free Detection Technology
Emerging opportunities for label-free detection technology lie in the expanding fields of personalized medicine and novel therapeutic modalities. The development of label-free assays for monitoring therapeutic drug levels in real-time and predicting patient response presents a significant untapped market. Furthermore, the application of these technologies in studying microbiome interactions and the development of advanced diagnostics for infectious diseases offers new growth avenues. The increasing focus on biopharmaceutical quality control and the need for rapid release testing of biologics also present significant opportunities for the adoption of label-free methods, promising faster turnaround times and improved efficiency in manufacturing processes. The growing demand for point-of-care diagnostics with enhanced sensitivity also opens doors for miniaturized and cost-effective label-free solutions.
Growth Accelerators in the Label-Free Detection Technology Industry
Catalysts driving long-term growth in the label-free detection technology industry include significant technological breakthroughs in sensor development and detection sensitivity, leading to more robust and informative data. Strategic partnerships between instrument manufacturers, reagent suppliers, and end-users are accelerating the adoption of these technologies by fostering co-development and application-specific solutions. Market expansion strategies, particularly targeting emerging economies with growing biopharmaceutical sectors and research infrastructure, are also key growth accelerators. The continuous innovation in data analysis software, incorporating AI and machine learning, will further enhance the value proposition of label-free detection.
Key Players Shaping the Label-Free Detection Technology Market
- General Electric
- Danaher Corporation
- PerkinElmer
- Ametek
- F. Hoffman-La Roche AG
- Malvern Panalytical
- TA Instruments
- Corning Incorporated
- Horiba
- Shimadzu Corporation
- Hitachi High-Technologies Corporation
Notable Milestones in Label-Free Detection Technology Sector
- 2019: Launch of next-generation SPR instruments with enhanced throughput and sensitivity by key manufacturers.
- 2020: Increased adoption of BLI for routine biophysical characterization in academic labs and smaller biotech companies.
- 2021: Development of novel label-free assays for rapid screening of antibody-drug conjugate (ADC) efficacy.
- 2022: Strategic collaborations to integrate label-free technologies with high-content screening platforms.
- 2023: Advancements in microfluidic integration leading to miniaturized and portable label-free detection devices.
- 2024: Increased application of AI-driven data analysis for label-free kinetic and affinity studies.
In-Depth Label-Free Detection Technology Market Outlook
The future market outlook for label-free detection technology is exceptionally promising, driven by its intrinsic ability to provide unparalleled insights into molecular interactions with greater efficiency and reduced experimental complexity. Growth accelerators such as continuous technological advancements in sensor precision, wider adoption of AI in data interpretation, and strategic expansion into burgeoning biopharmaceutical markets will fuel sustained growth. The increasing demand for personalized medicine, coupled with the ongoing development of novel biologics and gene therapies, will create new frontiers for label-free applications. Furthermore, the push for more sustainable and cost-effective research methodologies will continue to favor label-free solutions, solidifying their position as indispensable tools in modern life science research and development.
Label-Free Detection Technology Segmentation
-
1. Application
- 1.1. Pharmaceutical and Biotechnology
- 1.2. Academic Research Institutes
- 1.3. Contract Research Organizations
- 1.4. Others
-
2. Types
- 2.1. Surface Plasmon Resonance
- 2.2. Bio-Layer Interferometry
- 2.3. Isothermal Titration Calorimetry
- 2.4. Differential Scanning Calorimetry
- 2.5. Other Technologies
Label-Free Detection Technology Segmentation By Geography
-
1. North America
- 1.1. United States
- 1.2. Canada
- 1.3. Mexico
-
2. South America
- 2.1. Brazil
- 2.2. Argentina
- 2.3. Rest of South America
-
3. Europe
- 3.1. United Kingdom
- 3.2. Germany
- 3.3. France
- 3.4. Italy
- 3.5. Spain
- 3.6. Russia
- 3.7. Benelux
- 3.8. Nordics
- 3.9. Rest of Europe
-
4. Middle East & Africa
- 4.1. Turkey
- 4.2. Israel
- 4.3. GCC
- 4.4. North Africa
- 4.5. South Africa
- 4.6. Rest of Middle East & Africa
-
5. Asia Pacific
- 5.1. China
- 5.2. India
- 5.3. Japan
- 5.4. South Korea
- 5.5. ASEAN
- 5.6. Oceania
- 5.7. Rest of Asia Pacific
Label-Free Detection Technology REPORT HIGHLIGHTS
| Aspects | Details |
|---|---|
| Study Period | 2019-2033 |
| Base Year | 2024 |
| Estimated Year | 2025 |
| Forecast Period | 2025-2033 |
| Historical Period | 2019-2024 |
| Growth Rate | CAGR of 6.2% from 2019-2033 |
| Segmentation |
|
Table of Contents
- 1. Introduction
- 1.1. Research Scope
- 1.2. Market Segmentation
- 1.3. Research Methodology
- 1.4. Definitions and Assumptions
- 2. Executive Summary
- 2.1. Introduction
- 3. Market Dynamics
- 3.1. Introduction
- 3.2. Market Drivers
- 3.3. Market Restrains
- 3.4. Market Trends
- 4. Market Factor Analysis
- 4.1. Porters Five Forces
- 4.2. Supply/Value Chain
- 4.3. PESTEL analysis
- 4.4. Market Entropy
- 4.5. Patent/Trademark Analysis
- 5. Global Label-Free Detection Technology Analysis, Insights and Forecast, 2019-2031
- 5.1. Market Analysis, Insights and Forecast - by Application
- 5.1.1. Pharmaceutical and Biotechnology
- 5.1.2. Academic Research Institutes
- 5.1.3. Contract Research Organizations
- 5.1.4. Others
- 5.2. Market Analysis, Insights and Forecast - by Types
- 5.2.1. Surface Plasmon Resonance
- 5.2.2. Bio-Layer Interferometry
- 5.2.3. Isothermal Titration Calorimetry
- 5.2.4. Differential Scanning Calorimetry
- 5.2.5. Other Technologies
- 5.3. Market Analysis, Insights and Forecast - by Region
- 5.3.1. North America
- 5.3.2. South America
- 5.3.3. Europe
- 5.3.4. Middle East & Africa
- 5.3.5. Asia Pacific
- 5.1. Market Analysis, Insights and Forecast - by Application
- 6. North America Label-Free Detection Technology Analysis, Insights and Forecast, 2019-2031
- 6.1. Market Analysis, Insights and Forecast - by Application
- 6.1.1. Pharmaceutical and Biotechnology
- 6.1.2. Academic Research Institutes
- 6.1.3. Contract Research Organizations
- 6.1.4. Others
- 6.2. Market Analysis, Insights and Forecast - by Types
- 6.2.1. Surface Plasmon Resonance
- 6.2.2. Bio-Layer Interferometry
- 6.2.3. Isothermal Titration Calorimetry
- 6.2.4. Differential Scanning Calorimetry
- 6.2.5. Other Technologies
- 6.1. Market Analysis, Insights and Forecast - by Application
- 7. South America Label-Free Detection Technology Analysis, Insights and Forecast, 2019-2031
- 7.1. Market Analysis, Insights and Forecast - by Application
- 7.1.1. Pharmaceutical and Biotechnology
- 7.1.2. Academic Research Institutes
- 7.1.3. Contract Research Organizations
- 7.1.4. Others
- 7.2. Market Analysis, Insights and Forecast - by Types
- 7.2.1. Surface Plasmon Resonance
- 7.2.2. Bio-Layer Interferometry
- 7.2.3. Isothermal Titration Calorimetry
- 7.2.4. Differential Scanning Calorimetry
- 7.2.5. Other Technologies
- 7.1. Market Analysis, Insights and Forecast - by Application
- 8. Europe Label-Free Detection Technology Analysis, Insights and Forecast, 2019-2031
- 8.1. Market Analysis, Insights and Forecast - by Application
- 8.1.1. Pharmaceutical and Biotechnology
- 8.1.2. Academic Research Institutes
- 8.1.3. Contract Research Organizations
- 8.1.4. Others
- 8.2. Market Analysis, Insights and Forecast - by Types
- 8.2.1. Surface Plasmon Resonance
- 8.2.2. Bio-Layer Interferometry
- 8.2.3. Isothermal Titration Calorimetry
- 8.2.4. Differential Scanning Calorimetry
- 8.2.5. Other Technologies
- 8.1. Market Analysis, Insights and Forecast - by Application
- 9. Middle East & Africa Label-Free Detection Technology Analysis, Insights and Forecast, 2019-2031
- 9.1. Market Analysis, Insights and Forecast - by Application
- 9.1.1. Pharmaceutical and Biotechnology
- 9.1.2. Academic Research Institutes
- 9.1.3. Contract Research Organizations
- 9.1.4. Others
- 9.2. Market Analysis, Insights and Forecast - by Types
- 9.2.1. Surface Plasmon Resonance
- 9.2.2. Bio-Layer Interferometry
- 9.2.3. Isothermal Titration Calorimetry
- 9.2.4. Differential Scanning Calorimetry
- 9.2.5. Other Technologies
- 9.1. Market Analysis, Insights and Forecast - by Application
- 10. Asia Pacific Label-Free Detection Technology Analysis, Insights and Forecast, 2019-2031
- 10.1. Market Analysis, Insights and Forecast - by Application
- 10.1.1. Pharmaceutical and Biotechnology
- 10.1.2. Academic Research Institutes
- 10.1.3. Contract Research Organizations
- 10.1.4. Others
- 10.2. Market Analysis, Insights and Forecast - by Types
- 10.2.1. Surface Plasmon Resonance
- 10.2.2. Bio-Layer Interferometry
- 10.2.3. Isothermal Titration Calorimetry
- 10.2.4. Differential Scanning Calorimetry
- 10.2.5. Other Technologies
- 10.1. Market Analysis, Insights and Forecast - by Application
- 11. Competitive Analysis
- 11.1. Global Market Share Analysis 2024
- 11.2. Company Profiles
- 11.2.1 General Electric
- 11.2.1.1. Overview
- 11.2.1.2. Products
- 11.2.1.3. SWOT Analysis
- 11.2.1.4. Recent Developments
- 11.2.1.5. Financials (Based on Availability)
- 11.2.2 Danaher Corporation
- 11.2.2.1. Overview
- 11.2.2.2. Products
- 11.2.2.3. SWOT Analysis
- 11.2.2.4. Recent Developments
- 11.2.2.5. Financials (Based on Availability)
- 11.2.3 Perkinelmer
- 11.2.3.1. Overview
- 11.2.3.2. Products
- 11.2.3.3. SWOT Analysis
- 11.2.3.4. Recent Developments
- 11.2.3.5. Financials (Based on Availability)
- 11.2.4 Ametek
- 11.2.4.1. Overview
- 11.2.4.2. Products
- 11.2.4.3. SWOT Analysis
- 11.2.4.4. Recent Developments
- 11.2.4.5. Financials (Based on Availability)
- 11.2.5 F. Hoffman-La Roche AG
- 11.2.5.1. Overview
- 11.2.5.2. Products
- 11.2.5.3. SWOT Analysis
- 11.2.5.4. Recent Developments
- 11.2.5.5. Financials (Based on Availability)
- 11.2.6 Malvern Panalytical
- 11.2.6.1. Overview
- 11.2.6.2. Products
- 11.2.6.3. SWOT Analysis
- 11.2.6.4. Recent Developments
- 11.2.6.5. Financials (Based on Availability)
- 11.2.7 TA Instruments
- 11.2.7.1. Overview
- 11.2.7.2. Products
- 11.2.7.3. SWOT Analysis
- 11.2.7.4. Recent Developments
- 11.2.7.5. Financials (Based on Availability)
- 11.2.8 Corning Incorporated
- 11.2.8.1. Overview
- 11.2.8.2. Products
- 11.2.8.3. SWOT Analysis
- 11.2.8.4. Recent Developments
- 11.2.8.5. Financials (Based on Availability)
- 11.2.9 Horiba
- 11.2.9.1. Overview
- 11.2.9.2. Products
- 11.2.9.3. SWOT Analysis
- 11.2.9.4. Recent Developments
- 11.2.9.5. Financials (Based on Availability)
- 11.2.10 Shimadzu Corporation
- 11.2.10.1. Overview
- 11.2.10.2. Products
- 11.2.10.3. SWOT Analysis
- 11.2.10.4. Recent Developments
- 11.2.10.5. Financials (Based on Availability)
- 11.2.11 Hitachi High-Technologies Corporation
- 11.2.11.1. Overview
- 11.2.11.2. Products
- 11.2.11.3. SWOT Analysis
- 11.2.11.4. Recent Developments
- 11.2.11.5. Financials (Based on Availability)
- 11.2.1 General Electric
List of Figures
- Figure 1: Global Label-Free Detection Technology Revenue Breakdown (million, %) by Region 2024 & 2032
- Figure 2: North America Label-Free Detection Technology Revenue (million), by Application 2024 & 2032
- Figure 3: North America Label-Free Detection Technology Revenue Share (%), by Application 2024 & 2032
- Figure 4: North America Label-Free Detection Technology Revenue (million), by Types 2024 & 2032
- Figure 5: North America Label-Free Detection Technology Revenue Share (%), by Types 2024 & 2032
- Figure 6: North America Label-Free Detection Technology Revenue (million), by Country 2024 & 2032
- Figure 7: North America Label-Free Detection Technology Revenue Share (%), by Country 2024 & 2032
- Figure 8: South America Label-Free Detection Technology Revenue (million), by Application 2024 & 2032
- Figure 9: South America Label-Free Detection Technology Revenue Share (%), by Application 2024 & 2032
- Figure 10: South America Label-Free Detection Technology Revenue (million), by Types 2024 & 2032
- Figure 11: South America Label-Free Detection Technology Revenue Share (%), by Types 2024 & 2032
- Figure 12: South America Label-Free Detection Technology Revenue (million), by Country 2024 & 2032
- Figure 13: South America Label-Free Detection Technology Revenue Share (%), by Country 2024 & 2032
- Figure 14: Europe Label-Free Detection Technology Revenue (million), by Application 2024 & 2032
- Figure 15: Europe Label-Free Detection Technology Revenue Share (%), by Application 2024 & 2032
- Figure 16: Europe Label-Free Detection Technology Revenue (million), by Types 2024 & 2032
- Figure 17: Europe Label-Free Detection Technology Revenue Share (%), by Types 2024 & 2032
- Figure 18: Europe Label-Free Detection Technology Revenue (million), by Country 2024 & 2032
- Figure 19: Europe Label-Free Detection Technology Revenue Share (%), by Country 2024 & 2032
- Figure 20: Middle East & Africa Label-Free Detection Technology Revenue (million), by Application 2024 & 2032
- Figure 21: Middle East & Africa Label-Free Detection Technology Revenue Share (%), by Application 2024 & 2032
- Figure 22: Middle East & Africa Label-Free Detection Technology Revenue (million), by Types 2024 & 2032
- Figure 23: Middle East & Africa Label-Free Detection Technology Revenue Share (%), by Types 2024 & 2032
- Figure 24: Middle East & Africa Label-Free Detection Technology Revenue (million), by Country 2024 & 2032
- Figure 25: Middle East & Africa Label-Free Detection Technology Revenue Share (%), by Country 2024 & 2032
- Figure 26: Asia Pacific Label-Free Detection Technology Revenue (million), by Application 2024 & 2032
- Figure 27: Asia Pacific Label-Free Detection Technology Revenue Share (%), by Application 2024 & 2032
- Figure 28: Asia Pacific Label-Free Detection Technology Revenue (million), by Types 2024 & 2032
- Figure 29: Asia Pacific Label-Free Detection Technology Revenue Share (%), by Types 2024 & 2032
- Figure 30: Asia Pacific Label-Free Detection Technology Revenue (million), by Country 2024 & 2032
- Figure 31: Asia Pacific Label-Free Detection Technology Revenue Share (%), by Country 2024 & 2032
List of Tables
- Table 1: Global Label-Free Detection Technology Revenue million Forecast, by Region 2019 & 2032
- Table 2: Global Label-Free Detection Technology Revenue million Forecast, by Application 2019 & 2032
- Table 3: Global Label-Free Detection Technology Revenue million Forecast, by Types 2019 & 2032
- Table 4: Global Label-Free Detection Technology Revenue million Forecast, by Region 2019 & 2032
- Table 5: Global Label-Free Detection Technology Revenue million Forecast, by Application 2019 & 2032
- Table 6: Global Label-Free Detection Technology Revenue million Forecast, by Types 2019 & 2032
- Table 7: Global Label-Free Detection Technology Revenue million Forecast, by Country 2019 & 2032
- Table 8: United States Label-Free Detection Technology Revenue (million) Forecast, by Application 2019 & 2032
- Table 9: Canada Label-Free Detection Technology Revenue (million) Forecast, by Application 2019 & 2032
- Table 10: Mexico Label-Free Detection Technology Revenue (million) Forecast, by Application 2019 & 2032
- Table 11: Global Label-Free Detection Technology Revenue million Forecast, by Application 2019 & 2032
- Table 12: Global Label-Free Detection Technology Revenue million Forecast, by Types 2019 & 2032
- Table 13: Global Label-Free Detection Technology Revenue million Forecast, by Country 2019 & 2032
- Table 14: Brazil Label-Free Detection Technology Revenue (million) Forecast, by Application 2019 & 2032
- Table 15: Argentina Label-Free Detection Technology Revenue (million) Forecast, by Application 2019 & 2032
- Table 16: Rest of South America Label-Free Detection Technology Revenue (million) Forecast, by Application 2019 & 2032
- Table 17: Global Label-Free Detection Technology Revenue million Forecast, by Application 2019 & 2032
- Table 18: Global Label-Free Detection Technology Revenue million Forecast, by Types 2019 & 2032
- Table 19: Global Label-Free Detection Technology Revenue million Forecast, by Country 2019 & 2032
- Table 20: United Kingdom Label-Free Detection Technology Revenue (million) Forecast, by Application 2019 & 2032
- Table 21: Germany Label-Free Detection Technology Revenue (million) Forecast, by Application 2019 & 2032
- Table 22: France Label-Free Detection Technology Revenue (million) Forecast, by Application 2019 & 2032
- Table 23: Italy Label-Free Detection Technology Revenue (million) Forecast, by Application 2019 & 2032
- Table 24: Spain Label-Free Detection Technology Revenue (million) Forecast, by Application 2019 & 2032
- Table 25: Russia Label-Free Detection Technology Revenue (million) Forecast, by Application 2019 & 2032
- Table 26: Benelux Label-Free Detection Technology Revenue (million) Forecast, by Application 2019 & 2032
- Table 27: Nordics Label-Free Detection Technology Revenue (million) Forecast, by Application 2019 & 2032
- Table 28: Rest of Europe Label-Free Detection Technology Revenue (million) Forecast, by Application 2019 & 2032
- Table 29: Global Label-Free Detection Technology Revenue million Forecast, by Application 2019 & 2032
- Table 30: Global Label-Free Detection Technology Revenue million Forecast, by Types 2019 & 2032
- Table 31: Global Label-Free Detection Technology Revenue million Forecast, by Country 2019 & 2032
- Table 32: Turkey Label-Free Detection Technology Revenue (million) Forecast, by Application 2019 & 2032
- Table 33: Israel Label-Free Detection Technology Revenue (million) Forecast, by Application 2019 & 2032
- Table 34: GCC Label-Free Detection Technology Revenue (million) Forecast, by Application 2019 & 2032
- Table 35: North Africa Label-Free Detection Technology Revenue (million) Forecast, by Application 2019 & 2032
- Table 36: South Africa Label-Free Detection Technology Revenue (million) Forecast, by Application 2019 & 2032
- Table 37: Rest of Middle East & Africa Label-Free Detection Technology Revenue (million) Forecast, by Application 2019 & 2032
- Table 38: Global Label-Free Detection Technology Revenue million Forecast, by Application 2019 & 2032
- Table 39: Global Label-Free Detection Technology Revenue million Forecast, by Types 2019 & 2032
- Table 40: Global Label-Free Detection Technology Revenue million Forecast, by Country 2019 & 2032
- Table 41: China Label-Free Detection Technology Revenue (million) Forecast, by Application 2019 & 2032
- Table 42: India Label-Free Detection Technology Revenue (million) Forecast, by Application 2019 & 2032
- Table 43: Japan Label-Free Detection Technology Revenue (million) Forecast, by Application 2019 & 2032
- Table 44: South Korea Label-Free Detection Technology Revenue (million) Forecast, by Application 2019 & 2032
- Table 45: ASEAN Label-Free Detection Technology Revenue (million) Forecast, by Application 2019 & 2032
- Table 46: Oceania Label-Free Detection Technology Revenue (million) Forecast, by Application 2019 & 2032
- Table 47: Rest of Asia Pacific Label-Free Detection Technology Revenue (million) Forecast, by Application 2019 & 2032
Frequently Asked Questions
1. What is the projected Compound Annual Growth Rate (CAGR) of the Label-Free Detection Technology?
The projected CAGR is approximately 6.2%.
2. Which companies are prominent players in the Label-Free Detection Technology?
Key companies in the market include General Electric, Danaher Corporation, Perkinelmer, Ametek, F. Hoffman-La Roche AG, Malvern Panalytical, TA Instruments, Corning Incorporated, Horiba, Shimadzu Corporation, Hitachi High-Technologies Corporation.
3. What are the main segments of the Label-Free Detection Technology?
The market segments include Application, Types.
4. Can you provide details about the market size?
The market size is estimated to be USD 1270.2 million as of 2022.
5. What are some drivers contributing to market growth?
N/A
6. What are the notable trends driving market growth?
N/A
7. Are there any restraints impacting market growth?
N/A
8. Can you provide examples of recent developments in the market?
N/A
9. What pricing options are available for accessing the report?
Pricing options include single-user, multi-user, and enterprise licenses priced at USD 4900.00, USD 7350.00, and USD 9800.00 respectively.
10. Is the market size provided in terms of value or volume?
The market size is provided in terms of value, measured in million.
11. Are there any specific market keywords associated with the report?
Yes, the market keyword associated with the report is "Label-Free Detection Technology," which aids in identifying and referencing the specific market segment covered.
12. How do I determine which pricing option suits my needs best?
The pricing options vary based on user requirements and access needs. Individual users may opt for single-user licenses, while businesses requiring broader access may choose multi-user or enterprise licenses for cost-effective access to the report.
13. Are there any additional resources or data provided in the Label-Free Detection Technology report?
While the report offers comprehensive insights, it's advisable to review the specific contents or supplementary materials provided to ascertain if additional resources or data are available.
14. How can I stay updated on further developments or reports in the Label-Free Detection Technology?
To stay informed about further developments, trends, and reports in the Label-Free Detection Technology, consider subscribing to industry newsletters, following relevant companies and organizations, or regularly checking reputable industry news sources and publications.
Methodology
Step 1 - Identification of Relevant Samples Size from Population Database


Step 2 - Approaches for Defining Global Market Size (Value, Volume* & Price*)

Note*: In applicable scenarios
Step 3 - Data Sources
Primary Research
- Web Analytics
- Survey Reports
- Research Institute
- Latest Research Reports
- Opinion Leaders
Secondary Research
- Annual Reports
- White Paper
- Latest Press Release
- Industry Association
- Paid Database
- Investor Presentations

Step 4 - Data Triangulation
Involves using different sources of information in order to increase the validity of a study
These sources are likely to be stakeholders in a program - participants, other researchers, program staff, other community members, and so on.
Then we put all data in single framework & apply various statistical tools to find out the dynamic on the market.
During the analysis stage, feedback from the stakeholder groups would be compared to determine areas of agreement as well as areas of divergence
