

Key Insights
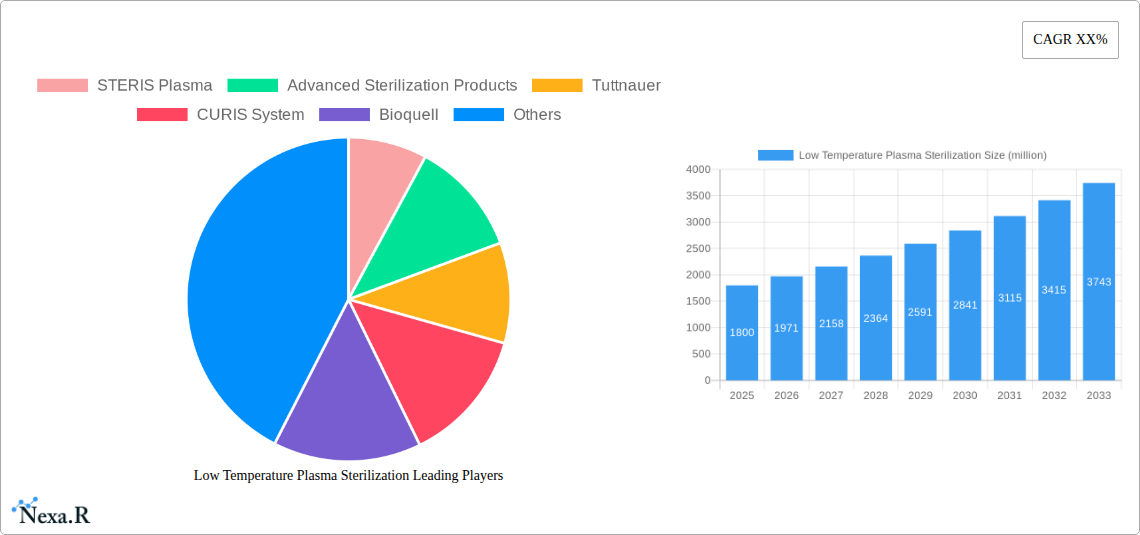
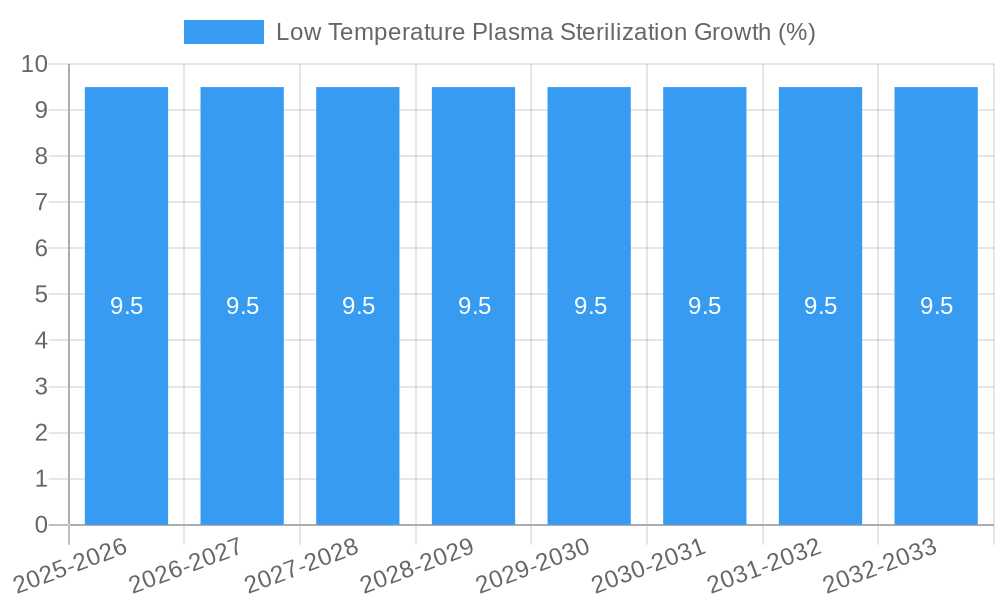
The global Low Temperature Plasma Sterilization market is projected for substantial expansion, reaching an estimated market size of approximately $1.8 billion by 2025. This robust growth is fueled by an anticipated Compound Annual Growth Rate (CAGR) of around 9.5% during the forecast period (2025-2033). The increasing demand for sterile medical devices, coupled with the growing awareness of plasma sterilization's advantages over traditional methods such as autoclaving (lower temperatures, faster cycles, material compatibility), are primary drivers. Healthcare facilities, particularly hospitals and clinics, represent the largest application segment due to the constant need for sterilization of sensitive instruments and equipment. The pharmaceutical industry also contributes significantly, utilizing plasma sterilization for aseptic processing and the decontamination of manufacturing environments. This upward trajectory indicates a market ripe with opportunity for innovation and investment, driven by technological advancements and a global emphasis on infection control.
The market's growth is further supported by a shift towards more efficient and material-friendly sterilization technologies. The availability of a wide range of plasma sterilization equipment, catering to diverse capacity needs from 40L to over 150L, ensures broad adoption across various healthcare settings. While the market enjoys strong drivers, potential restraints include the initial capital investment required for plasma sterilization systems and the need for specialized training for operators. However, the long-term benefits, including reduced damage to heat-sensitive instruments and improved patient safety, are expected to outweigh these challenges. Key players like STERIS Plasma, Advanced Sterilization Products, and Getinge are at the forefront of this market, continuously innovating and expanding their product portfolios to meet evolving industry demands and capitalize on the growing global adoption of low-temperature plasma sterilization for a safer healthcare ecosystem.
This comprehensive market research report offers an in-depth analysis of the global Low Temperature Plasma Sterilization market, meticulously examining its dynamics, growth trajectories, and future potential. Spanning a study period from 2019 to 2033, with a base and estimated year of 2025, this report provides actionable insights for industry stakeholders, including manufacturers, suppliers, healthcare providers, and investors. We delve into market segmentation by application (Hospitals, Clinics, Pharmaceutical, Others) and type (40L-100L, 100L-150L, Above 150L), presenting a granular view of market opportunities.
Low Temperature Plasma Sterilization Market Dynamics & Structure
The global Low Temperature Plasma Sterilization market is characterized by moderate concentration, driven by significant technological innovation and stringent regulatory frameworks essential for healthcare sterilization solutions. The market's expansion is propelled by an increasing demand for effective sterilization of heat-sensitive medical devices, a trend amplified by the rising incidence of healthcare-associated infections and evolving infection control protocols. Competitive product substitutes, such as Ethylene Oxide (EtO) and steam sterilization, present a considerable challenge, yet low temperature plasma sterilization's advantages, including faster cycle times and reduced material degradation, offer a compelling alternative. End-user demographics are heavily skewed towards hospitals and clinics, which account for the majority of demand, followed by the pharmaceutical sector for the sterilization of sensitive equipment. Merger and acquisition (M&A) activity, while not as prolific as in other healthcare sectors, has seen strategic consolidation, with key players acquiring smaller entities to broaden their product portfolios and geographic reach. For instance, historical data indicates an average of 1-2 significant M&A deals annually in the parent market, with an estimated deal volume of $50 million to $100 million over the historical period (2019-2024). Innovation barriers primarily include the high cost of advanced plasma sterilization systems and the need for extensive validation and regulatory approvals for new technologies.
Low Temperature Plasma Sterilization Growth Trends & Insights
The global Low Temperature Plasma Sterilization market is poised for robust expansion, projected to grow at a Compound Annual Growth Rate (CAGR) of approximately 8.5% from 2025 to 2033. This growth is underpinned by a confluence of factors, including the escalating global healthcare expenditure, a heightened emphasis on patient safety and infection prevention, and the inherent advantages of low temperature plasma sterilization over traditional methods. The market size, valued at an estimated $5,500 million in 2025, is expected to reach approximately $10,500 million by 2033. Technological disruptions are continuously shaping the market, with advancements in plasma generation techniques, automation, and integrated data management systems enhancing efficiency and user experience. Adoption rates are steadily increasing across developed and emerging economies, as healthcare facilities recognize the economic and clinical benefits. Consumer behavior shifts are also playing a pivotal role; medical professionals are increasingly prioritizing sterilization methods that minimize damage to delicate and expensive instruments, thereby extending their lifespan and reducing replacement costs. Furthermore, the growing awareness of the environmental and health risks associated with traditional sterilization agents like EtO is further accelerating the adoption of plasma-based solutions. The market penetration of low temperature plasma sterilization systems, while still lower than conventional methods, is on an upward trajectory, estimated to increase from 15% in 2025 to over 25% by 2033 in the parent market. This surge is further bolstered by the expanding scope of applications beyond traditional medical devices to include sensitive laboratory equipment and certain pharmaceutical manufacturing components.
Dominant Regions, Countries, or Segments in Low Temperature Plasma Sterilization
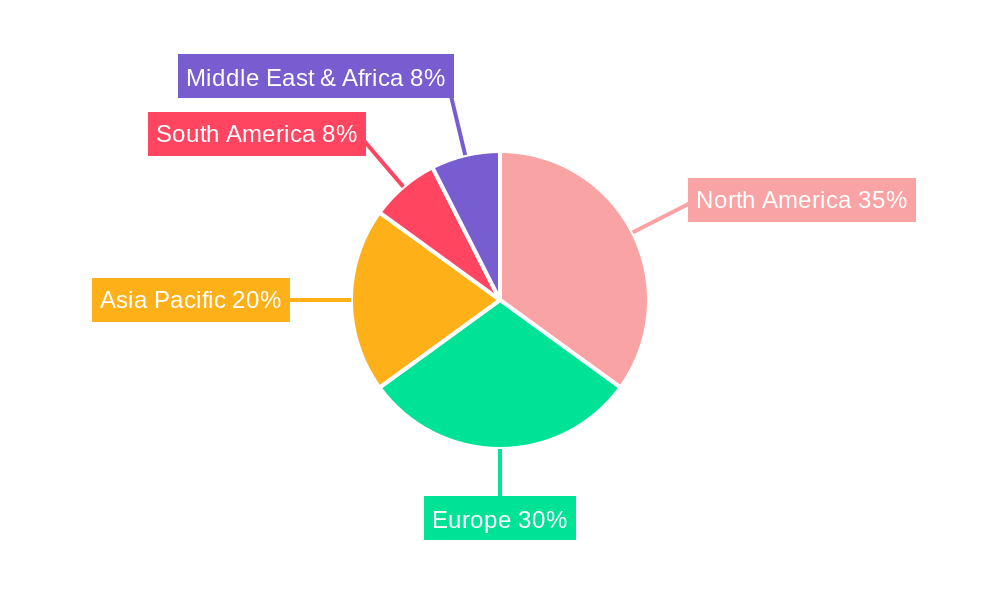
North America currently holds a dominant position in the global Low Temperature Plasma Sterilization market, driven by a sophisticated healthcare infrastructure, high disposable incomes, and a proactive regulatory environment that prioritizes patient safety and infection control. The region's robust demand stems significantly from its extensive network of hospitals and clinics, which are early adopters of advanced medical technologies. The Hospitals application segment is the primary growth engine within North America, accounting for an estimated 65% of the regional market share in 2025. Key drivers for this dominance include substantial government funding for healthcare modernization, the presence of leading medical research institutions, and a strong emphasis on adhering to stringent sterilization standards. Furthermore, the increasing prevalence of minimally invasive surgeries, which require sterilization of complex, heat-sensitive instruments, further fuels demand for low temperature plasma sterilization.
The Above 150L segment, in terms of sterilizer capacity, is also witnessing significant traction in North America due to the high volume of procedures conducted in large medical centers. This segment is estimated to contribute around 40% to the overall market value within the region. Economic policies that incentivize technological adoption and a well-established reimbursement system for advanced sterilization practices further solidify North America's leadership.
In terms of individual countries, the United States spearheads this regional dominance, representing over 80% of the North American market share. The country's healthcare expenditure, coupled with aggressive product development and market penetration strategies by key players, ensures its continued leadership. The growth potential in North America remains substantial, driven by ongoing technological advancements and the continuous need for superior infection control solutions. The market share of low temperature plasma sterilization in the broader sterilization market in North America is projected to grow from 20% in 2025 to 30% by 2033.
Low Temperature Plasma Sterilization Product Landscape
The Low Temperature Plasma Sterilization product landscape is characterized by continuous innovation, with manufacturers focusing on developing systems that offer enhanced efficiency, faster cycle times, and improved material compatibility. Key advancements include the integration of advanced plasma generation technologies, such as radio frequency (RF) and microwave plasma, to achieve higher sterilization efficacy at lower temperatures. Newer systems are designed with user-friendly interfaces, automated processes, and sophisticated monitoring capabilities to ensure reproducible and validated sterilization cycles. Unique selling propositions often revolve around the ability to sterilize a broad range of heat-sensitive and moisture-sensitive medical devices, including flexible endoscopes, surgical instruments, and complex electronic components, without causing damage. These advancements address the critical need for reliable sterilization in an era of increasingly sophisticated medical equipment.
Key Drivers, Barriers & Challenges in Low Temperature Plasma Sterilization
Key Drivers:
- Increasing Prevalence of Heat-Sensitive Medical Devices: The growing use of complex, delicate instruments that cannot withstand high temperatures is a primary driver.
- Stricter Infection Control Regulations: Evolving guidelines and mandates for patient safety and healthcare-associated infection (HAI) prevention propel the demand for advanced sterilization methods.
- Technological Advancements: Innovations in plasma technology, leading to faster cycle times and broader material compatibility, enhance the appeal of low temperature plasma sterilization.
- Environmental and Health Concerns with Traditional Methods: Growing awareness of the risks associated with Ethylene Oxide (EtO) sterilization encourages a shift towards safer alternatives.
Barriers & Challenges:
- High Initial Capital Investment: The significant upfront cost of plasma sterilization equipment can be a deterrent for smaller healthcare facilities.
- Complexity of Operation and Validation: While improving, these systems can still require specialized training and rigorous validation processes, impacting adoption speed.
- Competition from Established Sterilization Methods: Traditional methods like steam and EtO sterilization have long-standing market presence and lower perceived costs for some applications.
- Limited Penetration in Certain Emerging Markets: Infrastructure limitations and cost sensitivities in some regions can hinder widespread adoption. For instance, supply chain disruptions in critical components for plasma generators have historically led to price increases of 5-10% for equipment in the historical period.
Emerging Opportunities in Low Temperature Plasma Sterilization
Emerging opportunities in the Low Temperature Plasma Sterilization market lie in the expansion into new application areas beyond traditional medical instruments. This includes the sterilization of complex laboratory equipment, sensitive electronic components used in medical devices, and even certain food packaging materials where microbial contamination is a critical concern. Untapped markets in developing economies present significant potential as healthcare infrastructure improves and the demand for advanced sterilization solutions rises. Furthermore, the development of smaller, more cost-effective plasma sterilization units could cater to smaller clinics and specialized surgical centers, broadening market reach. The integration of AI and IoT for remote monitoring and predictive maintenance of sterilization systems represents another promising avenue, enhancing operational efficiency and customer service.
Growth Accelerators in the Low Temperature Plasma Sterilization Industry
Catalysts driving long-term growth in the Low Temperature Plasma Sterilization industry include significant ongoing research and development efforts focused on optimizing plasma chemistry and delivery for a wider range of materials and contaminants. Strategic partnerships between sterilization equipment manufacturers and leading medical device companies are accelerating the development of integrated sterilization solutions tailored for specific instruments. Market expansion strategies targeting underserved regions, coupled with robust educational initiatives to inform healthcare professionals about the benefits and proper usage of plasma sterilization, are also crucial growth accelerators. The increasing focus on sustainability and reduced environmental impact within the healthcare sector will further favor plasma sterilization's inherently cleaner profile compared to some traditional methods.
Key Players Shaping the Low Temperature Plasma Sterilization Market
- STERIS Plasma
- Advanced Sterilization Products
- Tuttnauer
- CURIS System
- Bioquell
- 3M
- Getinge
- Sterilucent
- MMM Group
Notable Milestones in Low Temperature Plasma Sterilization Sector
- 2019: Introduction of enhanced plasma sterilization cycles for extended instrument compatibility.
- 2020: Increased adoption of low temperature plasma sterilization in response to increased surgical backlogs and infection control measures.
- 2021: Significant investment in R&D for hydrogen peroxide-based plasma sterilization technologies.
- 2022: Emergence of smart, connected plasma sterilization systems with advanced data analytics.
- 2023: Strategic partnerships formed to address supply chain challenges for key sterilization components.
- 2024: Introduction of new regulatory guidelines in key markets that favor advanced sterilization technologies.
In-Depth Low Temperature Plasma Sterilization Market Outlook
The future outlook for the Low Temperature Plasma Sterilization market is exceptionally promising, fueled by a confluence of technological innovation and escalating global demand for effective, safe, and efficient sterilization solutions. Key growth accelerators, including the continuous refinement of plasma generation technologies, expansion into novel application areas such as laboratory and pharmaceutical manufacturing, and strategic market penetration into developing economies, are poised to drive sustained market expansion. The increasing emphasis on patient safety and the demand for sterilization methods that preserve the integrity of valuable medical instruments will continue to solidify low temperature plasma sterilization's position as a critical component of modern healthcare infection control strategies. The market is on track to witness significant growth in the coming years, presenting substantial strategic opportunities for both established players and new entrants.
Low Temperature Plasma Sterilization Segmentation
-
1. Application
- 1.1. Hospitals
- 1.2. Clinics
- 1.3. Pharmaceutical
- 1.4. Others
-
2. Types
- 2.1. 40L-100L
- 2.2. 100L-150L
- 2.3. Above 150L
Low Temperature Plasma Sterilization Segmentation By Geography
-
1. North America
- 1.1. United States
- 1.2. Canada
- 1.3. Mexico
-
2. South America
- 2.1. Brazil
- 2.2. Argentina
- 2.3. Rest of South America
-
3. Europe
- 3.1. United Kingdom
- 3.2. Germany
- 3.3. France
- 3.4. Italy
- 3.5. Spain
- 3.6. Russia
- 3.7. Benelux
- 3.8. Nordics
- 3.9. Rest of Europe
-
4. Middle East & Africa
- 4.1. Turkey
- 4.2. Israel
- 4.3. GCC
- 4.4. North Africa
- 4.5. South Africa
- 4.6. Rest of Middle East & Africa
-
5. Asia Pacific
- 5.1. China
- 5.2. India
- 5.3. Japan
- 5.4. South Korea
- 5.5. ASEAN
- 5.6. Oceania
- 5.7. Rest of Asia Pacific
Low Temperature Plasma Sterilization REPORT HIGHLIGHTS
| Aspects | Details |
|---|---|
| Study Period | 2019-2033 |
| Base Year | 2024 |
| Estimated Year | 2025 |
| Forecast Period | 2025-2033 |
| Historical Period | 2019-2024 |
| Growth Rate | CAGR of XX% from 2019-2033 |
| Segmentation |
|
Table of Contents
- 1. Introduction
- 1.1. Research Scope
- 1.2. Market Segmentation
- 1.3. Research Methodology
- 1.4. Definitions and Assumptions
- 2. Executive Summary
- 2.1. Introduction
- 3. Market Dynamics
- 3.1. Introduction
- 3.2. Market Drivers
- 3.3. Market Restrains
- 3.4. Market Trends
- 4. Market Factor Analysis
- 4.1. Porters Five Forces
- 4.2. Supply/Value Chain
- 4.3. PESTEL analysis
- 4.4. Market Entropy
- 4.5. Patent/Trademark Analysis
- 5. Global Low Temperature Plasma Sterilization Analysis, Insights and Forecast, 2019-2031
- 5.1. Market Analysis, Insights and Forecast - by Application
- 5.1.1. Hospitals
- 5.1.2. Clinics
- 5.1.3. Pharmaceutical
- 5.1.4. Others
- 5.2. Market Analysis, Insights and Forecast - by Types
- 5.2.1. 40L-100L
- 5.2.2. 100L-150L
- 5.2.3. Above 150L
- 5.3. Market Analysis, Insights and Forecast - by Region
- 5.3.1. North America
- 5.3.2. South America
- 5.3.3. Europe
- 5.3.4. Middle East & Africa
- 5.3.5. Asia Pacific
- 5.1. Market Analysis, Insights and Forecast - by Application
- 6. North America Low Temperature Plasma Sterilization Analysis, Insights and Forecast, 2019-2031
- 6.1. Market Analysis, Insights and Forecast - by Application
- 6.1.1. Hospitals
- 6.1.2. Clinics
- 6.1.3. Pharmaceutical
- 6.1.4. Others
- 6.2. Market Analysis, Insights and Forecast - by Types
- 6.2.1. 40L-100L
- 6.2.2. 100L-150L
- 6.2.3. Above 150L
- 6.1. Market Analysis, Insights and Forecast - by Application
- 7. South America Low Temperature Plasma Sterilization Analysis, Insights and Forecast, 2019-2031
- 7.1. Market Analysis, Insights and Forecast - by Application
- 7.1.1. Hospitals
- 7.1.2. Clinics
- 7.1.3. Pharmaceutical
- 7.1.4. Others
- 7.2. Market Analysis, Insights and Forecast - by Types
- 7.2.1. 40L-100L
- 7.2.2. 100L-150L
- 7.2.3. Above 150L
- 7.1. Market Analysis, Insights and Forecast - by Application
- 8. Europe Low Temperature Plasma Sterilization Analysis, Insights and Forecast, 2019-2031
- 8.1. Market Analysis, Insights and Forecast - by Application
- 8.1.1. Hospitals
- 8.1.2. Clinics
- 8.1.3. Pharmaceutical
- 8.1.4. Others
- 8.2. Market Analysis, Insights and Forecast - by Types
- 8.2.1. 40L-100L
- 8.2.2. 100L-150L
- 8.2.3. Above 150L
- 8.1. Market Analysis, Insights and Forecast - by Application
- 9. Middle East & Africa Low Temperature Plasma Sterilization Analysis, Insights and Forecast, 2019-2031
- 9.1. Market Analysis, Insights and Forecast - by Application
- 9.1.1. Hospitals
- 9.1.2. Clinics
- 9.1.3. Pharmaceutical
- 9.1.4. Others
- 9.2. Market Analysis, Insights and Forecast - by Types
- 9.2.1. 40L-100L
- 9.2.2. 100L-150L
- 9.2.3. Above 150L
- 9.1. Market Analysis, Insights and Forecast - by Application
- 10. Asia Pacific Low Temperature Plasma Sterilization Analysis, Insights and Forecast, 2019-2031
- 10.1. Market Analysis, Insights and Forecast - by Application
- 10.1.1. Hospitals
- 10.1.2. Clinics
- 10.1.3. Pharmaceutical
- 10.1.4. Others
- 10.2. Market Analysis, Insights and Forecast - by Types
- 10.2.1. 40L-100L
- 10.2.2. 100L-150L
- 10.2.3. Above 150L
- 10.1. Market Analysis, Insights and Forecast - by Application
- 11. Competitive Analysis
- 11.1. Global Market Share Analysis 2024
- 11.2. Company Profiles
- 11.2.1 STERIS Plasma
- 11.2.1.1. Overview
- 11.2.1.2. Products
- 11.2.1.3. SWOT Analysis
- 11.2.1.4. Recent Developments
- 11.2.1.5. Financials (Based on Availability)
- 11.2.2 Advanced Sterilization Products
- 11.2.2.1. Overview
- 11.2.2.2. Products
- 11.2.2.3. SWOT Analysis
- 11.2.2.4. Recent Developments
- 11.2.2.5. Financials (Based on Availability)
- 11.2.3 Tuttnauer
- 11.2.3.1. Overview
- 11.2.3.2. Products
- 11.2.3.3. SWOT Analysis
- 11.2.3.4. Recent Developments
- 11.2.3.5. Financials (Based on Availability)
- 11.2.4 CURIS System
- 11.2.4.1. Overview
- 11.2.4.2. Products
- 11.2.4.3. SWOT Analysis
- 11.2.4.4. Recent Developments
- 11.2.4.5. Financials (Based on Availability)
- 11.2.5 Bioquell
- 11.2.5.1. Overview
- 11.2.5.2. Products
- 11.2.5.3. SWOT Analysis
- 11.2.5.4. Recent Developments
- 11.2.5.5. Financials (Based on Availability)
- 11.2.6 3M
- 11.2.6.1. Overview
- 11.2.6.2. Products
- 11.2.6.3. SWOT Analysis
- 11.2.6.4. Recent Developments
- 11.2.6.5. Financials (Based on Availability)
- 11.2.7 Getinge
- 11.2.7.1. Overview
- 11.2.7.2. Products
- 11.2.7.3. SWOT Analysis
- 11.2.7.4. Recent Developments
- 11.2.7.5. Financials (Based on Availability)
- 11.2.8 Sterilucent
- 11.2.8.1. Overview
- 11.2.8.2. Products
- 11.2.8.3. SWOT Analysis
- 11.2.8.4. Recent Developments
- 11.2.8.5. Financials (Based on Availability)
- 11.2.9 MMM Group
- 11.2.9.1. Overview
- 11.2.9.2. Products
- 11.2.9.3. SWOT Analysis
- 11.2.9.4. Recent Developments
- 11.2.9.5. Financials (Based on Availability)
- 11.2.1 STERIS Plasma
List of Figures
- Figure 1: Global Low Temperature Plasma Sterilization Revenue Breakdown (million, %) by Region 2024 & 2032
- Figure 2: Global Low Temperature Plasma Sterilization Volume Breakdown (K, %) by Region 2024 & 2032
- Figure 3: North America Low Temperature Plasma Sterilization Revenue (million), by Application 2024 & 2032
- Figure 4: North America Low Temperature Plasma Sterilization Volume (K), by Application 2024 & 2032
- Figure 5: North America Low Temperature Plasma Sterilization Revenue Share (%), by Application 2024 & 2032
- Figure 6: North America Low Temperature Plasma Sterilization Volume Share (%), by Application 2024 & 2032
- Figure 7: North America Low Temperature Plasma Sterilization Revenue (million), by Types 2024 & 2032
- Figure 8: North America Low Temperature Plasma Sterilization Volume (K), by Types 2024 & 2032
- Figure 9: North America Low Temperature Plasma Sterilization Revenue Share (%), by Types 2024 & 2032
- Figure 10: North America Low Temperature Plasma Sterilization Volume Share (%), by Types 2024 & 2032
- Figure 11: North America Low Temperature Plasma Sterilization Revenue (million), by Country 2024 & 2032
- Figure 12: North America Low Temperature Plasma Sterilization Volume (K), by Country 2024 & 2032
- Figure 13: North America Low Temperature Plasma Sterilization Revenue Share (%), by Country 2024 & 2032
- Figure 14: North America Low Temperature Plasma Sterilization Volume Share (%), by Country 2024 & 2032
- Figure 15: South America Low Temperature Plasma Sterilization Revenue (million), by Application 2024 & 2032
- Figure 16: South America Low Temperature Plasma Sterilization Volume (K), by Application 2024 & 2032
- Figure 17: South America Low Temperature Plasma Sterilization Revenue Share (%), by Application 2024 & 2032
- Figure 18: South America Low Temperature Plasma Sterilization Volume Share (%), by Application 2024 & 2032
- Figure 19: South America Low Temperature Plasma Sterilization Revenue (million), by Types 2024 & 2032
- Figure 20: South America Low Temperature Plasma Sterilization Volume (K), by Types 2024 & 2032
- Figure 21: South America Low Temperature Plasma Sterilization Revenue Share (%), by Types 2024 & 2032
- Figure 22: South America Low Temperature Plasma Sterilization Volume Share (%), by Types 2024 & 2032
- Figure 23: South America Low Temperature Plasma Sterilization Revenue (million), by Country 2024 & 2032
- Figure 24: South America Low Temperature Plasma Sterilization Volume (K), by Country 2024 & 2032
- Figure 25: South America Low Temperature Plasma Sterilization Revenue Share (%), by Country 2024 & 2032
- Figure 26: South America Low Temperature Plasma Sterilization Volume Share (%), by Country 2024 & 2032
- Figure 27: Europe Low Temperature Plasma Sterilization Revenue (million), by Application 2024 & 2032
- Figure 28: Europe Low Temperature Plasma Sterilization Volume (K), by Application 2024 & 2032
- Figure 29: Europe Low Temperature Plasma Sterilization Revenue Share (%), by Application 2024 & 2032
- Figure 30: Europe Low Temperature Plasma Sterilization Volume Share (%), by Application 2024 & 2032
- Figure 31: Europe Low Temperature Plasma Sterilization Revenue (million), by Types 2024 & 2032
- Figure 32: Europe Low Temperature Plasma Sterilization Volume (K), by Types 2024 & 2032
- Figure 33: Europe Low Temperature Plasma Sterilization Revenue Share (%), by Types 2024 & 2032
- Figure 34: Europe Low Temperature Plasma Sterilization Volume Share (%), by Types 2024 & 2032
- Figure 35: Europe Low Temperature Plasma Sterilization Revenue (million), by Country 2024 & 2032
- Figure 36: Europe Low Temperature Plasma Sterilization Volume (K), by Country 2024 & 2032
- Figure 37: Europe Low Temperature Plasma Sterilization Revenue Share (%), by Country 2024 & 2032
- Figure 38: Europe Low Temperature Plasma Sterilization Volume Share (%), by Country 2024 & 2032
- Figure 39: Middle East & Africa Low Temperature Plasma Sterilization Revenue (million), by Application 2024 & 2032
- Figure 40: Middle East & Africa Low Temperature Plasma Sterilization Volume (K), by Application 2024 & 2032
- Figure 41: Middle East & Africa Low Temperature Plasma Sterilization Revenue Share (%), by Application 2024 & 2032
- Figure 42: Middle East & Africa Low Temperature Plasma Sterilization Volume Share (%), by Application 2024 & 2032
- Figure 43: Middle East & Africa Low Temperature Plasma Sterilization Revenue (million), by Types 2024 & 2032
- Figure 44: Middle East & Africa Low Temperature Plasma Sterilization Volume (K), by Types 2024 & 2032
- Figure 45: Middle East & Africa Low Temperature Plasma Sterilization Revenue Share (%), by Types 2024 & 2032
- Figure 46: Middle East & Africa Low Temperature Plasma Sterilization Volume Share (%), by Types 2024 & 2032
- Figure 47: Middle East & Africa Low Temperature Plasma Sterilization Revenue (million), by Country 2024 & 2032
- Figure 48: Middle East & Africa Low Temperature Plasma Sterilization Volume (K), by Country 2024 & 2032
- Figure 49: Middle East & Africa Low Temperature Plasma Sterilization Revenue Share (%), by Country 2024 & 2032
- Figure 50: Middle East & Africa Low Temperature Plasma Sterilization Volume Share (%), by Country 2024 & 2032
- Figure 51: Asia Pacific Low Temperature Plasma Sterilization Revenue (million), by Application 2024 & 2032
- Figure 52: Asia Pacific Low Temperature Plasma Sterilization Volume (K), by Application 2024 & 2032
- Figure 53: Asia Pacific Low Temperature Plasma Sterilization Revenue Share (%), by Application 2024 & 2032
- Figure 54: Asia Pacific Low Temperature Plasma Sterilization Volume Share (%), by Application 2024 & 2032
- Figure 55: Asia Pacific Low Temperature Plasma Sterilization Revenue (million), by Types 2024 & 2032
- Figure 56: Asia Pacific Low Temperature Plasma Sterilization Volume (K), by Types 2024 & 2032
- Figure 57: Asia Pacific Low Temperature Plasma Sterilization Revenue Share (%), by Types 2024 & 2032
- Figure 58: Asia Pacific Low Temperature Plasma Sterilization Volume Share (%), by Types 2024 & 2032
- Figure 59: Asia Pacific Low Temperature Plasma Sterilization Revenue (million), by Country 2024 & 2032
- Figure 60: Asia Pacific Low Temperature Plasma Sterilization Volume (K), by Country 2024 & 2032
- Figure 61: Asia Pacific Low Temperature Plasma Sterilization Revenue Share (%), by Country 2024 & 2032
- Figure 62: Asia Pacific Low Temperature Plasma Sterilization Volume Share (%), by Country 2024 & 2032
List of Tables
- Table 1: Global Low Temperature Plasma Sterilization Revenue million Forecast, by Region 2019 & 2032
- Table 2: Global Low Temperature Plasma Sterilization Volume K Forecast, by Region 2019 & 2032
- Table 3: Global Low Temperature Plasma Sterilization Revenue million Forecast, by Application 2019 & 2032
- Table 4: Global Low Temperature Plasma Sterilization Volume K Forecast, by Application 2019 & 2032
- Table 5: Global Low Temperature Plasma Sterilization Revenue million Forecast, by Types 2019 & 2032
- Table 6: Global Low Temperature Plasma Sterilization Volume K Forecast, by Types 2019 & 2032
- Table 7: Global Low Temperature Plasma Sterilization Revenue million Forecast, by Region 2019 & 2032
- Table 8: Global Low Temperature Plasma Sterilization Volume K Forecast, by Region 2019 & 2032
- Table 9: Global Low Temperature Plasma Sterilization Revenue million Forecast, by Application 2019 & 2032
- Table 10: Global Low Temperature Plasma Sterilization Volume K Forecast, by Application 2019 & 2032
- Table 11: Global Low Temperature Plasma Sterilization Revenue million Forecast, by Types 2019 & 2032
- Table 12: Global Low Temperature Plasma Sterilization Volume K Forecast, by Types 2019 & 2032
- Table 13: Global Low Temperature Plasma Sterilization Revenue million Forecast, by Country 2019 & 2032
- Table 14: Global Low Temperature Plasma Sterilization Volume K Forecast, by Country 2019 & 2032
- Table 15: United States Low Temperature Plasma Sterilization Revenue (million) Forecast, by Application 2019 & 2032
- Table 16: United States Low Temperature Plasma Sterilization Volume (K) Forecast, by Application 2019 & 2032
- Table 17: Canada Low Temperature Plasma Sterilization Revenue (million) Forecast, by Application 2019 & 2032
- Table 18: Canada Low Temperature Plasma Sterilization Volume (K) Forecast, by Application 2019 & 2032
- Table 19: Mexico Low Temperature Plasma Sterilization Revenue (million) Forecast, by Application 2019 & 2032
- Table 20: Mexico Low Temperature Plasma Sterilization Volume (K) Forecast, by Application 2019 & 2032
- Table 21: Global Low Temperature Plasma Sterilization Revenue million Forecast, by Application 2019 & 2032
- Table 22: Global Low Temperature Plasma Sterilization Volume K Forecast, by Application 2019 & 2032
- Table 23: Global Low Temperature Plasma Sterilization Revenue million Forecast, by Types 2019 & 2032
- Table 24: Global Low Temperature Plasma Sterilization Volume K Forecast, by Types 2019 & 2032
- Table 25: Global Low Temperature Plasma Sterilization Revenue million Forecast, by Country 2019 & 2032
- Table 26: Global Low Temperature Plasma Sterilization Volume K Forecast, by Country 2019 & 2032
- Table 27: Brazil Low Temperature Plasma Sterilization Revenue (million) Forecast, by Application 2019 & 2032
- Table 28: Brazil Low Temperature Plasma Sterilization Volume (K) Forecast, by Application 2019 & 2032
- Table 29: Argentina Low Temperature Plasma Sterilization Revenue (million) Forecast, by Application 2019 & 2032
- Table 30: Argentina Low Temperature Plasma Sterilization Volume (K) Forecast, by Application 2019 & 2032
- Table 31: Rest of South America Low Temperature Plasma Sterilization Revenue (million) Forecast, by Application 2019 & 2032
- Table 32: Rest of South America Low Temperature Plasma Sterilization Volume (K) Forecast, by Application 2019 & 2032
- Table 33: Global Low Temperature Plasma Sterilization Revenue million Forecast, by Application 2019 & 2032
- Table 34: Global Low Temperature Plasma Sterilization Volume K Forecast, by Application 2019 & 2032
- Table 35: Global Low Temperature Plasma Sterilization Revenue million Forecast, by Types 2019 & 2032
- Table 36: Global Low Temperature Plasma Sterilization Volume K Forecast, by Types 2019 & 2032
- Table 37: Global Low Temperature Plasma Sterilization Revenue million Forecast, by Country 2019 & 2032
- Table 38: Global Low Temperature Plasma Sterilization Volume K Forecast, by Country 2019 & 2032
- Table 39: United Kingdom Low Temperature Plasma Sterilization Revenue (million) Forecast, by Application 2019 & 2032
- Table 40: United Kingdom Low Temperature Plasma Sterilization Volume (K) Forecast, by Application 2019 & 2032
- Table 41: Germany Low Temperature Plasma Sterilization Revenue (million) Forecast, by Application 2019 & 2032
- Table 42: Germany Low Temperature Plasma Sterilization Volume (K) Forecast, by Application 2019 & 2032
- Table 43: France Low Temperature Plasma Sterilization Revenue (million) Forecast, by Application 2019 & 2032
- Table 44: France Low Temperature Plasma Sterilization Volume (K) Forecast, by Application 2019 & 2032
- Table 45: Italy Low Temperature Plasma Sterilization Revenue (million) Forecast, by Application 2019 & 2032
- Table 46: Italy Low Temperature Plasma Sterilization Volume (K) Forecast, by Application 2019 & 2032
- Table 47: Spain Low Temperature Plasma Sterilization Revenue (million) Forecast, by Application 2019 & 2032
- Table 48: Spain Low Temperature Plasma Sterilization Volume (K) Forecast, by Application 2019 & 2032
- Table 49: Russia Low Temperature Plasma Sterilization Revenue (million) Forecast, by Application 2019 & 2032
- Table 50: Russia Low Temperature Plasma Sterilization Volume (K) Forecast, by Application 2019 & 2032
- Table 51: Benelux Low Temperature Plasma Sterilization Revenue (million) Forecast, by Application 2019 & 2032
- Table 52: Benelux Low Temperature Plasma Sterilization Volume (K) Forecast, by Application 2019 & 2032
- Table 53: Nordics Low Temperature Plasma Sterilization Revenue (million) Forecast, by Application 2019 & 2032
- Table 54: Nordics Low Temperature Plasma Sterilization Volume (K) Forecast, by Application 2019 & 2032
- Table 55: Rest of Europe Low Temperature Plasma Sterilization Revenue (million) Forecast, by Application 2019 & 2032
- Table 56: Rest of Europe Low Temperature Plasma Sterilization Volume (K) Forecast, by Application 2019 & 2032
- Table 57: Global Low Temperature Plasma Sterilization Revenue million Forecast, by Application 2019 & 2032
- Table 58: Global Low Temperature Plasma Sterilization Volume K Forecast, by Application 2019 & 2032
- Table 59: Global Low Temperature Plasma Sterilization Revenue million Forecast, by Types 2019 & 2032
- Table 60: Global Low Temperature Plasma Sterilization Volume K Forecast, by Types 2019 & 2032
- Table 61: Global Low Temperature Plasma Sterilization Revenue million Forecast, by Country 2019 & 2032
- Table 62: Global Low Temperature Plasma Sterilization Volume K Forecast, by Country 2019 & 2032
- Table 63: Turkey Low Temperature Plasma Sterilization Revenue (million) Forecast, by Application 2019 & 2032
- Table 64: Turkey Low Temperature Plasma Sterilization Volume (K) Forecast, by Application 2019 & 2032
- Table 65: Israel Low Temperature Plasma Sterilization Revenue (million) Forecast, by Application 2019 & 2032
- Table 66: Israel Low Temperature Plasma Sterilization Volume (K) Forecast, by Application 2019 & 2032
- Table 67: GCC Low Temperature Plasma Sterilization Revenue (million) Forecast, by Application 2019 & 2032
- Table 68: GCC Low Temperature Plasma Sterilization Volume (K) Forecast, by Application 2019 & 2032
- Table 69: North Africa Low Temperature Plasma Sterilization Revenue (million) Forecast, by Application 2019 & 2032
- Table 70: North Africa Low Temperature Plasma Sterilization Volume (K) Forecast, by Application 2019 & 2032
- Table 71: South Africa Low Temperature Plasma Sterilization Revenue (million) Forecast, by Application 2019 & 2032
- Table 72: South Africa Low Temperature Plasma Sterilization Volume (K) Forecast, by Application 2019 & 2032
- Table 73: Rest of Middle East & Africa Low Temperature Plasma Sterilization Revenue (million) Forecast, by Application 2019 & 2032
- Table 74: Rest of Middle East & Africa Low Temperature Plasma Sterilization Volume (K) Forecast, by Application 2019 & 2032
- Table 75: Global Low Temperature Plasma Sterilization Revenue million Forecast, by Application 2019 & 2032
- Table 76: Global Low Temperature Plasma Sterilization Volume K Forecast, by Application 2019 & 2032
- Table 77: Global Low Temperature Plasma Sterilization Revenue million Forecast, by Types 2019 & 2032
- Table 78: Global Low Temperature Plasma Sterilization Volume K Forecast, by Types 2019 & 2032
- Table 79: Global Low Temperature Plasma Sterilization Revenue million Forecast, by Country 2019 & 2032
- Table 80: Global Low Temperature Plasma Sterilization Volume K Forecast, by Country 2019 & 2032
- Table 81: China Low Temperature Plasma Sterilization Revenue (million) Forecast, by Application 2019 & 2032
- Table 82: China Low Temperature Plasma Sterilization Volume (K) Forecast, by Application 2019 & 2032
- Table 83: India Low Temperature Plasma Sterilization Revenue (million) Forecast, by Application 2019 & 2032
- Table 84: India Low Temperature Plasma Sterilization Volume (K) Forecast, by Application 2019 & 2032
- Table 85: Japan Low Temperature Plasma Sterilization Revenue (million) Forecast, by Application 2019 & 2032
- Table 86: Japan Low Temperature Plasma Sterilization Volume (K) Forecast, by Application 2019 & 2032
- Table 87: South Korea Low Temperature Plasma Sterilization Revenue (million) Forecast, by Application 2019 & 2032
- Table 88: South Korea Low Temperature Plasma Sterilization Volume (K) Forecast, by Application 2019 & 2032
- Table 89: ASEAN Low Temperature Plasma Sterilization Revenue (million) Forecast, by Application 2019 & 2032
- Table 90: ASEAN Low Temperature Plasma Sterilization Volume (K) Forecast, by Application 2019 & 2032
- Table 91: Oceania Low Temperature Plasma Sterilization Revenue (million) Forecast, by Application 2019 & 2032
- Table 92: Oceania Low Temperature Plasma Sterilization Volume (K) Forecast, by Application 2019 & 2032
- Table 93: Rest of Asia Pacific Low Temperature Plasma Sterilization Revenue (million) Forecast, by Application 2019 & 2032
- Table 94: Rest of Asia Pacific Low Temperature Plasma Sterilization Volume (K) Forecast, by Application 2019 & 2032
Frequently Asked Questions
1. What is the projected Compound Annual Growth Rate (CAGR) of the Low Temperature Plasma Sterilization?
The projected CAGR is approximately XX%.
2. Which companies are prominent players in the Low Temperature Plasma Sterilization?
Key companies in the market include STERIS Plasma, Advanced Sterilization Products, Tuttnauer, CURIS System, Bioquell, 3M, Getinge, Sterilucent, MMM Group.
3. What are the main segments of the Low Temperature Plasma Sterilization?
The market segments include Application, Types.
4. Can you provide details about the market size?
The market size is estimated to be USD XXX million as of 2022.
5. What are some drivers contributing to market growth?
N/A
6. What are the notable trends driving market growth?
N/A
7. Are there any restraints impacting market growth?
N/A
8. Can you provide examples of recent developments in the market?
N/A
9. What pricing options are available for accessing the report?
Pricing options include single-user, multi-user, and enterprise licenses priced at USD 3350.00, USD 5025.00, and USD 6700.00 respectively.
10. Is the market size provided in terms of value or volume?
The market size is provided in terms of value, measured in million and volume, measured in K.
11. Are there any specific market keywords associated with the report?
Yes, the market keyword associated with the report is "Low Temperature Plasma Sterilization," which aids in identifying and referencing the specific market segment covered.
12. How do I determine which pricing option suits my needs best?
The pricing options vary based on user requirements and access needs. Individual users may opt for single-user licenses, while businesses requiring broader access may choose multi-user or enterprise licenses for cost-effective access to the report.
13. Are there any additional resources or data provided in the Low Temperature Plasma Sterilization report?
While the report offers comprehensive insights, it's advisable to review the specific contents or supplementary materials provided to ascertain if additional resources or data are available.
14. How can I stay updated on further developments or reports in the Low Temperature Plasma Sterilization?
To stay informed about further developments, trends, and reports in the Low Temperature Plasma Sterilization, consider subscribing to industry newsletters, following relevant companies and organizations, or regularly checking reputable industry news sources and publications.
Methodology
Step 1 - Identification of Relevant Samples Size from Population Database


Step 2 - Approaches for Defining Global Market Size (Value, Volume* & Price*)

Note*: In applicable scenarios
Step 3 - Data Sources
Primary Research
- Web Analytics
- Survey Reports
- Research Institute
- Latest Research Reports
- Opinion Leaders
Secondary Research
- Annual Reports
- White Paper
- Latest Press Release
- Industry Association
- Paid Database
- Investor Presentations

Step 4 - Data Triangulation
Involves using different sources of information in order to increase the validity of a study
These sources are likely to be stakeholders in a program - participants, other researchers, program staff, other community members, and so on.
Then we put all data in single framework & apply various statistical tools to find out the dynamic on the market.
During the analysis stage, feedback from the stakeholder groups would be compared to determine areas of agreement as well as areas of divergence
