

Key Insights
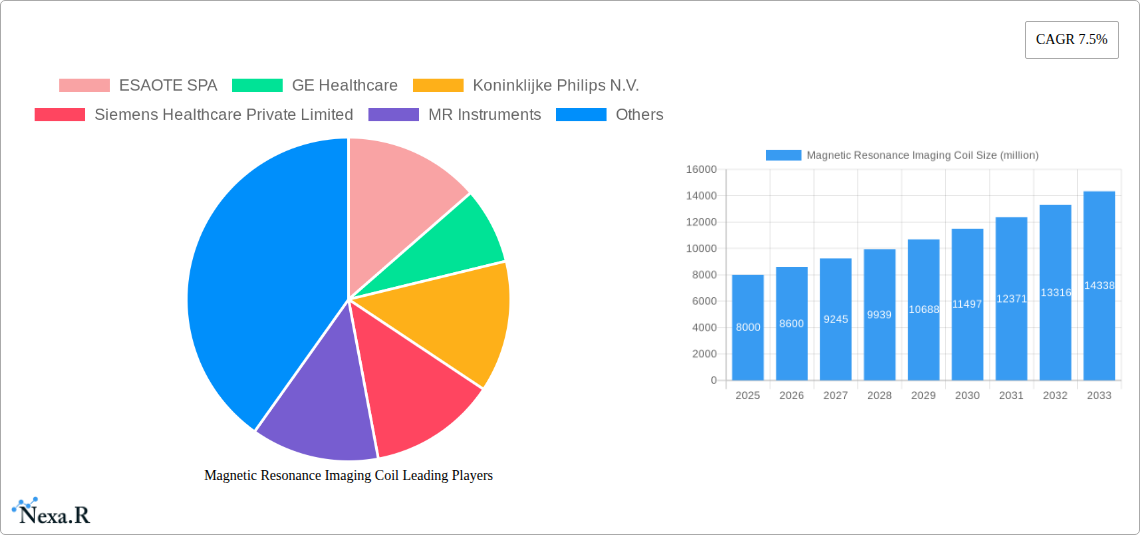
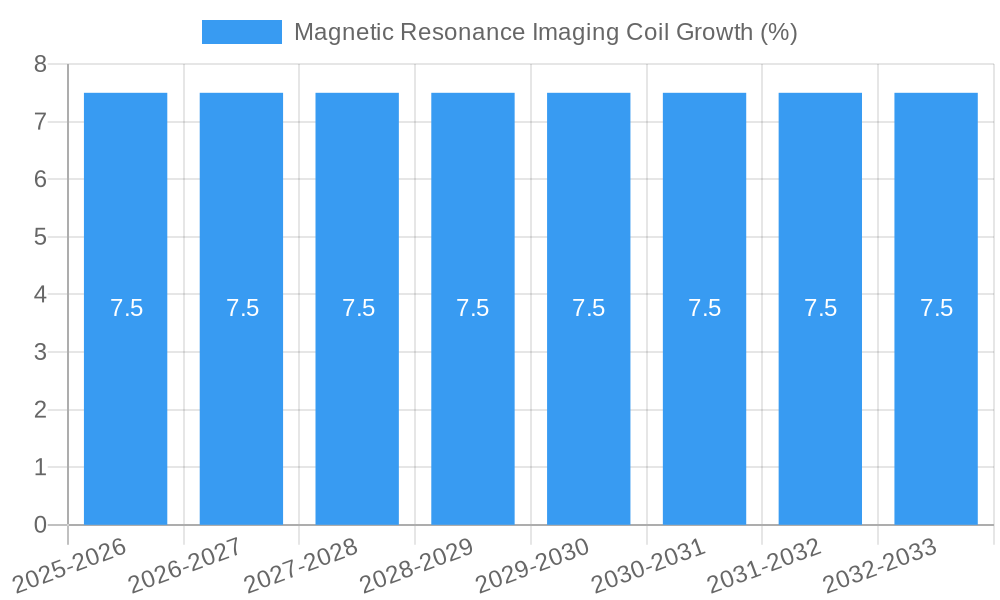
The global Magnetic Resonance Imaging (MRI) coil market is projected for robust growth, estimated at a market size of $8 billion in 2025, with a projected Compound Annual Growth Rate (CAGR) of 7.5% through 2033. This expansion is primarily driven by the increasing prevalence of chronic diseases such as neurological disorders and cardiovascular conditions, which necessitate advanced diagnostic imaging techniques. The growing demand for early and accurate diagnosis fuels the adoption of sophisticated MRI coils designed to enhance image quality and patient comfort. Furthermore, technological advancements, including the development of novel coil designs for improved signal-to-noise ratio and faster scanning times, are key contributors to market dynamism. The expansion of healthcare infrastructure, particularly in emerging economies, and increasing healthcare expenditure also play a significant role in this upward trajectory.
The market segmentation by application highlights the strong demand from Neurology and Cardiovascular sectors, reflecting the high burden of related diseases. Spine and Musculoskeletal applications also represent a substantial segment due to the aging population and rise in sports-related injuries. The market is further categorized by coil types, with Radiofrequency Coils and Gradient Coils being the primary components. While the market benefits from these strong growth drivers, certain restraints, such as the high cost of MRI systems and the limited availability of skilled radiographers in some regions, could potentially temper growth. However, the continuous innovation by leading companies like GE Healthcare, Siemens Healthcare, and Koninklijke Philips N.V., coupled with strategic collaborations and mergers, is expected to mitigate these challenges and propel the MRI coil market to new heights, solidifying its crucial role in modern medical diagnostics.
Magnetic Resonance Imaging Coil Market Dynamics & Structure
The global Magnetic Resonance Imaging (MRI) coil market exhibits a moderately concentrated structure, with key players like GE Healthcare, Siemens Healthcare Private Limited, and Koninklijke Philips N.V. holding significant market shares, estimated to be around XX million units in the base year 2025. Technological innovation is a primary driver, fueled by advancements in coil design, materials science, and signal processing, leading to enhanced image quality and patient comfort. The regulatory landscape, governed by bodies like the FDA and EMA, plays a crucial role in product approval and market access, ensuring safety and efficacy. Competitive product substitutes, though limited in direct replacement, include other advanced imaging modalities, emphasizing the need for continuous innovation within MRI coil technology. End-user demographics are shifting towards an aging global population and a rising prevalence of chronic diseases, increasing demand for sophisticated diagnostic tools. Mergers and acquisitions (M&A) are becoming more frequent as larger players aim to consolidate market position and acquire specialized technologies. For instance, recent M&A activities in the historical period (2019-2024) reached an estimated XX deal volumes, with an estimated value of XX million units. Innovation barriers include the high cost of R&D, stringent regulatory pathways, and the need for specialized expertise in electromagnetics and medical physics.
- Market Concentration: Moderate to high, dominated by established medical imaging giants.
- Technological Innovation: Driven by miniaturization, improved signal-to-noise ratio (SNR), and advanced materials for enhanced patient compatibility.
- Regulatory Frameworks: Strict approval processes by FDA, EMA, and other national health authorities.
- Competitive Product Substitutes: Limited direct substitutes, but competition from PET-CT and advanced ultrasound.
- End-User Demographics: Growing demand from aging populations and increasing incidence of neurological, cardiovascular, and orthopedic conditions.
- M&A Trends: Increasing consolidation to gain market share and access to novel technologies.
Magnetic Resonance Imaging Coil Growth Trends & Insights
The global Magnetic Resonance Imaging (MRI) coil market is projected to witness robust growth, driven by an increasing demand for advanced diagnostic imaging solutions and a growing awareness of early disease detection. The market size, estimated at approximately XX million units in the base year 2025, is anticipated to expand at a Compound Annual Growth Rate (CAGR) of XX% during the forecast period of 2025–2033. This growth is underpinned by several key trends, including the continuous development of novel MRI coil technologies that offer superior image resolution and faster scan times, directly impacting diagnostic accuracy. The adoption rate of these advanced coils is steadily increasing in both established and emerging markets, as healthcare providers invest in upgrading their imaging infrastructure to remain competitive and improve patient outcomes.
Technological disruptions are at the forefront of market evolution. The integration of artificial intelligence (AI) and machine learning (ML) algorithms in MRI coil development is enhancing image reconstruction and artifact reduction, leading to more precise diagnoses. Furthermore, the development of specialized coils for specific anatomical regions and clinical applications, such as ultra-high field MRI coils and wearable or flexible coils, is broadening the scope of MRI applications and driving market penetration. Consumer behavior shifts are also playing a significant role. Patients and healthcare professionals are increasingly prioritizing non-invasive diagnostic methods with minimal radiation exposure, positioning MRI as a preferred modality. This preference, coupled with the expanding applications of MRI in fields like neurology, cardiovascular imaging, and musculoskeletal diagnostics, is creating a sustained demand for high-performance MRI coils. The market penetration of advanced MRI coil technologies is expected to reach approximately XX% by 2033. The total market revenue is projected to reach XX million units by the end of the forecast period. The historical period (2019-2024) saw a market expansion from XX million units to XX million units, indicating a strong historical growth trajectory.
Dominant Regions, Countries, or Segments in Magnetic Resonance Imaging Coil
The Neurology application segment stands as a dominant force within the global Magnetic Resonance Imaging (MRI) coil market, spearheading growth and innovation from the base year 2025 onwards. This dominance is driven by the increasing global burden of neurological disorders, including Alzheimer's disease, Parkinson's disease, stroke, and epilepsy, all of which necessitate detailed and high-resolution imaging for accurate diagnosis, treatment planning, and monitoring. In the base year 2025, the neurology segment is estimated to account for a significant XX% of the total MRI coil market share, valued at approximately XX million units. The growing prevalence of these conditions, coupled with an aging global population prone to neurodegenerative diseases, fuels a perpetual demand for advanced MRI coils capable of providing intricate anatomical detail and functional insights into the brain and spinal cord.
Several key drivers contribute to the neurology segment's leadership. Firstly, significant advancements in MRI coil technology specifically tailored for neurological applications, such as higher channel count head coils, diffusion tensor imaging (DTI) specific coils, and functional MRI (fMRI) coils, enable researchers and clinicians to visualize subtle neurological changes with unprecedented clarity. These technological advancements allow for the detection of early-stage diseases and the precise mapping of neural pathways, crucial for conditions like multiple sclerosis and brain tumors. Secondly, substantial investments in research and development by leading market players, including GE Healthcare and Siemens Healthcare Private Limited, are continuously bringing innovative neurological MRI coils to market. These investments are often supported by government funding for neuroscience research and public health initiatives aimed at combating neurological diseases. The market share for advanced neurological coils is projected to grow at a CAGR of XX% during the forecast period (2025–2033).
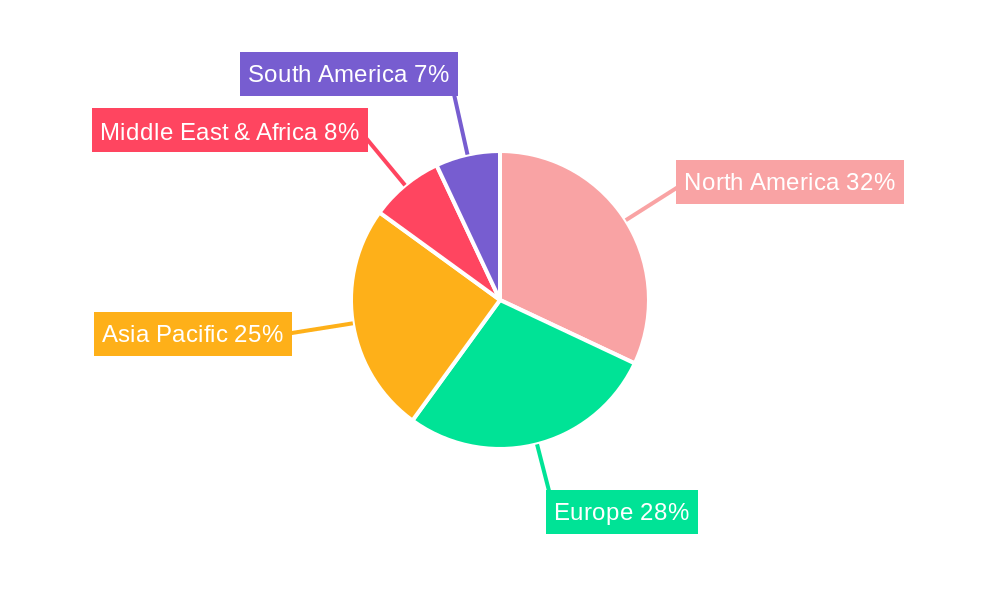
Geographically, North America and Europe currently lead the market in terms of revenue and adoption of advanced neurological MRI coils, owing to well-established healthcare infrastructures, high per capita healthcare spending, and a high prevalence of neurological disorders. However, the Asia-Pacific region is emerging as a significant growth engine, driven by rapid economic development, increasing healthcare expenditure, and a rising awareness of advanced diagnostic procedures. For instance, the market penetration of high-density neurological coils in countries like China and India is expected to witness a substantial increase. The Radiofrequency Coil type also plays a crucial role across all applications, including neurology, as it is fundamental to the MRI process. However, within the application landscape, neurology’s intrinsic demand for high-fidelity imaging firmly establishes it as the primary growth driver. The market share of the neurology segment is projected to reach XX million units by 2033.
Magnetic Resonance Imaging Coil Product Landscape
The MRI coil product landscape is characterized by continuous innovation focused on enhancing image quality, patient comfort, and workflow efficiency. Key product developments include higher channel count radiofrequency (RF) coils, offering superior signal-to-noise ratios and faster imaging. advancements in gradient coils are enabling faster gradient switching and improved spatial resolution. Flexible and wearable coils are emerging for specialized applications and improved patient positioning. The unique selling proposition of newer coils lies in their ability to accommodate a wider range of patient anatomies and reduce scan times, thereby improving throughput and patient experience. Technological advancements are also seen in materials science, leading to lighter and more durable coil designs.
Key Drivers, Barriers & Challenges in Magnetic Resonance Imaging Coil
Key Drivers:
- Rising prevalence of chronic diseases: Increasing incidence of neurological, cardiovascular, and orthopedic conditions necessitates advanced diagnostic imaging.
- Technological advancements: Innovations in coil design, materials, and signal processing lead to improved image quality and diagnostic accuracy.
- Growing demand for non-invasive imaging: MRI's radiation-free nature makes it a preferred modality for diagnosis and monitoring.
- Aging global population: Age-related diseases significantly contribute to the demand for MRI diagnostics.
- Increasing healthcare expenditure: Growing investments in advanced medical equipment globally.
Barriers & Challenges:
- High cost of MRI systems and coils: Significant capital investment required for acquisition and maintenance.
- Stringent regulatory approvals: Lengthy and complex approval processes for new coil technologies.
- Technical expertise requirement: Specialized knowledge needed for operation, maintenance, and advanced applications.
- Supply chain disruptions: Potential impact of global events on the availability of critical components.
- Competition from alternative imaging modalities: Advancements in CT and Ultrasound can pose indirect competition.
- Reimbursement policies: Evolving reimbursement landscapes can influence adoption rates.
Emerging Opportunities in Magnetic Resonance Imaging Coil
Emerging opportunities in the MRI coil market lie in the development of ultra-high field (UHF) MRI coils (7T and above) for advanced research and specialized clinical applications, promising unprecedented spatial and temporal resolution. The expansion of AI-driven coil designs for automated image optimization and artifact reduction presents a significant avenue for growth. Furthermore, the development of cost-effective, portable, and point-of-care MRI solutions with integrated coils for remote or underserved areas represents a substantial untapped market. The increasing use of MRI in pediatric imaging and for interventional procedures also opens doors for highly specialized coil designs catering to unique patient needs and procedural requirements.
Growth Accelerators in the Magnetic Resonance Imaging Coil Industry
Growth accelerators in the MRI coil industry are primarily driven by continuous technological breakthroughs in superconductivity, signal processing, and coil element design, leading to higher field strengths and improved SNR. Strategic partnerships between MRI scanner manufacturers and specialized coil developers are crucial for integrated solutions and faster market penetration. Furthermore, expanding market access through collaborations with healthcare providers in emerging economies and the development of standardized, modular coil systems that reduce total cost of ownership will significantly fuel long-term growth. The increasing adoption of vendor-neutral archiving and AI-powered image analysis platforms also indirectly promotes the demand for high-quality data generated by advanced MRI coils.
Key Players Shaping the Magnetic Resonance Imaging Coil Market
- GE Healthcare
- Koninklijke Philips N.V.
- Siemens Healthcare Private Limited
- ESAOTE SPA
- Aurora Imaging
- HITACHI Medical Systems Europe
- IMRIS
- MR Instruments, Inc.
- Noras MRI
- Medspira
- Monteris Medical
- RAPID MR International, LLC
Notable Milestones in Magnetic Resonance Imaging Coil Sector
- 2020: Introduction of novel high-density RF coils enabling faster scan times for neurological imaging.
- 2021: Advancement in flexible coil technology for improved patient comfort in musculoskeletal imaging.
- 2022: Launch of AI-integrated coil systems for enhanced image reconstruction and artifact reduction.
- 2023: Significant investment in research for 7T and above MRI coil development for advanced applications.
- 2024: Emergence of compact and cost-effective coil solutions for point-of-care diagnostics.
In-Depth Magnetic Resonance Imaging Coil Market Outlook
The MRI coil market outlook is highly optimistic, driven by a confluence of technological innovation, increasing healthcare demand, and strategic market expansion. The continued development of advanced coil technologies, particularly in the realm of ultra-high field MRI and AI integration, promises to unlock new diagnostic frontiers and enhance existing clinical applications. Growth accelerators such as strategic collaborations between key players and expanded market penetration in developing regions will further bolster the market. Emerging opportunities in specialized applications like pediatric and interventional MRI, alongside the potential for cost-effective, portable solutions, represent significant untapped potential. The industry is well-positioned for sustained growth, driven by the imperative for more precise, efficient, and accessible medical imaging solutions globally.
Magnetic Resonance Imaging Coil Segmentation
-
1. Application
- 1.1. Neurology
- 1.2. Cardiovascular
- 1.3. Spine and Musculoskeletal
- 1.4. Others
-
2. Types
- 2.1. Radiofrequency Coil
- 2.2. Gradient Coil
Magnetic Resonance Imaging Coil Segmentation By Geography
-
1. North America
- 1.1. United States
- 1.2. Canada
- 1.3. Mexico
-
2. South America
- 2.1. Brazil
- 2.2. Argentina
- 2.3. Rest of South America
-
3. Europe
- 3.1. United Kingdom
- 3.2. Germany
- 3.3. France
- 3.4. Italy
- 3.5. Spain
- 3.6. Russia
- 3.7. Benelux
- 3.8. Nordics
- 3.9. Rest of Europe
-
4. Middle East & Africa
- 4.1. Turkey
- 4.2. Israel
- 4.3. GCC
- 4.4. North Africa
- 4.5. South Africa
- 4.6. Rest of Middle East & Africa
-
5. Asia Pacific
- 5.1. China
- 5.2. India
- 5.3. Japan
- 5.4. South Korea
- 5.5. ASEAN
- 5.6. Oceania
- 5.7. Rest of Asia Pacific
Magnetic Resonance Imaging Coil REPORT HIGHLIGHTS
| Aspects | Details |
|---|---|
| Study Period | 2019-2033 |
| Base Year | 2024 |
| Estimated Year | 2025 |
| Forecast Period | 2025-2033 |
| Historical Period | 2019-2024 |
| Growth Rate | CAGR of 7.5% from 2019-2033 |
| Segmentation |
|
Table of Contents
- 1. Introduction
- 1.1. Research Scope
- 1.2. Market Segmentation
- 1.3. Research Methodology
- 1.4. Definitions and Assumptions
- 2. Executive Summary
- 2.1. Introduction
- 3. Market Dynamics
- 3.1. Introduction
- 3.2. Market Drivers
- 3.3. Market Restrains
- 3.4. Market Trends
- 4. Market Factor Analysis
- 4.1. Porters Five Forces
- 4.2. Supply/Value Chain
- 4.3. PESTEL analysis
- 4.4. Market Entropy
- 4.5. Patent/Trademark Analysis
- 5. Global Magnetic Resonance Imaging Coil Analysis, Insights and Forecast, 2019-2031
- 5.1. Market Analysis, Insights and Forecast - by Application
- 5.1.1. Neurology
- 5.1.2. Cardiovascular
- 5.1.3. Spine and Musculoskeletal
- 5.1.4. Others
- 5.2. Market Analysis, Insights and Forecast - by Types
- 5.2.1. Radiofrequency Coil
- 5.2.2. Gradient Coil
- 5.3. Market Analysis, Insights and Forecast - by Region
- 5.3.1. North America
- 5.3.2. South America
- 5.3.3. Europe
- 5.3.4. Middle East & Africa
- 5.3.5. Asia Pacific
- 5.1. Market Analysis, Insights and Forecast - by Application
- 6. North America Magnetic Resonance Imaging Coil Analysis, Insights and Forecast, 2019-2031
- 6.1. Market Analysis, Insights and Forecast - by Application
- 6.1.1. Neurology
- 6.1.2. Cardiovascular
- 6.1.3. Spine and Musculoskeletal
- 6.1.4. Others
- 6.2. Market Analysis, Insights and Forecast - by Types
- 6.2.1. Radiofrequency Coil
- 6.2.2. Gradient Coil
- 6.1. Market Analysis, Insights and Forecast - by Application
- 7. South America Magnetic Resonance Imaging Coil Analysis, Insights and Forecast, 2019-2031
- 7.1. Market Analysis, Insights and Forecast - by Application
- 7.1.1. Neurology
- 7.1.2. Cardiovascular
- 7.1.3. Spine and Musculoskeletal
- 7.1.4. Others
- 7.2. Market Analysis, Insights and Forecast - by Types
- 7.2.1. Radiofrequency Coil
- 7.2.2. Gradient Coil
- 7.1. Market Analysis, Insights and Forecast - by Application
- 8. Europe Magnetic Resonance Imaging Coil Analysis, Insights and Forecast, 2019-2031
- 8.1. Market Analysis, Insights and Forecast - by Application
- 8.1.1. Neurology
- 8.1.2. Cardiovascular
- 8.1.3. Spine and Musculoskeletal
- 8.1.4. Others
- 8.2. Market Analysis, Insights and Forecast - by Types
- 8.2.1. Radiofrequency Coil
- 8.2.2. Gradient Coil
- 8.1. Market Analysis, Insights and Forecast - by Application
- 9. Middle East & Africa Magnetic Resonance Imaging Coil Analysis, Insights and Forecast, 2019-2031
- 9.1. Market Analysis, Insights and Forecast - by Application
- 9.1.1. Neurology
- 9.1.2. Cardiovascular
- 9.1.3. Spine and Musculoskeletal
- 9.1.4. Others
- 9.2. Market Analysis, Insights and Forecast - by Types
- 9.2.1. Radiofrequency Coil
- 9.2.2. Gradient Coil
- 9.1. Market Analysis, Insights and Forecast - by Application
- 10. Asia Pacific Magnetic Resonance Imaging Coil Analysis, Insights and Forecast, 2019-2031
- 10.1. Market Analysis, Insights and Forecast - by Application
- 10.1.1. Neurology
- 10.1.2. Cardiovascular
- 10.1.3. Spine and Musculoskeletal
- 10.1.4. Others
- 10.2. Market Analysis, Insights and Forecast - by Types
- 10.2.1. Radiofrequency Coil
- 10.2.2. Gradient Coil
- 10.1. Market Analysis, Insights and Forecast - by Application
- 11. Competitive Analysis
- 11.1. Global Market Share Analysis 2024
- 11.2. Company Profiles
- 11.2.1 ESAOTE SPA
- 11.2.1.1. Overview
- 11.2.1.2. Products
- 11.2.1.3. SWOT Analysis
- 11.2.1.4. Recent Developments
- 11.2.1.5. Financials (Based on Availability)
- 11.2.2 GE Healthcare
- 11.2.2.1. Overview
- 11.2.2.2. Products
- 11.2.2.3. SWOT Analysis
- 11.2.2.4. Recent Developments
- 11.2.2.5. Financials (Based on Availability)
- 11.2.3 Koninklijke Philips N.V.
- 11.2.3.1. Overview
- 11.2.3.2. Products
- 11.2.3.3. SWOT Analysis
- 11.2.3.4. Recent Developments
- 11.2.3.5. Financials (Based on Availability)
- 11.2.4 Siemens Healthcare Private Limited
- 11.2.4.1. Overview
- 11.2.4.2. Products
- 11.2.4.3. SWOT Analysis
- 11.2.4.4. Recent Developments
- 11.2.4.5. Financials (Based on Availability)
- 11.2.5 MR Instruments
- 11.2.5.1. Overview
- 11.2.5.2. Products
- 11.2.5.3. SWOT Analysis
- 11.2.5.4. Recent Developments
- 11.2.5.5. Financials (Based on Availability)
- 11.2.6 Inc.
- 11.2.6.1. Overview
- 11.2.6.2. Products
- 11.2.6.3. SWOT Analysis
- 11.2.6.4. Recent Developments
- 11.2.6.5. Financials (Based on Availability)
- 11.2.7 RAPID MR International
- 11.2.7.1. Overview
- 11.2.7.2. Products
- 11.2.7.3. SWOT Analysis
- 11.2.7.4. Recent Developments
- 11.2.7.5. Financials (Based on Availability)
- 11.2.8 LLC
- 11.2.8.1. Overview
- 11.2.8.2. Products
- 11.2.8.3. SWOT Analysis
- 11.2.8.4. Recent Developments
- 11.2.8.5. Financials (Based on Availability)
- 11.2.9 Aurora Imaging
- 11.2.9.1. Overview
- 11.2.9.2. Products
- 11.2.9.3. SWOT Analysis
- 11.2.9.4. Recent Developments
- 11.2.9.5. Financials (Based on Availability)
- 11.2.10 HITACHI Medical Systems Europe
- 11.2.10.1. Overview
- 11.2.10.2. Products
- 11.2.10.3. SWOT Analysis
- 11.2.10.4. Recent Developments
- 11.2.10.5. Financials (Based on Availability)
- 11.2.11 IMRIS
- 11.2.11.1. Overview
- 11.2.11.2. Products
- 11.2.11.3. SWOT Analysis
- 11.2.11.4. Recent Developments
- 11.2.11.5. Financials (Based on Availability)
- 11.2.12 Medspira
- 11.2.12.1. Overview
- 11.2.12.2. Products
- 11.2.12.3. SWOT Analysis
- 11.2.12.4. Recent Developments
- 11.2.12.5. Financials (Based on Availability)
- 11.2.13 Monteris Medical
- 11.2.13.1. Overview
- 11.2.13.2. Products
- 11.2.13.3. SWOT Analysis
- 11.2.13.4. Recent Developments
- 11.2.13.5. Financials (Based on Availability)
- 11.2.14 Noras MRI
- 11.2.14.1. Overview
- 11.2.14.2. Products
- 11.2.14.3. SWOT Analysis
- 11.2.14.4. Recent Developments
- 11.2.14.5. Financials (Based on Availability)
- 11.2.1 ESAOTE SPA
List of Figures
- Figure 1: Global Magnetic Resonance Imaging Coil Revenue Breakdown (million, %) by Region 2024 & 2032
- Figure 2: Global Magnetic Resonance Imaging Coil Volume Breakdown (K, %) by Region 2024 & 2032
- Figure 3: North America Magnetic Resonance Imaging Coil Revenue (million), by Application 2024 & 2032
- Figure 4: North America Magnetic Resonance Imaging Coil Volume (K), by Application 2024 & 2032
- Figure 5: North America Magnetic Resonance Imaging Coil Revenue Share (%), by Application 2024 & 2032
- Figure 6: North America Magnetic Resonance Imaging Coil Volume Share (%), by Application 2024 & 2032
- Figure 7: North America Magnetic Resonance Imaging Coil Revenue (million), by Types 2024 & 2032
- Figure 8: North America Magnetic Resonance Imaging Coil Volume (K), by Types 2024 & 2032
- Figure 9: North America Magnetic Resonance Imaging Coil Revenue Share (%), by Types 2024 & 2032
- Figure 10: North America Magnetic Resonance Imaging Coil Volume Share (%), by Types 2024 & 2032
- Figure 11: North America Magnetic Resonance Imaging Coil Revenue (million), by Country 2024 & 2032
- Figure 12: North America Magnetic Resonance Imaging Coil Volume (K), by Country 2024 & 2032
- Figure 13: North America Magnetic Resonance Imaging Coil Revenue Share (%), by Country 2024 & 2032
- Figure 14: North America Magnetic Resonance Imaging Coil Volume Share (%), by Country 2024 & 2032
- Figure 15: South America Magnetic Resonance Imaging Coil Revenue (million), by Application 2024 & 2032
- Figure 16: South America Magnetic Resonance Imaging Coil Volume (K), by Application 2024 & 2032
- Figure 17: South America Magnetic Resonance Imaging Coil Revenue Share (%), by Application 2024 & 2032
- Figure 18: South America Magnetic Resonance Imaging Coil Volume Share (%), by Application 2024 & 2032
- Figure 19: South America Magnetic Resonance Imaging Coil Revenue (million), by Types 2024 & 2032
- Figure 20: South America Magnetic Resonance Imaging Coil Volume (K), by Types 2024 & 2032
- Figure 21: South America Magnetic Resonance Imaging Coil Revenue Share (%), by Types 2024 & 2032
- Figure 22: South America Magnetic Resonance Imaging Coil Volume Share (%), by Types 2024 & 2032
- Figure 23: South America Magnetic Resonance Imaging Coil Revenue (million), by Country 2024 & 2032
- Figure 24: South America Magnetic Resonance Imaging Coil Volume (K), by Country 2024 & 2032
- Figure 25: South America Magnetic Resonance Imaging Coil Revenue Share (%), by Country 2024 & 2032
- Figure 26: South America Magnetic Resonance Imaging Coil Volume Share (%), by Country 2024 & 2032
- Figure 27: Europe Magnetic Resonance Imaging Coil Revenue (million), by Application 2024 & 2032
- Figure 28: Europe Magnetic Resonance Imaging Coil Volume (K), by Application 2024 & 2032
- Figure 29: Europe Magnetic Resonance Imaging Coil Revenue Share (%), by Application 2024 & 2032
- Figure 30: Europe Magnetic Resonance Imaging Coil Volume Share (%), by Application 2024 & 2032
- Figure 31: Europe Magnetic Resonance Imaging Coil Revenue (million), by Types 2024 & 2032
- Figure 32: Europe Magnetic Resonance Imaging Coil Volume (K), by Types 2024 & 2032
- Figure 33: Europe Magnetic Resonance Imaging Coil Revenue Share (%), by Types 2024 & 2032
- Figure 34: Europe Magnetic Resonance Imaging Coil Volume Share (%), by Types 2024 & 2032
- Figure 35: Europe Magnetic Resonance Imaging Coil Revenue (million), by Country 2024 & 2032
- Figure 36: Europe Magnetic Resonance Imaging Coil Volume (K), by Country 2024 & 2032
- Figure 37: Europe Magnetic Resonance Imaging Coil Revenue Share (%), by Country 2024 & 2032
- Figure 38: Europe Magnetic Resonance Imaging Coil Volume Share (%), by Country 2024 & 2032
- Figure 39: Middle East & Africa Magnetic Resonance Imaging Coil Revenue (million), by Application 2024 & 2032
- Figure 40: Middle East & Africa Magnetic Resonance Imaging Coil Volume (K), by Application 2024 & 2032
- Figure 41: Middle East & Africa Magnetic Resonance Imaging Coil Revenue Share (%), by Application 2024 & 2032
- Figure 42: Middle East & Africa Magnetic Resonance Imaging Coil Volume Share (%), by Application 2024 & 2032
- Figure 43: Middle East & Africa Magnetic Resonance Imaging Coil Revenue (million), by Types 2024 & 2032
- Figure 44: Middle East & Africa Magnetic Resonance Imaging Coil Volume (K), by Types 2024 & 2032
- Figure 45: Middle East & Africa Magnetic Resonance Imaging Coil Revenue Share (%), by Types 2024 & 2032
- Figure 46: Middle East & Africa Magnetic Resonance Imaging Coil Volume Share (%), by Types 2024 & 2032
- Figure 47: Middle East & Africa Magnetic Resonance Imaging Coil Revenue (million), by Country 2024 & 2032
- Figure 48: Middle East & Africa Magnetic Resonance Imaging Coil Volume (K), by Country 2024 & 2032
- Figure 49: Middle East & Africa Magnetic Resonance Imaging Coil Revenue Share (%), by Country 2024 & 2032
- Figure 50: Middle East & Africa Magnetic Resonance Imaging Coil Volume Share (%), by Country 2024 & 2032
- Figure 51: Asia Pacific Magnetic Resonance Imaging Coil Revenue (million), by Application 2024 & 2032
- Figure 52: Asia Pacific Magnetic Resonance Imaging Coil Volume (K), by Application 2024 & 2032
- Figure 53: Asia Pacific Magnetic Resonance Imaging Coil Revenue Share (%), by Application 2024 & 2032
- Figure 54: Asia Pacific Magnetic Resonance Imaging Coil Volume Share (%), by Application 2024 & 2032
- Figure 55: Asia Pacific Magnetic Resonance Imaging Coil Revenue (million), by Types 2024 & 2032
- Figure 56: Asia Pacific Magnetic Resonance Imaging Coil Volume (K), by Types 2024 & 2032
- Figure 57: Asia Pacific Magnetic Resonance Imaging Coil Revenue Share (%), by Types 2024 & 2032
- Figure 58: Asia Pacific Magnetic Resonance Imaging Coil Volume Share (%), by Types 2024 & 2032
- Figure 59: Asia Pacific Magnetic Resonance Imaging Coil Revenue (million), by Country 2024 & 2032
- Figure 60: Asia Pacific Magnetic Resonance Imaging Coil Volume (K), by Country 2024 & 2032
- Figure 61: Asia Pacific Magnetic Resonance Imaging Coil Revenue Share (%), by Country 2024 & 2032
- Figure 62: Asia Pacific Magnetic Resonance Imaging Coil Volume Share (%), by Country 2024 & 2032
List of Tables
- Table 1: Global Magnetic Resonance Imaging Coil Revenue million Forecast, by Region 2019 & 2032
- Table 2: Global Magnetic Resonance Imaging Coil Volume K Forecast, by Region 2019 & 2032
- Table 3: Global Magnetic Resonance Imaging Coil Revenue million Forecast, by Application 2019 & 2032
- Table 4: Global Magnetic Resonance Imaging Coil Volume K Forecast, by Application 2019 & 2032
- Table 5: Global Magnetic Resonance Imaging Coil Revenue million Forecast, by Types 2019 & 2032
- Table 6: Global Magnetic Resonance Imaging Coil Volume K Forecast, by Types 2019 & 2032
- Table 7: Global Magnetic Resonance Imaging Coil Revenue million Forecast, by Region 2019 & 2032
- Table 8: Global Magnetic Resonance Imaging Coil Volume K Forecast, by Region 2019 & 2032
- Table 9: Global Magnetic Resonance Imaging Coil Revenue million Forecast, by Application 2019 & 2032
- Table 10: Global Magnetic Resonance Imaging Coil Volume K Forecast, by Application 2019 & 2032
- Table 11: Global Magnetic Resonance Imaging Coil Revenue million Forecast, by Types 2019 & 2032
- Table 12: Global Magnetic Resonance Imaging Coil Volume K Forecast, by Types 2019 & 2032
- Table 13: Global Magnetic Resonance Imaging Coil Revenue million Forecast, by Country 2019 & 2032
- Table 14: Global Magnetic Resonance Imaging Coil Volume K Forecast, by Country 2019 & 2032
- Table 15: United States Magnetic Resonance Imaging Coil Revenue (million) Forecast, by Application 2019 & 2032
- Table 16: United States Magnetic Resonance Imaging Coil Volume (K) Forecast, by Application 2019 & 2032
- Table 17: Canada Magnetic Resonance Imaging Coil Revenue (million) Forecast, by Application 2019 & 2032
- Table 18: Canada Magnetic Resonance Imaging Coil Volume (K) Forecast, by Application 2019 & 2032
- Table 19: Mexico Magnetic Resonance Imaging Coil Revenue (million) Forecast, by Application 2019 & 2032
- Table 20: Mexico Magnetic Resonance Imaging Coil Volume (K) Forecast, by Application 2019 & 2032
- Table 21: Global Magnetic Resonance Imaging Coil Revenue million Forecast, by Application 2019 & 2032
- Table 22: Global Magnetic Resonance Imaging Coil Volume K Forecast, by Application 2019 & 2032
- Table 23: Global Magnetic Resonance Imaging Coil Revenue million Forecast, by Types 2019 & 2032
- Table 24: Global Magnetic Resonance Imaging Coil Volume K Forecast, by Types 2019 & 2032
- Table 25: Global Magnetic Resonance Imaging Coil Revenue million Forecast, by Country 2019 & 2032
- Table 26: Global Magnetic Resonance Imaging Coil Volume K Forecast, by Country 2019 & 2032
- Table 27: Brazil Magnetic Resonance Imaging Coil Revenue (million) Forecast, by Application 2019 & 2032
- Table 28: Brazil Magnetic Resonance Imaging Coil Volume (K) Forecast, by Application 2019 & 2032
- Table 29: Argentina Magnetic Resonance Imaging Coil Revenue (million) Forecast, by Application 2019 & 2032
- Table 30: Argentina Magnetic Resonance Imaging Coil Volume (K) Forecast, by Application 2019 & 2032
- Table 31: Rest of South America Magnetic Resonance Imaging Coil Revenue (million) Forecast, by Application 2019 & 2032
- Table 32: Rest of South America Magnetic Resonance Imaging Coil Volume (K) Forecast, by Application 2019 & 2032
- Table 33: Global Magnetic Resonance Imaging Coil Revenue million Forecast, by Application 2019 & 2032
- Table 34: Global Magnetic Resonance Imaging Coil Volume K Forecast, by Application 2019 & 2032
- Table 35: Global Magnetic Resonance Imaging Coil Revenue million Forecast, by Types 2019 & 2032
- Table 36: Global Magnetic Resonance Imaging Coil Volume K Forecast, by Types 2019 & 2032
- Table 37: Global Magnetic Resonance Imaging Coil Revenue million Forecast, by Country 2019 & 2032
- Table 38: Global Magnetic Resonance Imaging Coil Volume K Forecast, by Country 2019 & 2032
- Table 39: United Kingdom Magnetic Resonance Imaging Coil Revenue (million) Forecast, by Application 2019 & 2032
- Table 40: United Kingdom Magnetic Resonance Imaging Coil Volume (K) Forecast, by Application 2019 & 2032
- Table 41: Germany Magnetic Resonance Imaging Coil Revenue (million) Forecast, by Application 2019 & 2032
- Table 42: Germany Magnetic Resonance Imaging Coil Volume (K) Forecast, by Application 2019 & 2032
- Table 43: France Magnetic Resonance Imaging Coil Revenue (million) Forecast, by Application 2019 & 2032
- Table 44: France Magnetic Resonance Imaging Coil Volume (K) Forecast, by Application 2019 & 2032
- Table 45: Italy Magnetic Resonance Imaging Coil Revenue (million) Forecast, by Application 2019 & 2032
- Table 46: Italy Magnetic Resonance Imaging Coil Volume (K) Forecast, by Application 2019 & 2032
- Table 47: Spain Magnetic Resonance Imaging Coil Revenue (million) Forecast, by Application 2019 & 2032
- Table 48: Spain Magnetic Resonance Imaging Coil Volume (K) Forecast, by Application 2019 & 2032
- Table 49: Russia Magnetic Resonance Imaging Coil Revenue (million) Forecast, by Application 2019 & 2032
- Table 50: Russia Magnetic Resonance Imaging Coil Volume (K) Forecast, by Application 2019 & 2032
- Table 51: Benelux Magnetic Resonance Imaging Coil Revenue (million) Forecast, by Application 2019 & 2032
- Table 52: Benelux Magnetic Resonance Imaging Coil Volume (K) Forecast, by Application 2019 & 2032
- Table 53: Nordics Magnetic Resonance Imaging Coil Revenue (million) Forecast, by Application 2019 & 2032
- Table 54: Nordics Magnetic Resonance Imaging Coil Volume (K) Forecast, by Application 2019 & 2032
- Table 55: Rest of Europe Magnetic Resonance Imaging Coil Revenue (million) Forecast, by Application 2019 & 2032
- Table 56: Rest of Europe Magnetic Resonance Imaging Coil Volume (K) Forecast, by Application 2019 & 2032
- Table 57: Global Magnetic Resonance Imaging Coil Revenue million Forecast, by Application 2019 & 2032
- Table 58: Global Magnetic Resonance Imaging Coil Volume K Forecast, by Application 2019 & 2032
- Table 59: Global Magnetic Resonance Imaging Coil Revenue million Forecast, by Types 2019 & 2032
- Table 60: Global Magnetic Resonance Imaging Coil Volume K Forecast, by Types 2019 & 2032
- Table 61: Global Magnetic Resonance Imaging Coil Revenue million Forecast, by Country 2019 & 2032
- Table 62: Global Magnetic Resonance Imaging Coil Volume K Forecast, by Country 2019 & 2032
- Table 63: Turkey Magnetic Resonance Imaging Coil Revenue (million) Forecast, by Application 2019 & 2032
- Table 64: Turkey Magnetic Resonance Imaging Coil Volume (K) Forecast, by Application 2019 & 2032
- Table 65: Israel Magnetic Resonance Imaging Coil Revenue (million) Forecast, by Application 2019 & 2032
- Table 66: Israel Magnetic Resonance Imaging Coil Volume (K) Forecast, by Application 2019 & 2032
- Table 67: GCC Magnetic Resonance Imaging Coil Revenue (million) Forecast, by Application 2019 & 2032
- Table 68: GCC Magnetic Resonance Imaging Coil Volume (K) Forecast, by Application 2019 & 2032
- Table 69: North Africa Magnetic Resonance Imaging Coil Revenue (million) Forecast, by Application 2019 & 2032
- Table 70: North Africa Magnetic Resonance Imaging Coil Volume (K) Forecast, by Application 2019 & 2032
- Table 71: South Africa Magnetic Resonance Imaging Coil Revenue (million) Forecast, by Application 2019 & 2032
- Table 72: South Africa Magnetic Resonance Imaging Coil Volume (K) Forecast, by Application 2019 & 2032
- Table 73: Rest of Middle East & Africa Magnetic Resonance Imaging Coil Revenue (million) Forecast, by Application 2019 & 2032
- Table 74: Rest of Middle East & Africa Magnetic Resonance Imaging Coil Volume (K) Forecast, by Application 2019 & 2032
- Table 75: Global Magnetic Resonance Imaging Coil Revenue million Forecast, by Application 2019 & 2032
- Table 76: Global Magnetic Resonance Imaging Coil Volume K Forecast, by Application 2019 & 2032
- Table 77: Global Magnetic Resonance Imaging Coil Revenue million Forecast, by Types 2019 & 2032
- Table 78: Global Magnetic Resonance Imaging Coil Volume K Forecast, by Types 2019 & 2032
- Table 79: Global Magnetic Resonance Imaging Coil Revenue million Forecast, by Country 2019 & 2032
- Table 80: Global Magnetic Resonance Imaging Coil Volume K Forecast, by Country 2019 & 2032
- Table 81: China Magnetic Resonance Imaging Coil Revenue (million) Forecast, by Application 2019 & 2032
- Table 82: China Magnetic Resonance Imaging Coil Volume (K) Forecast, by Application 2019 & 2032
- Table 83: India Magnetic Resonance Imaging Coil Revenue (million) Forecast, by Application 2019 & 2032
- Table 84: India Magnetic Resonance Imaging Coil Volume (K) Forecast, by Application 2019 & 2032
- Table 85: Japan Magnetic Resonance Imaging Coil Revenue (million) Forecast, by Application 2019 & 2032
- Table 86: Japan Magnetic Resonance Imaging Coil Volume (K) Forecast, by Application 2019 & 2032
- Table 87: South Korea Magnetic Resonance Imaging Coil Revenue (million) Forecast, by Application 2019 & 2032
- Table 88: South Korea Magnetic Resonance Imaging Coil Volume (K) Forecast, by Application 2019 & 2032
- Table 89: ASEAN Magnetic Resonance Imaging Coil Revenue (million) Forecast, by Application 2019 & 2032
- Table 90: ASEAN Magnetic Resonance Imaging Coil Volume (K) Forecast, by Application 2019 & 2032
- Table 91: Oceania Magnetic Resonance Imaging Coil Revenue (million) Forecast, by Application 2019 & 2032
- Table 92: Oceania Magnetic Resonance Imaging Coil Volume (K) Forecast, by Application 2019 & 2032
- Table 93: Rest of Asia Pacific Magnetic Resonance Imaging Coil Revenue (million) Forecast, by Application 2019 & 2032
- Table 94: Rest of Asia Pacific Magnetic Resonance Imaging Coil Volume (K) Forecast, by Application 2019 & 2032
Frequently Asked Questions
1. What is the projected Compound Annual Growth Rate (CAGR) of the Magnetic Resonance Imaging Coil?
The projected CAGR is approximately 7.5%.
2. Which companies are prominent players in the Magnetic Resonance Imaging Coil?
Key companies in the market include ESAOTE SPA, GE Healthcare, Koninklijke Philips N.V., Siemens Healthcare Private Limited, MR Instruments, Inc., RAPID MR International, LLC, Aurora Imaging, HITACHI Medical Systems Europe, IMRIS, Medspira, Monteris Medical, Noras MRI.
3. What are the main segments of the Magnetic Resonance Imaging Coil?
The market segments include Application, Types.
4. Can you provide details about the market size?
The market size is estimated to be USD 8 million as of 2022.
5. What are some drivers contributing to market growth?
N/A
6. What are the notable trends driving market growth?
N/A
7. Are there any restraints impacting market growth?
N/A
8. Can you provide examples of recent developments in the market?
N/A
9. What pricing options are available for accessing the report?
Pricing options include single-user, multi-user, and enterprise licenses priced at USD 3350.00, USD 5025.00, and USD 6700.00 respectively.
10. Is the market size provided in terms of value or volume?
The market size is provided in terms of value, measured in million and volume, measured in K.
11. Are there any specific market keywords associated with the report?
Yes, the market keyword associated with the report is "Magnetic Resonance Imaging Coil," which aids in identifying and referencing the specific market segment covered.
12. How do I determine which pricing option suits my needs best?
The pricing options vary based on user requirements and access needs. Individual users may opt for single-user licenses, while businesses requiring broader access may choose multi-user or enterprise licenses for cost-effective access to the report.
13. Are there any additional resources or data provided in the Magnetic Resonance Imaging Coil report?
While the report offers comprehensive insights, it's advisable to review the specific contents or supplementary materials provided to ascertain if additional resources or data are available.
14. How can I stay updated on further developments or reports in the Magnetic Resonance Imaging Coil?
To stay informed about further developments, trends, and reports in the Magnetic Resonance Imaging Coil, consider subscribing to industry newsletters, following relevant companies and organizations, or regularly checking reputable industry news sources and publications.
Methodology
Step 1 - Identification of Relevant Samples Size from Population Database


Step 2 - Approaches for Defining Global Market Size (Value, Volume* & Price*)

Note*: In applicable scenarios
Step 3 - Data Sources
Primary Research
- Web Analytics
- Survey Reports
- Research Institute
- Latest Research Reports
- Opinion Leaders
Secondary Research
- Annual Reports
- White Paper
- Latest Press Release
- Industry Association
- Paid Database
- Investor Presentations

Step 4 - Data Triangulation
Involves using different sources of information in order to increase the validity of a study
These sources are likely to be stakeholders in a program - participants, other researchers, program staff, other community members, and so on.
Then we put all data in single framework & apply various statistical tools to find out the dynamic on the market.
During the analysis stage, feedback from the stakeholder groups would be compared to determine areas of agreement as well as areas of divergence
