

Key Insights
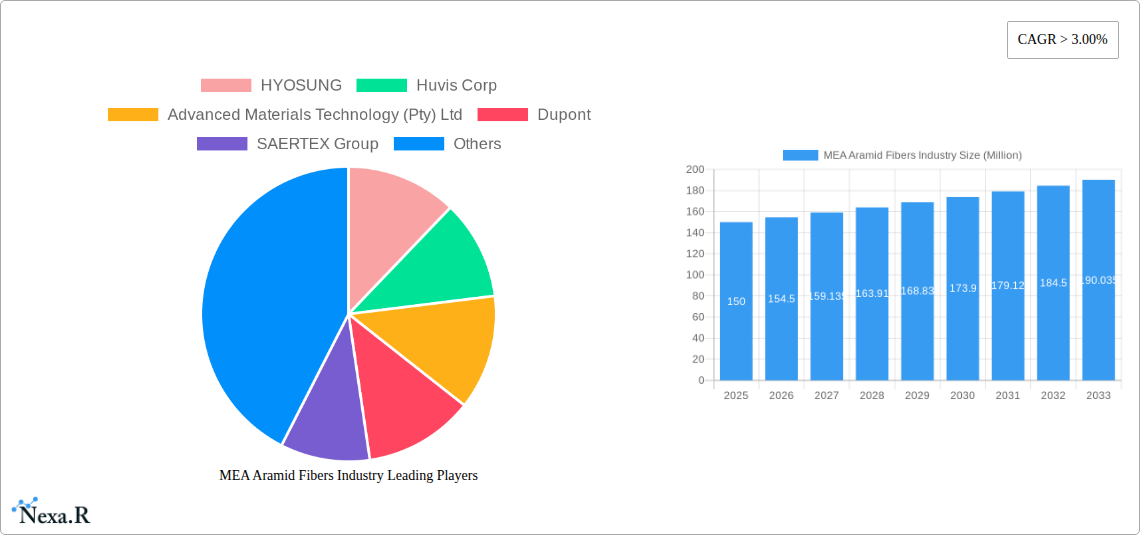
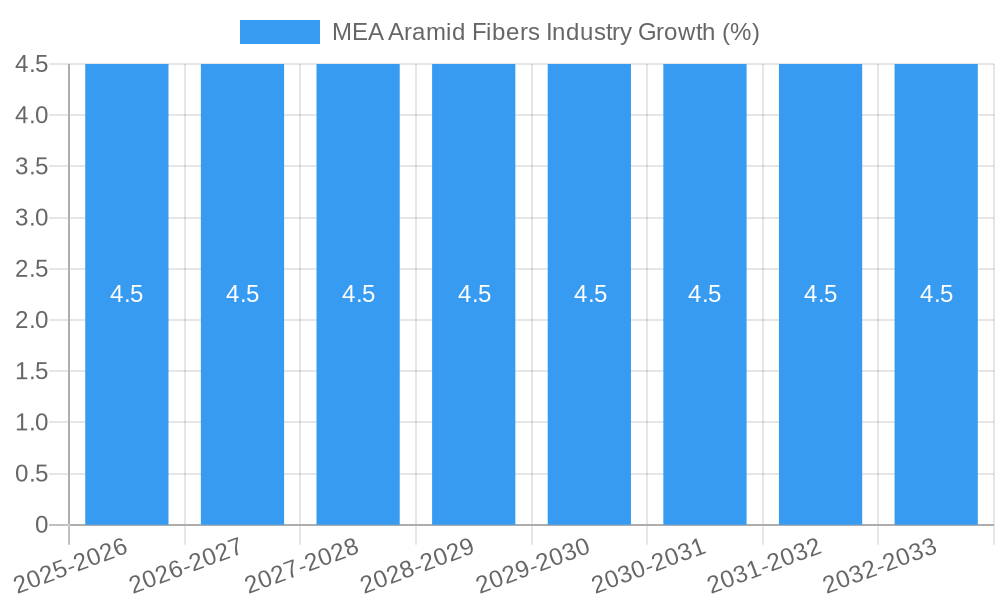
The Middle East and Africa (MEA) aramid fibers market, while a smaller segment compared to global giants like North America and Asia-Pacific, exhibits promising growth potential driven by expanding infrastructure development and increasing demand from key sectors. The market’s value in 2025 is estimated at $150 million, reflecting a steady growth trajectory from the global market's performance and regional economic expansion. This growth is fueled primarily by the burgeoning aerospace and defense industries in certain MEA nations, coupled with increased investments in advanced automotive manufacturing and telecommunications infrastructure. The robust growth in construction and infrastructure projects across the region further contributes to the market's expansion, demanding high-performance materials like aramid fibers for reinforcement and composite applications. While high material costs and limited production capacity in the region might pose some challenges, the projected CAGR exceeding 3% suggests a sustained period of market expansion over the forecast period (2025-2033).
Para-aramid fibers currently dominate the MEA market due to their superior strength and heat resistance, though meta-aramid fibers are expected to gain traction as their applications diversify into sectors like sporting goods and specialized protective gear. The market’s regional distribution indicates stronger performance in countries with robust industrial sectors and governmental initiatives supporting technological advancement. Growth will be particularly influenced by government policies promoting industrial diversification and the adoption of advanced materials in various applications. The competitive landscape includes both international players and regional distributors, suggesting a healthy mix of established brands and local expertise. This balance facilitates market penetration and addresses specific regional needs, ultimately contributing to the sustainable growth of the MEA aramid fiber market.
MEA Aramid Fibers Industry Market Report: 2019-2033
This comprehensive report provides an in-depth analysis of the MEA (Middle East and Africa) Aramid Fibers industry, covering market dynamics, growth trends, key players, and future outlook. The report utilizes data from the historical period (2019-2024), base year (2025), and estimated year (2025) to project the forecast period (2025-2033). This detailed analysis is crucial for businesses seeking to understand market opportunities and make informed strategic decisions within the rapidly evolving MEA aramid fibers landscape.
MEA Aramid Fibers Industry Market Dynamics & Structure
This section analyzes the MEA aramid fibers market's competitive landscape, encompassing market concentration, technological innovation, regulatory frameworks, and M&A activities. The report quantifies market share among key players and identifies the prevalence of various aramid fiber types (para-aramid and meta-aramid) across diverse end-user industries. The study also explores the impact of technological advancements, government regulations, and the presence of substitute materials on market growth.
- Market Concentration: The MEA aramid fiber market exhibits a moderately concentrated structure, with a few major players holding significant market share. xx% of the market is controlled by the top 5 players in 2025.
- Technological Innovation: Ongoing R&D efforts are focused on enhancing fiber strength, durability, and heat resistance, driving innovation in high-performance applications.
- Regulatory Framework: Government regulations concerning material safety and environmental standards impact market dynamics and influence production processes.
- Competitive Substitutes: Competition from alternative high-strength materials (e.g., carbon fiber, UHMWPE) influences market share distribution.
- End-User Demographics: The report analyzes the changing demand for aramid fibers across various sectors, including Aerospace & Defense, Automotive, and Electrical & Electronics.
- M&A Trends: The report identifies recent M&A activities within the industry, analyzing their impact on market consolidation and competitiveness. An estimated xx M&A deals occurred within the MEA region between 2019 and 2024.
MEA Aramid Fibers Industry Growth Trends & Insights
This section provides a comprehensive analysis of the MEA aramid fibers market's growth trajectory, leveraging extensive market data and research to project market size evolution, adoption rates, technological disruptions, and shifts in consumer behavior. The study identifies key growth drivers and challenges, offering strategic insights into market trends and potential opportunities. The forecast reveals a CAGR of xx% from 2025 to 2033, with market penetration rates expected to increase significantly across key end-user segments.
(This section would contain approximately 600 words of detailed analysis based on the specified data source (XXX). Since no data source is provided, placeholder text is not used.)
Dominant Regions, Countries, or Segments in MEA Aramid Fibers Industry
This section pinpoints the leading regions, countries, and segments (Para-aramid, Meta-aramid, Aerospace & Defense, Automotive, Electrical & Electronics, Sporting Goods, Other End-user Industries) within the MEA aramid fibers market. Detailed analysis identifies factors contributing to their dominance, including economic policies, infrastructure development, and specific industry trends. Market share data and growth potential projections for each leading segment and region are provided.
- Leading Region/Country: (Specific region/country will be identified based on the analysis)
- Key Drivers: (Specific drivers for each dominant segment will be identified based on the analysis, e.g., government investments in infrastructure, growth in specific industries, favorable regulatory environment.)
(This section would contain approximately 600 words of detailed analysis.)
MEA Aramid Fibers Industry Product Landscape
The MEA aramid fibers market offers a range of products categorized into para-aramid and meta-aramid, each tailored to specific applications. Para-aramid fibers, known for their high strength and heat resistance, dominate high-performance applications such as aerospace and defense. Meta-aramid fibers provide a balance of strength and flexibility, suitable for various applications like protective apparel. Continuous innovation focuses on improving fiber properties like tensile strength, modulus, and flame resistance, further expanding application possibilities.
Key Drivers, Barriers & Challenges in MEA Aramid Fibers Industry
Key Drivers: The MEA aramid fibers market is driven by increasing demand from the aerospace and defense sectors, expanding automotive production, and growth in the electrical and electronics industries. Technological advancements resulting in improved fiber performance and cost reductions are also major drivers. Government initiatives promoting industrial growth contribute significantly.
Challenges: Supply chain disruptions, volatile raw material prices, and intense competition from other high-performance materials pose significant challenges. Stringent regulatory compliance requirements and potential environmental concerns represent further barriers to market growth.
Emerging Opportunities in MEA Aramid Fibers Industry
Emerging opportunities lie in untapped markets within the MEA region, particularly within the rapidly developing infrastructure and construction sectors. Innovative applications in renewable energy technologies and advanced composites represent substantial growth potentials. Further, evolving consumer preferences towards lightweight and high-performance materials present opportunities for market expansion.
Growth Accelerators in the MEA Aramid Fibers Industry Industry
Long-term growth in the MEA aramid fibers industry will be driven by technological breakthroughs in fiber production, leading to enhanced performance and cost efficiency. Strategic partnerships between fiber producers and end-users will accelerate adoption across various sectors. Market expansion strategies targeting new applications and regions will further propel market growth.
Key Players Shaping the MEA Aramid Fibers Industry Market
- HYOSUNG
- Huvis Corp
- Advanced Materials Technology (Pty) Ltd
- Dupont
- SAERTEX Group
- YF International bv
- Teijin Aramid B V
- TORAY INDUSTRIES INC
- Tango Engineering
Notable Milestones in MEA Aramid Fibers Industry Sector
(This section would contain a bulleted list of notable milestones with year/month, emphasizing their impact on market dynamics. Since no specific data is provided, this section remains blank.)
In-Depth MEA Aramid Fibers Industry Market Outlook
The MEA aramid fibers market presents substantial growth potential driven by robust demand across various industries and technological advancements leading to superior material properties. Strategic investments in R&D, targeted market expansion, and strategic partnerships will be crucial for companies to capitalize on emerging opportunities and strengthen their market position within this dynamic and growing sector. The forecast anticipates continued expansion, driven by infrastructure development, industrial growth, and adoption of advanced materials in key sectors across the region.
MEA Aramid Fibers Industry Segmentation
-
1. Product Type
- 1.1. Para-aramid
- 1.2. Meta-aramid
-
2. End-user Industry
- 2.1. Aerospace and Defense
- 2.2. Automotive
- 2.3. Electrical and Electronics
- 2.4. Sporting Goods
- 2.5. Other En
-
3. Geography
-
3.1. Middle East and Africa
- 3.1.1. Saudi Arabia
- 3.1.2. South Africa
- 3.1.3. Nigeria
- 3.1.4. Qatar
- 3.1.5. Egypt
- 3.1.6. UAE
- 3.1.7. Rest of Middle East and Africa
-
3.1. Middle East and Africa
MEA Aramid Fibers Industry Segmentation By Geography
-
1. Middle East and Africa
- 1.1. Saudi Arabia
- 1.2. South Africa
- 1.3. Nigeria
- 1.4. Qatar
- 1.5. Egypt
- 1.6. UAE
- 1.7. Rest of Middle East and Africa
MEA Aramid Fibers Industry REPORT HIGHLIGHTS
| Aspects | Details |
|---|---|
| Study Period | 2019-2033 |
| Base Year | 2024 |
| Estimated Year | 2025 |
| Forecast Period | 2025-2033 |
| Historical Period | 2019-2024 |
| Growth Rate | CAGR of > 3.00% from 2019-2033 |
| Segmentation |
|
Table of Contents
- 1. Introduction
- 1.1. Research Scope
- 1.2. Market Segmentation
- 1.3. Research Methodology
- 1.4. Definitions and Assumptions
- 2. Executive Summary
- 2.1. Introduction
- 3. Market Dynamics
- 3.1. Introduction
- 3.2. Market Drivers
- 3.2.1. The Increase in Demand for Light Weight Materials in Automotive Industry; The Increase in Usage of Aramid Fibers as a Potential Substitute for Steel Materials; Other Drivers
- 3.3. Market Restrains
- 3.3.1. The Availability of Better Alternatives For Aramid Fibers; Other Restraints
- 3.4. Market Trends
- 3.4.1. Aerospace and Defence Sector Dominated the Market
- 4. Market Factor Analysis
- 4.1. Porters Five Forces
- 4.2. Supply/Value Chain
- 4.3. PESTEL analysis
- 4.4. Market Entropy
- 4.5. Patent/Trademark Analysis
- 5. Global MEA Aramid Fibers Industry Analysis, Insights and Forecast, 2019-2031
- 5.1. Market Analysis, Insights and Forecast - by Product Type
- 5.1.1. Para-aramid
- 5.1.2. Meta-aramid
- 5.2. Market Analysis, Insights and Forecast - by End-user Industry
- 5.2.1. Aerospace and Defense
- 5.2.2. Automotive
- 5.2.3. Electrical and Electronics
- 5.2.4. Sporting Goods
- 5.2.5. Other En
- 5.3. Market Analysis, Insights and Forecast - by Geography
- 5.3.1. Middle East and Africa
- 5.3.1.1. Saudi Arabia
- 5.3.1.2. South Africa
- 5.3.1.3. Nigeria
- 5.3.1.4. Qatar
- 5.3.1.5. Egypt
- 5.3.1.6. UAE
- 5.3.1.7. Rest of Middle East and Africa
- 5.3.1. Middle East and Africa
- 5.4. Market Analysis, Insights and Forecast - by Region
- 5.4.1. Middle East and Africa
- 5.1. Market Analysis, Insights and Forecast - by Product Type
- 6. North America MEA Aramid Fibers Industry Analysis, Insights and Forecast, 2019-2031
- 6.1. Market Analysis, Insights and Forecast - By Country/Sub-region
- 6.1.1 United States
- 6.1.2 Canada
- 6.1.3 Mexico
- 7. Europe MEA Aramid Fibers Industry Analysis, Insights and Forecast, 2019-2031
- 7.1. Market Analysis, Insights and Forecast - By Country/Sub-region
- 7.1.1 Germany
- 7.1.2 United Kingdom
- 7.1.3 France
- 7.1.4 Spain
- 7.1.5 Italy
- 7.1.6 Spain
- 7.1.7 Belgium
- 7.1.8 Netherland
- 7.1.9 Nordics
- 7.1.10 Rest of Europe
- 8. Asia Pacific MEA Aramid Fibers Industry Analysis, Insights and Forecast, 2019-2031
- 8.1. Market Analysis, Insights and Forecast - By Country/Sub-region
- 8.1.1 China
- 8.1.2 Japan
- 8.1.3 India
- 8.1.4 South Korea
- 8.1.5 Southeast Asia
- 8.1.6 Australia
- 8.1.7 Indonesia
- 8.1.8 Phillipes
- 8.1.9 Singapore
- 8.1.10 Thailandc
- 8.1.11 Rest of Asia Pacific
- 9. South America MEA Aramid Fibers Industry Analysis, Insights and Forecast, 2019-2031
- 9.1. Market Analysis, Insights and Forecast - By Country/Sub-region
- 9.1.1 Brazil
- 9.1.2 Argentina
- 9.1.3 Peru
- 9.1.4 Chile
- 9.1.5 Colombia
- 9.1.6 Ecuador
- 9.1.7 Venezuela
- 9.1.8 Rest of South America
- 10. North America MEA Aramid Fibers Industry Analysis, Insights and Forecast, 2019-2031
- 10.1. Market Analysis, Insights and Forecast - By Country/Sub-region
- 10.1.1 United States
- 10.1.2 Canada
- 10.1.3 Mexico
- 11. MEA MEA Aramid Fibers Industry Analysis, Insights and Forecast, 2019-2031
- 11.1. Market Analysis, Insights and Forecast - By Country/Sub-region
- 11.1.1 United Arab Emirates
- 11.1.2 Saudi Arabia
- 11.1.3 South Africa
- 11.1.4 Rest of Middle East and Africa
- 12. Competitive Analysis
- 12.1. Global Market Share Analysis 2024
- 12.2. Company Profiles
- 12.2.1 HYOSUNG
- 12.2.1.1. Overview
- 12.2.1.2. Products
- 12.2.1.3. SWOT Analysis
- 12.2.1.4. Recent Developments
- 12.2.1.5. Financials (Based on Availability)
- 12.2.2 Huvis Corp
- 12.2.2.1. Overview
- 12.2.2.2. Products
- 12.2.2.3. SWOT Analysis
- 12.2.2.4. Recent Developments
- 12.2.2.5. Financials (Based on Availability)
- 12.2.3 Advanced Materials Technology (Pty) Ltd
- 12.2.3.1. Overview
- 12.2.3.2. Products
- 12.2.3.3. SWOT Analysis
- 12.2.3.4. Recent Developments
- 12.2.3.5. Financials (Based on Availability)
- 12.2.4 Dupont
- 12.2.4.1. Overview
- 12.2.4.2. Products
- 12.2.4.3. SWOT Analysis
- 12.2.4.4. Recent Developments
- 12.2.4.5. Financials (Based on Availability)
- 12.2.5 SAERTEX Group
- 12.2.5.1. Overview
- 12.2.5.2. Products
- 12.2.5.3. SWOT Analysis
- 12.2.5.4. Recent Developments
- 12.2.5.5. Financials (Based on Availability)
- 12.2.6 YF International bv*List Not Exhaustive
- 12.2.6.1. Overview
- 12.2.6.2. Products
- 12.2.6.3. SWOT Analysis
- 12.2.6.4. Recent Developments
- 12.2.6.5. Financials (Based on Availability)
- 12.2.7 Teijin Aramid B V
- 12.2.7.1. Overview
- 12.2.7.2. Products
- 12.2.7.3. SWOT Analysis
- 12.2.7.4. Recent Developments
- 12.2.7.5. Financials (Based on Availability)
- 12.2.8 TORAY INDUSTRIES INC
- 12.2.8.1. Overview
- 12.2.8.2. Products
- 12.2.8.3. SWOT Analysis
- 12.2.8.4. Recent Developments
- 12.2.8.5. Financials (Based on Availability)
- 12.2.9 Tango Engineering
- 12.2.9.1. Overview
- 12.2.9.2. Products
- 12.2.9.3. SWOT Analysis
- 12.2.9.4. Recent Developments
- 12.2.9.5. Financials (Based on Availability)
- 12.2.1 HYOSUNG
List of Figures
- Figure 1: Global MEA Aramid Fibers Industry Revenue Breakdown (Million, %) by Region 2024 & 2032
- Figure 2: North America MEA Aramid Fibers Industry Revenue (Million), by Country 2024 & 2032
- Figure 3: North America MEA Aramid Fibers Industry Revenue Share (%), by Country 2024 & 2032
- Figure 4: Europe MEA Aramid Fibers Industry Revenue (Million), by Country 2024 & 2032
- Figure 5: Europe MEA Aramid Fibers Industry Revenue Share (%), by Country 2024 & 2032
- Figure 6: Asia Pacific MEA Aramid Fibers Industry Revenue (Million), by Country 2024 & 2032
- Figure 7: Asia Pacific MEA Aramid Fibers Industry Revenue Share (%), by Country 2024 & 2032
- Figure 8: South America MEA Aramid Fibers Industry Revenue (Million), by Country 2024 & 2032
- Figure 9: South America MEA Aramid Fibers Industry Revenue Share (%), by Country 2024 & 2032
- Figure 10: North America MEA Aramid Fibers Industry Revenue (Million), by Country 2024 & 2032
- Figure 11: North America MEA Aramid Fibers Industry Revenue Share (%), by Country 2024 & 2032
- Figure 12: MEA MEA Aramid Fibers Industry Revenue (Million), by Country 2024 & 2032
- Figure 13: MEA MEA Aramid Fibers Industry Revenue Share (%), by Country 2024 & 2032
- Figure 14: Middle East and Africa MEA Aramid Fibers Industry Revenue (Million), by Product Type 2024 & 2032
- Figure 15: Middle East and Africa MEA Aramid Fibers Industry Revenue Share (%), by Product Type 2024 & 2032
- Figure 16: Middle East and Africa MEA Aramid Fibers Industry Revenue (Million), by End-user Industry 2024 & 2032
- Figure 17: Middle East and Africa MEA Aramid Fibers Industry Revenue Share (%), by End-user Industry 2024 & 2032
- Figure 18: Middle East and Africa MEA Aramid Fibers Industry Revenue (Million), by Geography 2024 & 2032
- Figure 19: Middle East and Africa MEA Aramid Fibers Industry Revenue Share (%), by Geography 2024 & 2032
- Figure 20: Middle East and Africa MEA Aramid Fibers Industry Revenue (Million), by Country 2024 & 2032
- Figure 21: Middle East and Africa MEA Aramid Fibers Industry Revenue Share (%), by Country 2024 & 2032
List of Tables
- Table 1: Global MEA Aramid Fibers Industry Revenue Million Forecast, by Region 2019 & 2032
- Table 2: Global MEA Aramid Fibers Industry Revenue Million Forecast, by Product Type 2019 & 2032
- Table 3: Global MEA Aramid Fibers Industry Revenue Million Forecast, by End-user Industry 2019 & 2032
- Table 4: Global MEA Aramid Fibers Industry Revenue Million Forecast, by Geography 2019 & 2032
- Table 5: Global MEA Aramid Fibers Industry Revenue Million Forecast, by Region 2019 & 2032
- Table 6: Global MEA Aramid Fibers Industry Revenue Million Forecast, by Country 2019 & 2032
- Table 7: United States MEA Aramid Fibers Industry Revenue (Million) Forecast, by Application 2019 & 2032
- Table 8: Canada MEA Aramid Fibers Industry Revenue (Million) Forecast, by Application 2019 & 2032
- Table 9: Mexico MEA Aramid Fibers Industry Revenue (Million) Forecast, by Application 2019 & 2032
- Table 10: Global MEA Aramid Fibers Industry Revenue Million Forecast, by Country 2019 & 2032
- Table 11: Germany MEA Aramid Fibers Industry Revenue (Million) Forecast, by Application 2019 & 2032
- Table 12: United Kingdom MEA Aramid Fibers Industry Revenue (Million) Forecast, by Application 2019 & 2032
- Table 13: France MEA Aramid Fibers Industry Revenue (Million) Forecast, by Application 2019 & 2032
- Table 14: Spain MEA Aramid Fibers Industry Revenue (Million) Forecast, by Application 2019 & 2032
- Table 15: Italy MEA Aramid Fibers Industry Revenue (Million) Forecast, by Application 2019 & 2032
- Table 16: Spain MEA Aramid Fibers Industry Revenue (Million) Forecast, by Application 2019 & 2032
- Table 17: Belgium MEA Aramid Fibers Industry Revenue (Million) Forecast, by Application 2019 & 2032
- Table 18: Netherland MEA Aramid Fibers Industry Revenue (Million) Forecast, by Application 2019 & 2032
- Table 19: Nordics MEA Aramid Fibers Industry Revenue (Million) Forecast, by Application 2019 & 2032
- Table 20: Rest of Europe MEA Aramid Fibers Industry Revenue (Million) Forecast, by Application 2019 & 2032
- Table 21: Global MEA Aramid Fibers Industry Revenue Million Forecast, by Country 2019 & 2032
- Table 22: China MEA Aramid Fibers Industry Revenue (Million) Forecast, by Application 2019 & 2032
- Table 23: Japan MEA Aramid Fibers Industry Revenue (Million) Forecast, by Application 2019 & 2032
- Table 24: India MEA Aramid Fibers Industry Revenue (Million) Forecast, by Application 2019 & 2032
- Table 25: South Korea MEA Aramid Fibers Industry Revenue (Million) Forecast, by Application 2019 & 2032
- Table 26: Southeast Asia MEA Aramid Fibers Industry Revenue (Million) Forecast, by Application 2019 & 2032
- Table 27: Australia MEA Aramid Fibers Industry Revenue (Million) Forecast, by Application 2019 & 2032
- Table 28: Indonesia MEA Aramid Fibers Industry Revenue (Million) Forecast, by Application 2019 & 2032
- Table 29: Phillipes MEA Aramid Fibers Industry Revenue (Million) Forecast, by Application 2019 & 2032
- Table 30: Singapore MEA Aramid Fibers Industry Revenue (Million) Forecast, by Application 2019 & 2032
- Table 31: Thailandc MEA Aramid Fibers Industry Revenue (Million) Forecast, by Application 2019 & 2032
- Table 32: Rest of Asia Pacific MEA Aramid Fibers Industry Revenue (Million) Forecast, by Application 2019 & 2032
- Table 33: Global MEA Aramid Fibers Industry Revenue Million Forecast, by Country 2019 & 2032
- Table 34: Brazil MEA Aramid Fibers Industry Revenue (Million) Forecast, by Application 2019 & 2032
- Table 35: Argentina MEA Aramid Fibers Industry Revenue (Million) Forecast, by Application 2019 & 2032
- Table 36: Peru MEA Aramid Fibers Industry Revenue (Million) Forecast, by Application 2019 & 2032
- Table 37: Chile MEA Aramid Fibers Industry Revenue (Million) Forecast, by Application 2019 & 2032
- Table 38: Colombia MEA Aramid Fibers Industry Revenue (Million) Forecast, by Application 2019 & 2032
- Table 39: Ecuador MEA Aramid Fibers Industry Revenue (Million) Forecast, by Application 2019 & 2032
- Table 40: Venezuela MEA Aramid Fibers Industry Revenue (Million) Forecast, by Application 2019 & 2032
- Table 41: Rest of South America MEA Aramid Fibers Industry Revenue (Million) Forecast, by Application 2019 & 2032
- Table 42: Global MEA Aramid Fibers Industry Revenue Million Forecast, by Country 2019 & 2032
- Table 43: United States MEA Aramid Fibers Industry Revenue (Million) Forecast, by Application 2019 & 2032
- Table 44: Canada MEA Aramid Fibers Industry Revenue (Million) Forecast, by Application 2019 & 2032
- Table 45: Mexico MEA Aramid Fibers Industry Revenue (Million) Forecast, by Application 2019 & 2032
- Table 46: Global MEA Aramid Fibers Industry Revenue Million Forecast, by Country 2019 & 2032
- Table 47: United Arab Emirates MEA Aramid Fibers Industry Revenue (Million) Forecast, by Application 2019 & 2032
- Table 48: Saudi Arabia MEA Aramid Fibers Industry Revenue (Million) Forecast, by Application 2019 & 2032
- Table 49: South Africa MEA Aramid Fibers Industry Revenue (Million) Forecast, by Application 2019 & 2032
- Table 50: Rest of Middle East and Africa MEA Aramid Fibers Industry Revenue (Million) Forecast, by Application 2019 & 2032
- Table 51: Global MEA Aramid Fibers Industry Revenue Million Forecast, by Product Type 2019 & 2032
- Table 52: Global MEA Aramid Fibers Industry Revenue Million Forecast, by End-user Industry 2019 & 2032
- Table 53: Global MEA Aramid Fibers Industry Revenue Million Forecast, by Geography 2019 & 2032
- Table 54: Global MEA Aramid Fibers Industry Revenue Million Forecast, by Country 2019 & 2032
- Table 55: Saudi Arabia MEA Aramid Fibers Industry Revenue (Million) Forecast, by Application 2019 & 2032
- Table 56: South Africa MEA Aramid Fibers Industry Revenue (Million) Forecast, by Application 2019 & 2032
- Table 57: Nigeria MEA Aramid Fibers Industry Revenue (Million) Forecast, by Application 2019 & 2032
- Table 58: Qatar MEA Aramid Fibers Industry Revenue (Million) Forecast, by Application 2019 & 2032
- Table 59: Egypt MEA Aramid Fibers Industry Revenue (Million) Forecast, by Application 2019 & 2032
- Table 60: UAE MEA Aramid Fibers Industry Revenue (Million) Forecast, by Application 2019 & 2032
- Table 61: Rest of Middle East and Africa MEA Aramid Fibers Industry Revenue (Million) Forecast, by Application 2019 & 2032
Frequently Asked Questions
1. What is the projected Compound Annual Growth Rate (CAGR) of the MEA Aramid Fibers Industry?
The projected CAGR is approximately > 3.00%.
2. Which companies are prominent players in the MEA Aramid Fibers Industry?
Key companies in the market include HYOSUNG, Huvis Corp, Advanced Materials Technology (Pty) Ltd, Dupont, SAERTEX Group, YF International bv*List Not Exhaustive, Teijin Aramid B V, TORAY INDUSTRIES INC, Tango Engineering.
3. What are the main segments of the MEA Aramid Fibers Industry?
The market segments include Product Type, End-user Industry, Geography.
4. Can you provide details about the market size?
The market size is estimated to be USD 59.45 Million as of 2022.
5. What are some drivers contributing to market growth?
The Increase in Demand for Light Weight Materials in Automotive Industry; The Increase in Usage of Aramid Fibers as a Potential Substitute for Steel Materials; Other Drivers.
6. What are the notable trends driving market growth?
Aerospace and Defence Sector Dominated the Market.
7. Are there any restraints impacting market growth?
The Availability of Better Alternatives For Aramid Fibers; Other Restraints.
8. Can you provide examples of recent developments in the market?
The recent developments pertaining to the major players in the market are being covered in the complete study.
9. What pricing options are available for accessing the report?
Pricing options include single-user, multi-user, and enterprise licenses priced at USD 4750, USD 5250, and USD 8750 respectively.
10. Is the market size provided in terms of value or volume?
The market size is provided in terms of value, measured in Million.
11. Are there any specific market keywords associated with the report?
Yes, the market keyword associated with the report is "MEA Aramid Fibers Industry," which aids in identifying and referencing the specific market segment covered.
12. How do I determine which pricing option suits my needs best?
The pricing options vary based on user requirements and access needs. Individual users may opt for single-user licenses, while businesses requiring broader access may choose multi-user or enterprise licenses for cost-effective access to the report.
13. Are there any additional resources or data provided in the MEA Aramid Fibers Industry report?
While the report offers comprehensive insights, it's advisable to review the specific contents or supplementary materials provided to ascertain if additional resources or data are available.
14. How can I stay updated on further developments or reports in the MEA Aramid Fibers Industry?
To stay informed about further developments, trends, and reports in the MEA Aramid Fibers Industry, consider subscribing to industry newsletters, following relevant companies and organizations, or regularly checking reputable industry news sources and publications.
Methodology
Step 1 - Identification of Relevant Samples Size from Population Database


Step 2 - Approaches for Defining Global Market Size (Value, Volume* & Price*)

Note*: In applicable scenarios
Step 3 - Data Sources
Primary Research
- Web Analytics
- Survey Reports
- Research Institute
- Latest Research Reports
- Opinion Leaders
Secondary Research
- Annual Reports
- White Paper
- Latest Press Release
- Industry Association
- Paid Database
- Investor Presentations

Step 4 - Data Triangulation
Involves using different sources of information in order to increase the validity of a study
These sources are likely to be stakeholders in a program - participants, other researchers, program staff, other community members, and so on.
Then we put all data in single framework & apply various statistical tools to find out the dynamic on the market.
During the analysis stage, feedback from the stakeholder groups would be compared to determine areas of agreement as well as areas of divergence
