

Key Insights
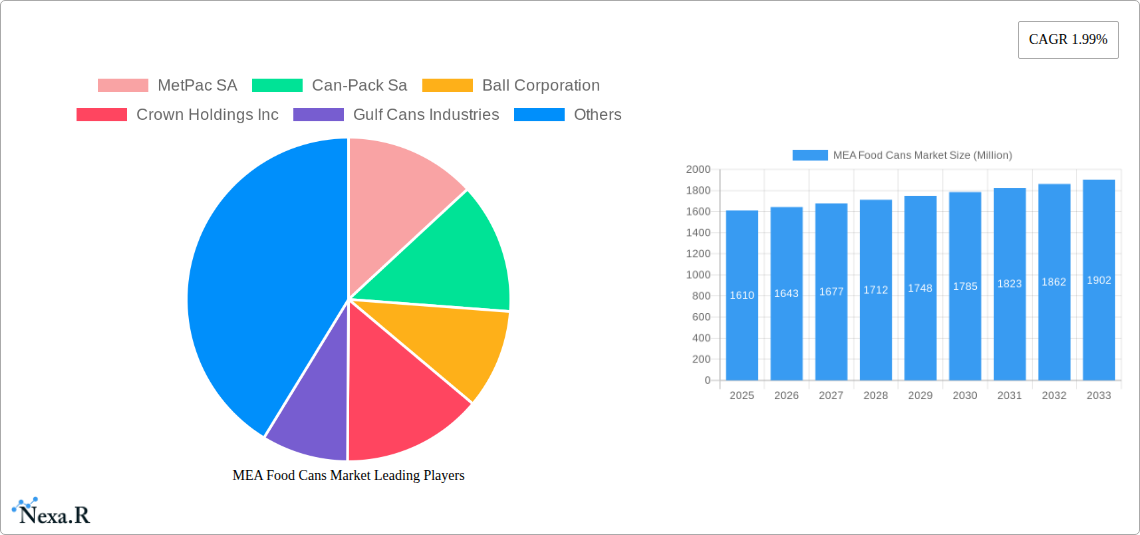
The Middle East and Africa (MEA) food cans market, valued at $1.61 billion in 2025, is projected to experience steady growth, driven by several key factors. The rising demand for convenient and shelf-stable food products, particularly ready meals and processed foods, fuels the increasing adoption of food cans across the region. This trend is further amplified by the growing urbanization and changing lifestyles in MEA countries, leading to increased consumption of packaged foods. The robust growth of the food processing and pet food industries also contributes significantly to market expansion. Furthermore, advancements in can manufacturing technologies, resulting in improved durability and aesthetic appeal, are enhancing consumer preference for canned goods. While challenges such as fluctuating raw material prices and environmental concerns related to aluminum and steel waste exist, the overall positive growth outlook remains strong. Segmentation reveals a significant market share held by aluminum cans due to their lightweight nature and recyclability. Saudi Arabia and the UAE represent key national markets, reflecting the higher per capita consumption and robust food processing infrastructure within these countries. The projected Compound Annual Growth Rate (CAGR) of 1.99% indicates a consistent, albeit moderate, expansion of the market over the forecast period (2025-2033). This growth is anticipated to be propelled by continued economic development and evolving consumer preferences within the MEA region.
The competitive landscape is characterized by a mix of both international players like Ball Corporation and Crown Holdings Inc., and regional can manufacturers such as Gulf Cans Industries and Emirates Metallic Industries Company Limited (EMIC). This competition fosters innovation and price competitiveness, benefiting consumers. However, regional players might face challenges competing with larger multinational corporations on aspects like technological advancements and economies of scale. Future market growth will likely be influenced by factors like government regulations related to food safety and sustainability, along with the increasing adoption of sustainable packaging solutions. The market is expected to witness increased focus on eco-friendly materials and manufacturing processes to address environmental concerns, further shaping its trajectory in the coming years.
MEA Food Cans Market: A Comprehensive Report (2019-2033)
This in-depth report provides a comprehensive analysis of the Middle East and Africa (MEA) food cans market, covering market dynamics, growth trends, regional performance, and key players. The report segments the market by application (Ready Meals, Powder Products, Fish and Seafood, Fruits and Vegetables, Processed Food, Pet Food, Other Applications), country (Saudi Arabia, United Arab Emirates, South Africa), and material type (Aluminium Cans, Steel Cans), offering granular insights for informed decision-making. With a study period spanning 2019-2033, a base year of 2025, and a forecast period of 2025-2033, this report is an essential resource for industry professionals, investors, and stakeholders seeking to understand and capitalize on the growth opportunities within this dynamic market. The market is estimated to be valued at XX million units in 2025.
MEA Food Cans Market Dynamics & Structure
The MEA food cans market is characterized by a moderately concentrated landscape, with key players such as Ball Corporation, Crown Holdings Inc., and regional manufacturers like Gulf Cans Industries and Emirates Metallic Industries Company Limited (EMIC) holding significant market share. Technological innovations, particularly in can manufacturing processes and material science, are driving efficiency and sustainability. Regulatory frameworks surrounding food safety and packaging waste management influence market dynamics. The market faces competition from alternative packaging solutions like flexible pouches and glass jars. Consumer preferences for convenience and shelf-stable products are a significant driver. The historical period (2019-2024) witnessed xx M&A deals, with an anticipated increase in consolidation in the forecast period.
- Market Concentration: Moderately concentrated, with top 5 players holding approximately xx% market share in 2025.
- Technological Innovation: Focus on lightweighting, improved barrier properties, and sustainable materials.
- Regulatory Landscape: Stringent food safety regulations and growing emphasis on recycling.
- Competitive Substitutes: Flexible pouches, glass jars, and other alternative packaging solutions.
- End-User Demographics: Rising population, urbanization, and changing dietary habits drive demand.
- M&A Activity: xx M&A deals in 2019-2024, projecting an increase to xx deals in 2025-2033.
MEA Food Cans Market Growth Trends & Insights
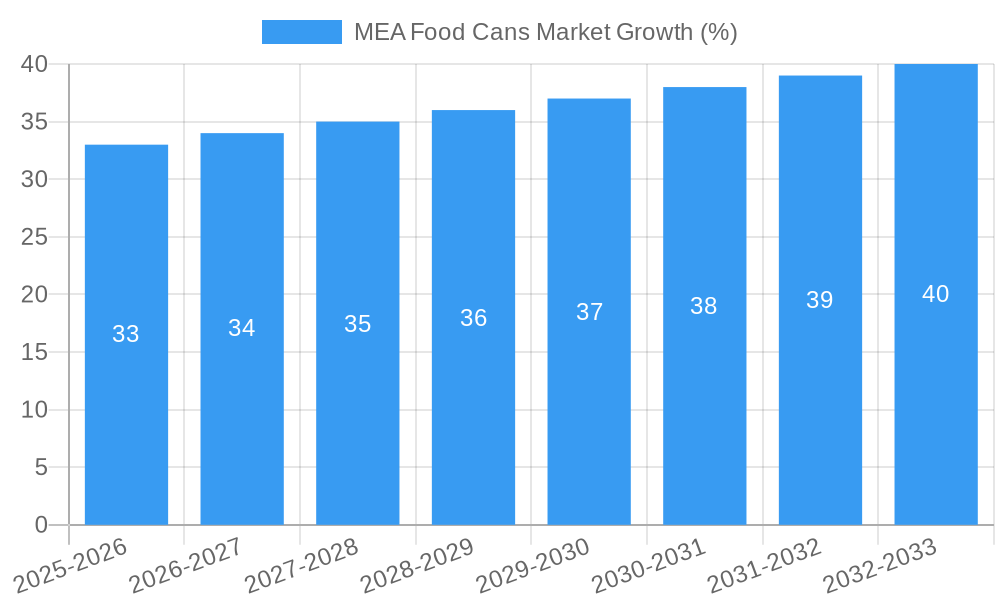
The MEA food cans market is experiencing robust growth, driven by factors such as increasing demand for convenient and shelf-stable food products, expanding food processing industries, and rising disposable incomes across several MEA countries. The market size witnessed a CAGR of xx% during 2019-2024, and is projected to reach XX million units by 2033, exhibiting a CAGR of xx% during the forecast period (2025-2033). Technological advancements in can manufacturing and the introduction of innovative can designs are further propelling market growth. Consumer behavior is shifting towards convenience and healthier food options, which is positively impacting the demand for canned foods. Market penetration of aluminum cans is expected to increase significantly due to factors like their lightweight nature, recyclability, and corrosion resistance.
Dominant Regions, Countries, or Segments in MEA Food Cans Market
Saudi Arabia and the UAE represent the largest segments of the MEA food cans market, driven by factors such as significant population size, robust food processing sector, high per capita consumption of canned goods, and well-developed retail infrastructure. The Ready Meals and Processed Food segments are witnessing the fastest growth due to changing lifestyles and increased demand for convenient food options. Within material types, aluminum cans dominate the market share due to their superior properties and consumer preference.
- Saudi Arabia & UAE: High population density, strong food processing sector, and high per capita consumption of canned goods.
- Ready Meals & Processed Food: Convenience and shelf-stability are major factors driving demand.
- Aluminum Cans: Lightweight, recyclable, and offer superior barrier properties compared to steel cans.
- South Africa: Growing middle class and increasing demand for packaged foods.
MEA Food Cans Market Product Landscape
The MEA food cans market offers a diverse range of products, including various can sizes and shapes catering to different food types and consumer preferences. Innovations focus on improved barrier properties, lightweighting through material advancements, and sustainable designs to enhance shelf life and reduce environmental impact. New product developments are frequently incorporating easy-open features and unique designs to appeal to consumers. The use of sustainable materials is also gaining traction, with manufacturers exploring options like recycled aluminum.
Key Drivers, Barriers & Challenges in MEA Food Cans Market
Key Drivers: Increasing urbanization and changing lifestyles are driving demand for convenient and shelf-stable food products. The growth of the food processing industry and rising disposable incomes are further propelling market expansion. Government initiatives promoting food safety and efficient supply chains play a supportive role.
Challenges: Fluctuations in raw material prices and supply chain disruptions pose challenges. Competition from alternative packaging solutions, as well as regulatory hurdles related to waste management and environmental impact, necessitates continuous innovation and adaptation.
Emerging Opportunities in MEA Food Cans Market
Untapped markets in smaller cities and rural areas present growth opportunities. Innovative can designs, such as slim cans and easy-open features, can enhance consumer appeal. Growing demand for organic and healthy foods offers a potential niche for canned goods. Sustainability initiatives, such as increased use of recycled aluminum and eco-friendly coatings, are increasingly vital to market success.
Growth Accelerators in the MEA Food Cans Market Industry
Technological advancements, such as improved can manufacturing processes and sustainable materials, are key growth drivers. Strategic partnerships between can manufacturers and food processing companies can enhance market penetration. Market expansion into under-served regions can unlock significant growth potential. Government initiatives supporting food security and sustainable packaging are creating a favorable environment.
Key Players Shaping the MEA Food Cans Market Market
- MetPac SA
- Can-Pack Sa
- Ball Corporation
- Crown Holdings Inc
- Gulf Cans Industries
- Sapin UAE
- Arabian Can Industr
- Middle East Metal Can LLC (Trinity Holdings)
- Emirates Metallic Industries Company Limited (EMIC)
- Amopack Can Manufacturers
Notable Milestones in MEA Food Cans Market Sector
- June 2023: Ball Corporation showcased its latest aluminum can and bottle portfolio at BevNET Live Summer 2023, highlighting "slim" can capabilities and new supply locations.
- July 2022: Launch of Oyetty Meals, a West African ready meals brand, driving demand for food cans.
In-Depth MEA Food Cans Market Market Outlook
The MEA food cans market is poised for sustained growth, driven by favorable demographic trends, expanding food processing capacity, and increasing consumer preference for convenient and shelf-stable food products. Strategic investments in advanced manufacturing technologies, sustainable packaging solutions, and market expansion into high-growth regions will be crucial for realizing the market's full potential. The focus on innovation, sustainability, and efficient supply chains will be key to success in the coming years.
MEA Food Cans Market Segmentation
-
1. Material Type
- 1.1. Aluminium Cans
- 1.2. Steel Cans
-
2. Application
- 2.1. Ready Meals
- 2.2. Powder Products
- 2.3. Fish and Seafood
- 2.4. Fruits and Vegetables
- 2.5. Processed Food
- 2.6. Pet Food
- 2.7. Other Applications
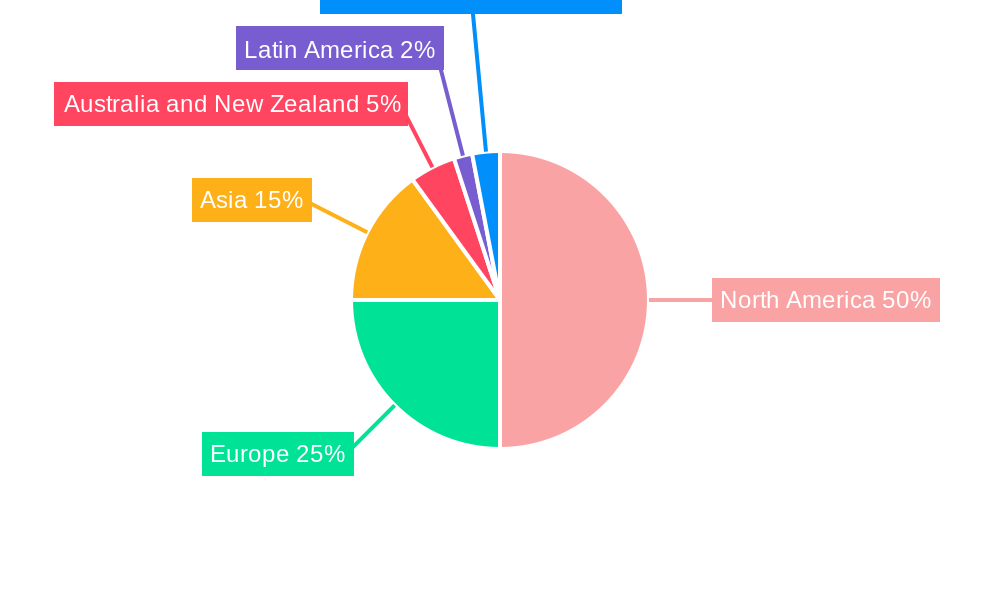
MEA Food Cans Market Segmentation By Geography
-
1. North America
- 1.1. United States
- 1.2. Canada
- 1.3. Mexico
-
2. South America
- 2.1. Brazil
- 2.2. Argentina
- 2.3. Rest of South America
-
3. Europe
- 3.1. United Kingdom
- 3.2. Germany
- 3.3. France
- 3.4. Italy
- 3.5. Spain
- 3.6. Russia
- 3.7. Benelux
- 3.8. Nordics
- 3.9. Rest of Europe
-
4. Middle East & Africa
- 4.1. Turkey
- 4.2. Israel
- 4.3. GCC
- 4.4. North Africa
- 4.5. South Africa
- 4.6. Rest of Middle East & Africa
-
5. Asia Pacific
- 5.1. China
- 5.2. India
- 5.3. Japan
- 5.4. South Korea
- 5.5. ASEAN
- 5.6. Oceania
- 5.7. Rest of Asia Pacific
MEA Food Cans Market REPORT HIGHLIGHTS
| Aspects | Details |
|---|---|
| Study Period | 2019-2033 |
| Base Year | 2024 |
| Estimated Year | 2025 |
| Forecast Period | 2025-2033 |
| Historical Period | 2019-2024 |
| Growth Rate | CAGR of 1.99% from 2019-2033 |
| Segmentation |
|
Table of Contents
- 1. Introduction
- 1.1. Research Scope
- 1.2. Market Segmentation
- 1.3. Research Methodology
- 1.4. Definitions and Assumptions
- 2. Executive Summary
- 2.1. Introduction
- 3. Market Dynamics
- 3.1. Introduction
- 3.2. Market Drivers
- 3.2.1. Rising Disposable Income and Urbanization; Growth in E-commerce Industry is Expected to Drive the Market
- 3.3. Market Restrains
- 3.3.1. Lower Costs of Substitute Products Might Affect the Market
- 3.4. Market Trends
- 3.4.1. Aluminum Cans Expected to Gain Largest Market in the Region
- 4. Market Factor Analysis
- 4.1. Porters Five Forces
- 4.2. Supply/Value Chain
- 4.3. PESTEL analysis
- 4.4. Market Entropy
- 4.5. Patent/Trademark Analysis
- 5. Global MEA Food Cans Market Analysis, Insights and Forecast, 2019-2031
- 5.1. Market Analysis, Insights and Forecast - by Material Type
- 5.1.1. Aluminium Cans
- 5.1.2. Steel Cans
- 5.2. Market Analysis, Insights and Forecast - by Application
- 5.2.1. Ready Meals
- 5.2.2. Powder Products
- 5.2.3. Fish and Seafood
- 5.2.4. Fruits and Vegetables
- 5.2.5. Processed Food
- 5.2.6. Pet Food
- 5.2.7. Other Applications
- 5.3. Market Analysis, Insights and Forecast - by Region
- 5.3.1. North America
- 5.3.2. South America
- 5.3.3. Europe
- 5.3.4. Middle East & Africa
- 5.3.5. Asia Pacific
- 5.1. Market Analysis, Insights and Forecast - by Material Type
- 6. North America MEA Food Cans Market Analysis, Insights and Forecast, 2019-2031
- 6.1. Market Analysis, Insights and Forecast - by Material Type
- 6.1.1. Aluminium Cans
- 6.1.2. Steel Cans
- 6.2. Market Analysis, Insights and Forecast - by Application
- 6.2.1. Ready Meals
- 6.2.2. Powder Products
- 6.2.3. Fish and Seafood
- 6.2.4. Fruits and Vegetables
- 6.2.5. Processed Food
- 6.2.6. Pet Food
- 6.2.7. Other Applications
- 6.1. Market Analysis, Insights and Forecast - by Material Type
- 7. South America MEA Food Cans Market Analysis, Insights and Forecast, 2019-2031
- 7.1. Market Analysis, Insights and Forecast - by Material Type
- 7.1.1. Aluminium Cans
- 7.1.2. Steel Cans
- 7.2. Market Analysis, Insights and Forecast - by Application
- 7.2.1. Ready Meals
- 7.2.2. Powder Products
- 7.2.3. Fish and Seafood
- 7.2.4. Fruits and Vegetables
- 7.2.5. Processed Food
- 7.2.6. Pet Food
- 7.2.7. Other Applications
- 7.1. Market Analysis, Insights and Forecast - by Material Type
- 8. Europe MEA Food Cans Market Analysis, Insights and Forecast, 2019-2031
- 8.1. Market Analysis, Insights and Forecast - by Material Type
- 8.1.1. Aluminium Cans
- 8.1.2. Steel Cans
- 8.2. Market Analysis, Insights and Forecast - by Application
- 8.2.1. Ready Meals
- 8.2.2. Powder Products
- 8.2.3. Fish and Seafood
- 8.2.4. Fruits and Vegetables
- 8.2.5. Processed Food
- 8.2.6. Pet Food
- 8.2.7. Other Applications
- 8.1. Market Analysis, Insights and Forecast - by Material Type
- 9. Middle East & Africa MEA Food Cans Market Analysis, Insights and Forecast, 2019-2031
- 9.1. Market Analysis, Insights and Forecast - by Material Type
- 9.1.1. Aluminium Cans
- 9.1.2. Steel Cans
- 9.2. Market Analysis, Insights and Forecast - by Application
- 9.2.1. Ready Meals
- 9.2.2. Powder Products
- 9.2.3. Fish and Seafood
- 9.2.4. Fruits and Vegetables
- 9.2.5. Processed Food
- 9.2.6. Pet Food
- 9.2.7. Other Applications
- 9.1. Market Analysis, Insights and Forecast - by Material Type
- 10. Asia Pacific MEA Food Cans Market Analysis, Insights and Forecast, 2019-2031
- 10.1. Market Analysis, Insights and Forecast - by Material Type
- 10.1.1. Aluminium Cans
- 10.1.2. Steel Cans
- 10.2. Market Analysis, Insights and Forecast - by Application
- 10.2.1. Ready Meals
- 10.2.2. Powder Products
- 10.2.3. Fish and Seafood
- 10.2.4. Fruits and Vegetables
- 10.2.5. Processed Food
- 10.2.6. Pet Food
- 10.2.7. Other Applications
- 10.1. Market Analysis, Insights and Forecast - by Material Type
- 11. North America MEA Food Cans Market Analysis, Insights and Forecast, 2019-2031
- 11.1. Market Analysis, Insights and Forecast - By Country/Sub-region
- 11.1.1.
- 12. Europe MEA Food Cans Market Analysis, Insights and Forecast, 2019-2031
- 12.1. Market Analysis, Insights and Forecast - By Country/Sub-region
- 12.1.1.
- 13. Asia MEA Food Cans Market Analysis, Insights and Forecast, 2019-2031
- 13.1. Market Analysis, Insights and Forecast - By Country/Sub-region
- 13.1.1.
- 14. Australia and New Zealand MEA Food Cans Market Analysis, Insights and Forecast, 2019-2031
- 14.1. Market Analysis, Insights and Forecast - By Country/Sub-region
- 14.1.1.
- 15. Latin America MEA Food Cans Market Analysis, Insights and Forecast, 2019-2031
- 15.1. Market Analysis, Insights and Forecast - By Country/Sub-region
- 15.1.1.
- 16. Middle East and Africa MEA Food Cans Market Analysis, Insights and Forecast, 2019-2031
- 16.1. Market Analysis, Insights and Forecast - By Country/Sub-region
- 16.1.1.
- 17. Competitive Analysis
- 17.1. Global Market Share Analysis 2024
- 17.2. Company Profiles
- 17.2.1 MetPac SA
- 17.2.1.1. Overview
- 17.2.1.2. Products
- 17.2.1.3. SWOT Analysis
- 17.2.1.4. Recent Developments
- 17.2.1.5. Financials (Based on Availability)
- 17.2.2 Can-Pack Sa
- 17.2.2.1. Overview
- 17.2.2.2. Products
- 17.2.2.3. SWOT Analysis
- 17.2.2.4. Recent Developments
- 17.2.2.5. Financials (Based on Availability)
- 17.2.3 Ball Corporation
- 17.2.3.1. Overview
- 17.2.3.2. Products
- 17.2.3.3. SWOT Analysis
- 17.2.3.4. Recent Developments
- 17.2.3.5. Financials (Based on Availability)
- 17.2.4 Crown Holdings Inc
- 17.2.4.1. Overview
- 17.2.4.2. Products
- 17.2.4.3. SWOT Analysis
- 17.2.4.4. Recent Developments
- 17.2.4.5. Financials (Based on Availability)
- 17.2.5 Gulf Cans Industries
- 17.2.5.1. Overview
- 17.2.5.2. Products
- 17.2.5.3. SWOT Analysis
- 17.2.5.4. Recent Developments
- 17.2.5.5. Financials (Based on Availability)
- 17.2.6 Sapin UAE
- 17.2.6.1. Overview
- 17.2.6.2. Products
- 17.2.6.3. SWOT Analysis
- 17.2.6.4. Recent Developments
- 17.2.6.5. Financials (Based on Availability)
- 17.2.7 Arabian Can Industr
- 17.2.7.1. Overview
- 17.2.7.2. Products
- 17.2.7.3. SWOT Analysis
- 17.2.7.4. Recent Developments
- 17.2.7.5. Financials (Based on Availability)
- 17.2.8 Middle East Metal Can LLC (Trinity Holdings)
- 17.2.8.1. Overview
- 17.2.8.2. Products
- 17.2.8.3. SWOT Analysis
- 17.2.8.4. Recent Developments
- 17.2.8.5. Financials (Based on Availability)
- 17.2.9 Emirates Metallic Industries Company Limited (EMIC)
- 17.2.9.1. Overview
- 17.2.9.2. Products
- 17.2.9.3. SWOT Analysis
- 17.2.9.4. Recent Developments
- 17.2.9.5. Financials (Based on Availability)
- 17.2.10 Amopack Can Manufacturers
- 17.2.10.1. Overview
- 17.2.10.2. Products
- 17.2.10.3. SWOT Analysis
- 17.2.10.4. Recent Developments
- 17.2.10.5. Financials (Based on Availability)
- 17.2.1 MetPac SA
List of Figures
- Figure 1: Global MEA Food Cans Market Revenue Breakdown (Million, %) by Region 2024 & 2032
- Figure 2: North America MEA Food Cans Market Revenue (Million), by Country 2024 & 2032
- Figure 3: North America MEA Food Cans Market Revenue Share (%), by Country 2024 & 2032
- Figure 4: Europe MEA Food Cans Market Revenue (Million), by Country 2024 & 2032
- Figure 5: Europe MEA Food Cans Market Revenue Share (%), by Country 2024 & 2032
- Figure 6: Asia MEA Food Cans Market Revenue (Million), by Country 2024 & 2032
- Figure 7: Asia MEA Food Cans Market Revenue Share (%), by Country 2024 & 2032
- Figure 8: Australia and New Zealand MEA Food Cans Market Revenue (Million), by Country 2024 & 2032
- Figure 9: Australia and New Zealand MEA Food Cans Market Revenue Share (%), by Country 2024 & 2032
- Figure 10: Latin America MEA Food Cans Market Revenue (Million), by Country 2024 & 2032
- Figure 11: Latin America MEA Food Cans Market Revenue Share (%), by Country 2024 & 2032
- Figure 12: Middle East and Africa MEA Food Cans Market Revenue (Million), by Country 2024 & 2032
- Figure 13: Middle East and Africa MEA Food Cans Market Revenue Share (%), by Country 2024 & 2032
- Figure 14: North America MEA Food Cans Market Revenue (Million), by Material Type 2024 & 2032
- Figure 15: North America MEA Food Cans Market Revenue Share (%), by Material Type 2024 & 2032
- Figure 16: North America MEA Food Cans Market Revenue (Million), by Application 2024 & 2032
- Figure 17: North America MEA Food Cans Market Revenue Share (%), by Application 2024 & 2032
- Figure 18: North America MEA Food Cans Market Revenue (Million), by Country 2024 & 2032
- Figure 19: North America MEA Food Cans Market Revenue Share (%), by Country 2024 & 2032
- Figure 20: South America MEA Food Cans Market Revenue (Million), by Material Type 2024 & 2032
- Figure 21: South America MEA Food Cans Market Revenue Share (%), by Material Type 2024 & 2032
- Figure 22: South America MEA Food Cans Market Revenue (Million), by Application 2024 & 2032
- Figure 23: South America MEA Food Cans Market Revenue Share (%), by Application 2024 & 2032
- Figure 24: South America MEA Food Cans Market Revenue (Million), by Country 2024 & 2032
- Figure 25: South America MEA Food Cans Market Revenue Share (%), by Country 2024 & 2032
- Figure 26: Europe MEA Food Cans Market Revenue (Million), by Material Type 2024 & 2032
- Figure 27: Europe MEA Food Cans Market Revenue Share (%), by Material Type 2024 & 2032
- Figure 28: Europe MEA Food Cans Market Revenue (Million), by Application 2024 & 2032
- Figure 29: Europe MEA Food Cans Market Revenue Share (%), by Application 2024 & 2032
- Figure 30: Europe MEA Food Cans Market Revenue (Million), by Country 2024 & 2032
- Figure 31: Europe MEA Food Cans Market Revenue Share (%), by Country 2024 & 2032
- Figure 32: Middle East & Africa MEA Food Cans Market Revenue (Million), by Material Type 2024 & 2032
- Figure 33: Middle East & Africa MEA Food Cans Market Revenue Share (%), by Material Type 2024 & 2032
- Figure 34: Middle East & Africa MEA Food Cans Market Revenue (Million), by Application 2024 & 2032
- Figure 35: Middle East & Africa MEA Food Cans Market Revenue Share (%), by Application 2024 & 2032
- Figure 36: Middle East & Africa MEA Food Cans Market Revenue (Million), by Country 2024 & 2032
- Figure 37: Middle East & Africa MEA Food Cans Market Revenue Share (%), by Country 2024 & 2032
- Figure 38: Asia Pacific MEA Food Cans Market Revenue (Million), by Material Type 2024 & 2032
- Figure 39: Asia Pacific MEA Food Cans Market Revenue Share (%), by Material Type 2024 & 2032
- Figure 40: Asia Pacific MEA Food Cans Market Revenue (Million), by Application 2024 & 2032
- Figure 41: Asia Pacific MEA Food Cans Market Revenue Share (%), by Application 2024 & 2032
- Figure 42: Asia Pacific MEA Food Cans Market Revenue (Million), by Country 2024 & 2032
- Figure 43: Asia Pacific MEA Food Cans Market Revenue Share (%), by Country 2024 & 2032
List of Tables
- Table 1: Global MEA Food Cans Market Revenue Million Forecast, by Region 2019 & 2032
- Table 2: Global MEA Food Cans Market Revenue Million Forecast, by Material Type 2019 & 2032
- Table 3: Global MEA Food Cans Market Revenue Million Forecast, by Application 2019 & 2032
- Table 4: Global MEA Food Cans Market Revenue Million Forecast, by Region 2019 & 2032
- Table 5: Global MEA Food Cans Market Revenue Million Forecast, by Country 2019 & 2032
- Table 6: MEA Food Cans Market Revenue (Million) Forecast, by Application 2019 & 2032
- Table 7: Global MEA Food Cans Market Revenue Million Forecast, by Country 2019 & 2032
- Table 8: MEA Food Cans Market Revenue (Million) Forecast, by Application 2019 & 2032
- Table 9: Global MEA Food Cans Market Revenue Million Forecast, by Country 2019 & 2032
- Table 10: MEA Food Cans Market Revenue (Million) Forecast, by Application 2019 & 2032
- Table 11: Global MEA Food Cans Market Revenue Million Forecast, by Country 2019 & 2032
- Table 12: MEA Food Cans Market Revenue (Million) Forecast, by Application 2019 & 2032
- Table 13: Global MEA Food Cans Market Revenue Million Forecast, by Country 2019 & 2032
- Table 14: MEA Food Cans Market Revenue (Million) Forecast, by Application 2019 & 2032
- Table 15: Global MEA Food Cans Market Revenue Million Forecast, by Country 2019 & 2032
- Table 16: MEA Food Cans Market Revenue (Million) Forecast, by Application 2019 & 2032
- Table 17: Global MEA Food Cans Market Revenue Million Forecast, by Material Type 2019 & 2032
- Table 18: Global MEA Food Cans Market Revenue Million Forecast, by Application 2019 & 2032
- Table 19: Global MEA Food Cans Market Revenue Million Forecast, by Country 2019 & 2032
- Table 20: United States MEA Food Cans Market Revenue (Million) Forecast, by Application 2019 & 2032
- Table 21: Canada MEA Food Cans Market Revenue (Million) Forecast, by Application 2019 & 2032
- Table 22: Mexico MEA Food Cans Market Revenue (Million) Forecast, by Application 2019 & 2032
- Table 23: Global MEA Food Cans Market Revenue Million Forecast, by Material Type 2019 & 2032
- Table 24: Global MEA Food Cans Market Revenue Million Forecast, by Application 2019 & 2032
- Table 25: Global MEA Food Cans Market Revenue Million Forecast, by Country 2019 & 2032
- Table 26: Brazil MEA Food Cans Market Revenue (Million) Forecast, by Application 2019 & 2032
- Table 27: Argentina MEA Food Cans Market Revenue (Million) Forecast, by Application 2019 & 2032
- Table 28: Rest of South America MEA Food Cans Market Revenue (Million) Forecast, by Application 2019 & 2032
- Table 29: Global MEA Food Cans Market Revenue Million Forecast, by Material Type 2019 & 2032
- Table 30: Global MEA Food Cans Market Revenue Million Forecast, by Application 2019 & 2032
- Table 31: Global MEA Food Cans Market Revenue Million Forecast, by Country 2019 & 2032
- Table 32: United Kingdom MEA Food Cans Market Revenue (Million) Forecast, by Application 2019 & 2032
- Table 33: Germany MEA Food Cans Market Revenue (Million) Forecast, by Application 2019 & 2032
- Table 34: France MEA Food Cans Market Revenue (Million) Forecast, by Application 2019 & 2032
- Table 35: Italy MEA Food Cans Market Revenue (Million) Forecast, by Application 2019 & 2032
- Table 36: Spain MEA Food Cans Market Revenue (Million) Forecast, by Application 2019 & 2032
- Table 37: Russia MEA Food Cans Market Revenue (Million) Forecast, by Application 2019 & 2032
- Table 38: Benelux MEA Food Cans Market Revenue (Million) Forecast, by Application 2019 & 2032
- Table 39: Nordics MEA Food Cans Market Revenue (Million) Forecast, by Application 2019 & 2032
- Table 40: Rest of Europe MEA Food Cans Market Revenue (Million) Forecast, by Application 2019 & 2032
- Table 41: Global MEA Food Cans Market Revenue Million Forecast, by Material Type 2019 & 2032
- Table 42: Global MEA Food Cans Market Revenue Million Forecast, by Application 2019 & 2032
- Table 43: Global MEA Food Cans Market Revenue Million Forecast, by Country 2019 & 2032
- Table 44: Turkey MEA Food Cans Market Revenue (Million) Forecast, by Application 2019 & 2032
- Table 45: Israel MEA Food Cans Market Revenue (Million) Forecast, by Application 2019 & 2032
- Table 46: GCC MEA Food Cans Market Revenue (Million) Forecast, by Application 2019 & 2032
- Table 47: North Africa MEA Food Cans Market Revenue (Million) Forecast, by Application 2019 & 2032
- Table 48: South Africa MEA Food Cans Market Revenue (Million) Forecast, by Application 2019 & 2032
- Table 49: Rest of Middle East & Africa MEA Food Cans Market Revenue (Million) Forecast, by Application 2019 & 2032
- Table 50: Global MEA Food Cans Market Revenue Million Forecast, by Material Type 2019 & 2032
- Table 51: Global MEA Food Cans Market Revenue Million Forecast, by Application 2019 & 2032
- Table 52: Global MEA Food Cans Market Revenue Million Forecast, by Country 2019 & 2032
- Table 53: China MEA Food Cans Market Revenue (Million) Forecast, by Application 2019 & 2032
- Table 54: India MEA Food Cans Market Revenue (Million) Forecast, by Application 2019 & 2032
- Table 55: Japan MEA Food Cans Market Revenue (Million) Forecast, by Application 2019 & 2032
- Table 56: South Korea MEA Food Cans Market Revenue (Million) Forecast, by Application 2019 & 2032
- Table 57: ASEAN MEA Food Cans Market Revenue (Million) Forecast, by Application 2019 & 2032
- Table 58: Oceania MEA Food Cans Market Revenue (Million) Forecast, by Application 2019 & 2032
- Table 59: Rest of Asia Pacific MEA Food Cans Market Revenue (Million) Forecast, by Application 2019 & 2032
Frequently Asked Questions
1. What is the projected Compound Annual Growth Rate (CAGR) of the MEA Food Cans Market?
The projected CAGR is approximately 1.99%.
2. Which companies are prominent players in the MEA Food Cans Market?
Key companies in the market include MetPac SA, Can-Pack Sa, Ball Corporation, Crown Holdings Inc, Gulf Cans Industries, Sapin UAE, Arabian Can Industr, Middle East Metal Can LLC (Trinity Holdings), Emirates Metallic Industries Company Limited (EMIC), Amopack Can Manufacturers.
3. What are the main segments of the MEA Food Cans Market?
The market segments include Material Type, Application.
4. Can you provide details about the market size?
The market size is estimated to be USD 1.61 Million as of 2022.
5. What are some drivers contributing to market growth?
Rising Disposable Income and Urbanization; Growth in E-commerce Industry is Expected to Drive the Market.
6. What are the notable trends driving market growth?
Aluminum Cans Expected to Gain Largest Market in the Region.
7. Are there any restraints impacting market growth?
Lower Costs of Substitute Products Might Affect the Market.
8. Can you provide examples of recent developments in the market?
June 2023 - Ball Corporation showcased its latest aluminum can and bottle portfolio at the BevNET Live Summer 2023. Attendees for BevNET Live will learn about Ball's range of "slim" can capabilities, including new supply locations for the 5.5oz, 6.8oz, 8.4oz, and 250mL can sizes.
9. What pricing options are available for accessing the report?
Pricing options include single-user, multi-user, and enterprise licenses priced at USD 4750, USD 4950, and USD 6800 respectively.
10. Is the market size provided in terms of value or volume?
The market size is provided in terms of value, measured in Million.
11. Are there any specific market keywords associated with the report?
Yes, the market keyword associated with the report is "MEA Food Cans Market," which aids in identifying and referencing the specific market segment covered.
12. How do I determine which pricing option suits my needs best?
The pricing options vary based on user requirements and access needs. Individual users may opt for single-user licenses, while businesses requiring broader access may choose multi-user or enterprise licenses for cost-effective access to the report.
13. Are there any additional resources or data provided in the MEA Food Cans Market report?
While the report offers comprehensive insights, it's advisable to review the specific contents or supplementary materials provided to ascertain if additional resources or data are available.
14. How can I stay updated on further developments or reports in the MEA Food Cans Market?
To stay informed about further developments, trends, and reports in the MEA Food Cans Market, consider subscribing to industry newsletters, following relevant companies and organizations, or regularly checking reputable industry news sources and publications.
Methodology
Step 1 - Identification of Relevant Samples Size from Population Database


Step 2 - Approaches for Defining Global Market Size (Value, Volume* & Price*)

Note*: In applicable scenarios
Step 3 - Data Sources
Primary Research
- Web Analytics
- Survey Reports
- Research Institute
- Latest Research Reports
- Opinion Leaders
Secondary Research
- Annual Reports
- White Paper
- Latest Press Release
- Industry Association
- Paid Database
- Investor Presentations

Step 4 - Data Triangulation
Involves using different sources of information in order to increase the validity of a study
These sources are likely to be stakeholders in a program - participants, other researchers, program staff, other community members, and so on.
Then we put all data in single framework & apply various statistical tools to find out the dynamic on the market.
During the analysis stage, feedback from the stakeholder groups would be compared to determine areas of agreement as well as areas of divergence
