

Key Insights
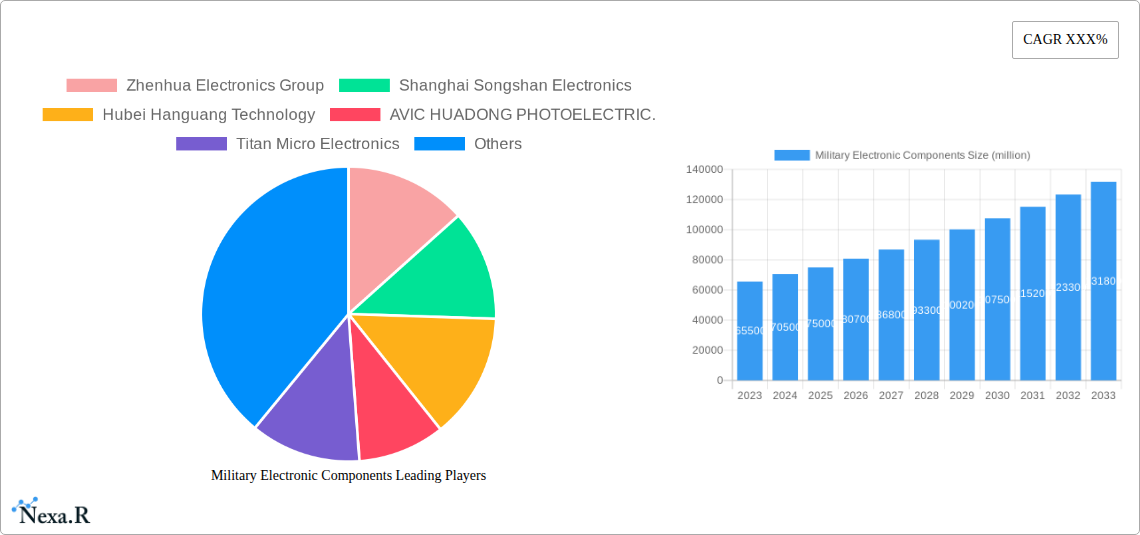
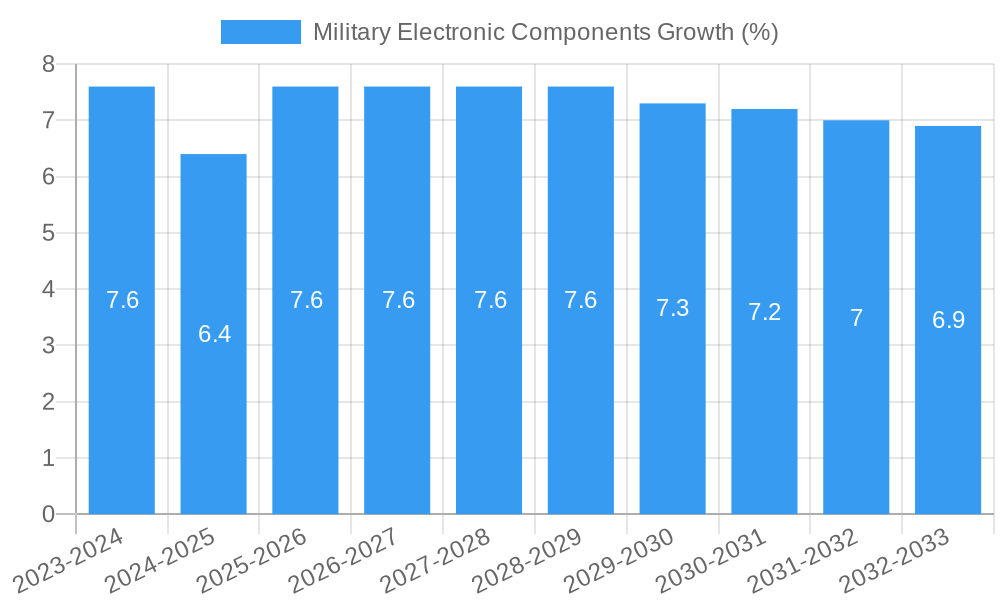
The global Military Electronic Components market is poised for significant expansion, projected to reach an estimated $75,000 million by 2025, with a Compound Annual Growth Rate (CAGR) of 7.5% through 2033. This robust growth is primarily fueled by escalating geopolitical tensions, increased defense spending across major economies, and the continuous integration of advanced technologies like artificial intelligence, IoT, and advanced sensing capabilities into military platforms. Modern warfare demands sophisticated electronic systems for enhanced situational awareness, communication, navigation, and targeting, driving demand for high-performance, reliable, and miniaturized components. The ongoing modernization of existing military hardware and the development of next-generation defense systems further bolster market prospects.
The market is segmented across various applications, including Army, Navy, and Air Force, each with specific component needs. Key component types like Microelectronics, Optoelectronic Devices, and Electromechanical Components are central to this growth, with increasing demand for specialized materials and designs that can withstand extreme environmental conditions and electromagnetic interference. Emerging trends such as the adoption of AI-powered systems, cyber warfare capabilities, and the development of unmanned aerial and ground vehicles are creating new avenues for growth. However, the market faces challenges from the high cost of R&D, stringent regulatory compliance, and the complexity of supply chains. Nevertheless, sustained investment in defense modernization and technological innovation by leading companies like Samsung, Intel, and specialized defense contractors ensures a dynamic and evolving market landscape, particularly in the Asia Pacific and North America regions.
**Military Electronic Components Market Research Report: Trends, Forecasts, and Strategic Insights (2019-2033)**
This comprehensive report delivers an in-depth analysis of the global military electronic components market, forecasting significant growth driven by escalating geopolitical tensions, rapid technological advancements, and the modernization of defense systems. The study spans from 2019 to 2033, with a base and estimated year of 2025, and a forecast period from 2025 to 2033. We explore the intricate market dynamics, growth trends, regional dominance, product landscape, key drivers, barriers, opportunities, and leading players shaping this critical sector.
Military Electronic Components Market Dynamics & Structure
The military electronic components market is characterized by a moderate to high degree of concentration, with several large, established players and a growing number of specialized niche providers. Technological innovation is a primary driver, fueled by the relentless pursuit of enhanced battlefield capabilities, including miniaturization, increased processing power, improved sensor technology, and advanced communication systems. Regulatory frameworks, driven by national security concerns and export control policies, significantly influence market access and product development. Competitive product substitutes, while present, often struggle to match the stringent reliability, durability, and security requirements demanded by military applications. End-user demographics are dominated by governmental defense agencies and prime defense contractors, with their procurement cycles and strategic objectives dictating market demand. Mergers and acquisitions (M&A) trends are observed as companies seek to consolidate capabilities, expand product portfolios, and gain access to new technologies and markets. For instance, the historical period of 2019-2024 saw an estimated 15 significant M&A deals, indicating a strategic consolidation. Innovation barriers include the exceptionally long qualification and testing cycles, high research and development costs, and the need for highly specialized expertise.
- Market Concentration: Moderate to High.
- Technological Innovation Drivers: Miniaturization, AI integration, advanced sensing, secure communications.
- Regulatory Frameworks: National security, export controls (e.g., ITAR), defense procurement standards.
- Competitive Product Substitutes: Limited due to stringent military requirements.
- End-User Demographics: Defense ministries, armed forces, prime defense contractors.
- M&A Trends: Consolidation of capabilities, technology acquisition.
- Innovation Barriers: Rigorous testing, high R&D investment, specialized talent.
Military Electronic Components Growth Trends & Insights
The military electronic components market is projected for robust expansion throughout the forecast period, underpinned by a confluence of factors. The estimated market size in 2025 is expected to reach approximately \$150 billion units, with a projected Compound Annual Growth Rate (CAGR) of 7.5% from 2025 to 2033. This growth is a direct consequence of increasing defense budgets worldwide, driven by geopolitical shifts, the rise of asymmetric warfare, and the imperative to maintain technological superiority. Adoption rates for advanced components are accelerating as militaries invest heavily in upgrading legacy systems and developing next-generation platforms across land, sea, and air domains. Technological disruptions, such as the integration of artificial intelligence (AI) in command and control systems, quantum computing for secure communication, and advanced sensor fusion, are creating new market opportunities and pushing the boundaries of electronic component capabilities. Consumer behavior shifts, within the defense context, are characterized by a demand for more resilient, adaptable, and network-centric solutions. The historical period of 2019-2024 witnessed a steady increase in demand, with market penetration of advanced components for critical systems exceeding 60% by 2024. The increasing emphasis on electronic warfare capabilities and the proliferation of unmanned systems are further stimulating demand for specialized electronic components. The integration of commercial off-the-shelf (COTS) components with ruggedization for military applications is also gaining traction, offering cost efficiencies while meeting performance demands. The trend towards smart weaponry and sophisticated surveillance systems necessitates continuous innovation in microelectronics, optoelectronics, and power solutions.
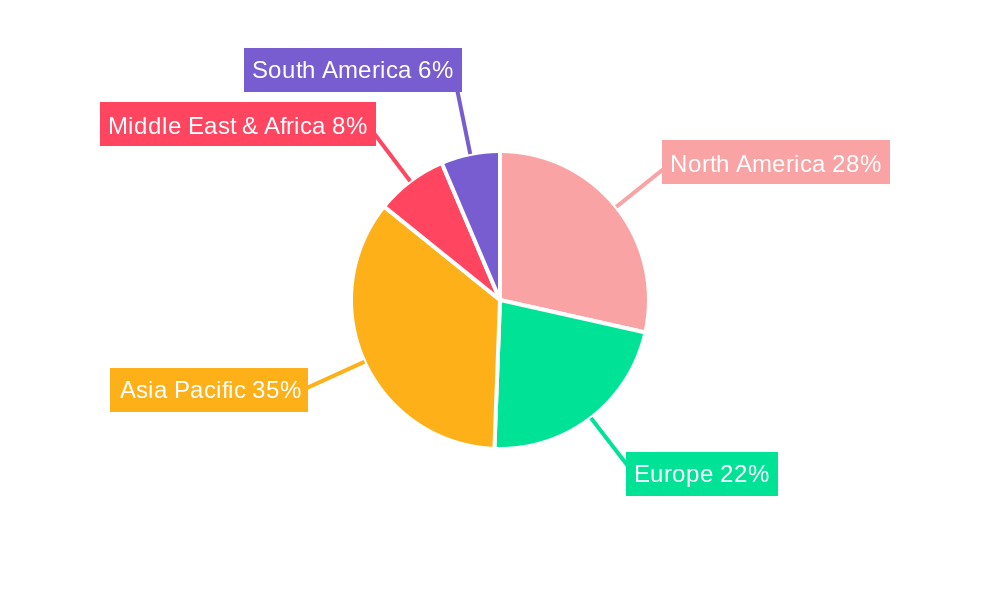
Dominant Regions, Countries, or Segments in Military Electronic Components
The North America region is poised to maintain its dominance in the global military electronic components market, driven by substantial defense spending, continuous technological innovation, and the presence of major defense contractors and research institutions. The United States, as the largest defense spender globally, is the primary engine of growth within this region. Key drivers include the ongoing modernization of its armed forces across the Army, Navy, and Air Force, significant investment in advanced platforms like fighter jets, naval vessels, and ground combat vehicles, and a strong emphasis on research and development in cutting-edge technologies.
Among the Type segments, Microelectronics is expected to be the leading category, encompassing a vast array of components crucial for modern military systems. This includes integrated circuits (ICs), processors, memory chips, and other semiconductor-based devices that power everything from sophisticated radar systems and communication equipment to guidance systems and electronic warfare suites. The demand for smaller, faster, more power-efficient, and highly reliable microelectronic components is a constant, driven by the need for enhanced performance and reduced size, weight, and power (SWaP) in military hardware. The Air Force segment, in particular, is a significant consumer of advanced microelectronics for avionics and airborne systems, while the Navy relies on them for sonar, radar, and combat management systems. The Army integrates them into networked soldier systems, vehicles, and artillery.
- Dominant Region: North America (primarily the United States).
- Dominant Country: United States.
- Leading Segment by Type: Microelectronics.
- Key Application Segment Driving Growth: Air Force, driven by advanced avionics and unmanned aerial systems (UAS).
- Market Share of Microelectronics: Estimated to be 45% of the total market in 2025.
- Growth Potential in Microelectronics: High, fueled by AI integration and advanced sensing.
Military Electronic Components Product Landscape
The military electronic components product landscape is characterized by high-performance, ruggedized, and specialized devices tailored for extreme operational environments. Innovations focus on enhanced processing capabilities for AI-driven applications, advanced sensor technologies for superior reconnaissance and targeting, and highly secure communication modules. Optoelectronic devices are seeing increased use in directed-energy weapons and advanced display systems, while vacuum electronics remain critical for high-power radar and electronic warfare. Chemical and physical power sources are being developed for longer endurance and greater reliability in remote operations. Electromechanical components are evolving towards greater precision and resilience, while special components address unique mission requirements, such as radiation hardening and extreme temperature tolerance.
Key Drivers, Barriers & Challenges in Military Electronic Components
Key Drivers: The primary drivers propelling the military electronic components market include escalating global defense spending and modernization programs, the growing demand for advanced surveillance and reconnaissance systems, and the increasing adoption of electronic warfare capabilities. Technological advancements in AI, IoT, and advanced materials are creating new applications, while the proliferation of unmanned systems necessitates specialized electronic solutions. Geopolitical tensions and the need for network-centric warfare further bolster demand.
Key Barriers & Challenges: Significant challenges include the extremely long and rigorous qualification and testing processes, which can delay product deployment. High research and development costs and the requirement for specialized expertise present substantial barriers. Supply chain vulnerabilities, especially for rare earth materials and advanced semiconductors, pose a risk. Stringent regulatory compliance and export control restrictions can limit market access. Intense competition from both established players and emerging specialized firms also poses a challenge.
Emerging Opportunities in Military Electronic Components
Emerging opportunities lie in the development of AI-powered autonomous systems, robust cybersecurity solutions for defense networks, and advanced sensor fusion technologies for enhanced situational awareness. The growing demand for directed-energy weapons and next-generation communication systems presents significant growth potential. Furthermore, the increasing use of miniaturized and modular electronic components for wearable technology and dismounted soldier systems offers untapped market segments. The integration of advanced materials and additive manufacturing for component production is also an area of considerable innovation.
Growth Accelerators in the Military Electronic Components Industry
The military electronic components industry's growth is significantly accelerated by rapid technological breakthroughs in areas like quantum computing for secure communications and advanced AI algorithms for autonomous decision-making. Strategic partnerships between defense contractors and technology firms are fostering innovation and market expansion. Government initiatives to promote domestic defense manufacturing and research and development, alongside substantial defense budget allocations for modernization, act as potent catalysts. The increasing global demand for advanced defense capabilities, particularly in emerging security paradigms, is a crucial growth accelerator.
Key Players Shaping the Military Electronic Components Market
- Zhenhua Electronics Group
- Shanghai Songshan Electronics
- Hubei Hanguang Technology
- AVIC HUADONG PHOTOELECTRIC.
- Titan Micro Electronics
- Samsung
- Intel
Notable Milestones in Military Electronic Components Sector
- 2020/03: Launch of next-generation radiation-hardened microprocessors by a leading semiconductor firm, enhancing reliability in harsh environments.
- 2021/07: Major defense contractor announces strategic acquisition of a specialized electronic warfare component manufacturer, expanding its integrated solutions.
- 2022/01: Government unveils new initiatives to boost domestic production of critical defense electronic components, reducing reliance on foreign supply chains.
- 2023/09: Significant advancement in miniaturized sensor technology demonstrated, enabling enhanced stealth and reconnaissance capabilities.
- 2024/04: Introduction of AI-accelerated chipsets designed for autonomous drone navigation and target recognition.
In-Depth Military Electronic Components Market Outlook
The outlook for the military electronic components market remains exceptionally strong, driven by sustained global investment in defense modernization and the relentless pace of technological innovation. Growth accelerators such as the demand for AI-integrated systems, advanced cybersecurity solutions, and next-generation communication platforms will continue to shape the industry. Strategic opportunities lie in serving the evolving needs of air, naval, and land forces, with a particular focus on unmanned systems and electronic warfare. The market is expected to witness further consolidation and strategic alliances as companies strive to meet the increasingly complex and demanding requirements of modern military operations.
Military Electronic Components Segmentation
-
1. Application
- 1.1. Army
- 1.2. Navy
- 1.3. Air Force
-
2. Type
- 2.1. Microelectronics
- 2.2. Microelectronics
- 2.3. Optoelectronic Device
- 2.4. Vacuum Electronics
- 2.5. Chemical and Physical Power
- 2.6. Electromechanical Components and General Components
- 2.7. Special Components
- 2.8. Others
Military Electronic Components Segmentation By Geography
-
1. North America
- 1.1. United States
- 1.2. Canada
- 1.3. Mexico
-
2. South America
- 2.1. Brazil
- 2.2. Argentina
- 2.3. Rest of South America
-
3. Europe
- 3.1. United Kingdom
- 3.2. Germany
- 3.3. France
- 3.4. Italy
- 3.5. Spain
- 3.6. Russia
- 3.7. Benelux
- 3.8. Nordics
- 3.9. Rest of Europe
-
4. Middle East & Africa
- 4.1. Turkey
- 4.2. Israel
- 4.3. GCC
- 4.4. North Africa
- 4.5. South Africa
- 4.6. Rest of Middle East & Africa
-
5. Asia Pacific
- 5.1. China
- 5.2. India
- 5.3. Japan
- 5.4. South Korea
- 5.5. ASEAN
- 5.6. Oceania
- 5.7. Rest of Asia Pacific
Military Electronic Components REPORT HIGHLIGHTS
| Aspects | Details |
|---|---|
| Study Period | 2019-2033 |
| Base Year | 2024 |
| Estimated Year | 2025 |
| Forecast Period | 2025-2033 |
| Historical Period | 2019-2024 |
| Growth Rate | CAGR of XXX% from 2019-2033 |
| Segmentation |
|
Table of Contents
- 1. Introduction
- 1.1. Research Scope
- 1.2. Market Segmentation
- 1.3. Research Methodology
- 1.4. Definitions and Assumptions
- 2. Executive Summary
- 2.1. Introduction
- 3. Market Dynamics
- 3.1. Introduction
- 3.2. Market Drivers
- 3.3. Market Restrains
- 3.4. Market Trends
- 4. Market Factor Analysis
- 4.1. Porters Five Forces
- 4.2. Supply/Value Chain
- 4.3. PESTEL analysis
- 4.4. Market Entropy
- 4.5. Patent/Trademark Analysis
- 5. Global Military Electronic Components Analysis, Insights and Forecast, 2019-2031
- 5.1. Market Analysis, Insights and Forecast - by Application
- 5.1.1. Army
- 5.1.2. Navy
- 5.1.3. Air Force
- 5.2. Market Analysis, Insights and Forecast - by Type
- 5.2.1. Microelectronics
- 5.2.2. Microelectronics
- 5.2.3. Optoelectronic Device
- 5.2.4. Vacuum Electronics
- 5.2.5. Chemical and Physical Power
- 5.2.6. Electromechanical Components and General Components
- 5.2.7. Special Components
- 5.2.8. Others
- 5.3. Market Analysis, Insights and Forecast - by Region
- 5.3.1. North America
- 5.3.2. South America
- 5.3.3. Europe
- 5.3.4. Middle East & Africa
- 5.3.5. Asia Pacific
- 5.1. Market Analysis, Insights and Forecast - by Application
- 6. North America Military Electronic Components Analysis, Insights and Forecast, 2019-2031
- 6.1. Market Analysis, Insights and Forecast - by Application
- 6.1.1. Army
- 6.1.2. Navy
- 6.1.3. Air Force
- 6.2. Market Analysis, Insights and Forecast - by Type
- 6.2.1. Microelectronics
- 6.2.2. Microelectronics
- 6.2.3. Optoelectronic Device
- 6.2.4. Vacuum Electronics
- 6.2.5. Chemical and Physical Power
- 6.2.6. Electromechanical Components and General Components
- 6.2.7. Special Components
- 6.2.8. Others
- 6.1. Market Analysis, Insights and Forecast - by Application
- 7. South America Military Electronic Components Analysis, Insights and Forecast, 2019-2031
- 7.1. Market Analysis, Insights and Forecast - by Application
- 7.1.1. Army
- 7.1.2. Navy
- 7.1.3. Air Force
- 7.2. Market Analysis, Insights and Forecast - by Type
- 7.2.1. Microelectronics
- 7.2.2. Microelectronics
- 7.2.3. Optoelectronic Device
- 7.2.4. Vacuum Electronics
- 7.2.5. Chemical and Physical Power
- 7.2.6. Electromechanical Components and General Components
- 7.2.7. Special Components
- 7.2.8. Others
- 7.1. Market Analysis, Insights and Forecast - by Application
- 8. Europe Military Electronic Components Analysis, Insights and Forecast, 2019-2031
- 8.1. Market Analysis, Insights and Forecast - by Application
- 8.1.1. Army
- 8.1.2. Navy
- 8.1.3. Air Force
- 8.2. Market Analysis, Insights and Forecast - by Type
- 8.2.1. Microelectronics
- 8.2.2. Microelectronics
- 8.2.3. Optoelectronic Device
- 8.2.4. Vacuum Electronics
- 8.2.5. Chemical and Physical Power
- 8.2.6. Electromechanical Components and General Components
- 8.2.7. Special Components
- 8.2.8. Others
- 8.1. Market Analysis, Insights and Forecast - by Application
- 9. Middle East & Africa Military Electronic Components Analysis, Insights and Forecast, 2019-2031
- 9.1. Market Analysis, Insights and Forecast - by Application
- 9.1.1. Army
- 9.1.2. Navy
- 9.1.3. Air Force
- 9.2. Market Analysis, Insights and Forecast - by Type
- 9.2.1. Microelectronics
- 9.2.2. Microelectronics
- 9.2.3. Optoelectronic Device
- 9.2.4. Vacuum Electronics
- 9.2.5. Chemical and Physical Power
- 9.2.6. Electromechanical Components and General Components
- 9.2.7. Special Components
- 9.2.8. Others
- 9.1. Market Analysis, Insights and Forecast - by Application
- 10. Asia Pacific Military Electronic Components Analysis, Insights and Forecast, 2019-2031
- 10.1. Market Analysis, Insights and Forecast - by Application
- 10.1.1. Army
- 10.1.2. Navy
- 10.1.3. Air Force
- 10.2. Market Analysis, Insights and Forecast - by Type
- 10.2.1. Microelectronics
- 10.2.2. Microelectronics
- 10.2.3. Optoelectronic Device
- 10.2.4. Vacuum Electronics
- 10.2.5. Chemical and Physical Power
- 10.2.6. Electromechanical Components and General Components
- 10.2.7. Special Components
- 10.2.8. Others
- 10.1. Market Analysis, Insights and Forecast - by Application
- 11. Competitive Analysis
- 11.1. Global Market Share Analysis 2024
- 11.2. Company Profiles
- 11.2.1 Zhenhua Electronics Group
- 11.2.1.1. Overview
- 11.2.1.2. Products
- 11.2.1.3. SWOT Analysis
- 11.2.1.4. Recent Developments
- 11.2.1.5. Financials (Based on Availability)
- 11.2.2 Shanghai Songshan Electronics
- 11.2.2.1. Overview
- 11.2.2.2. Products
- 11.2.2.3. SWOT Analysis
- 11.2.2.4. Recent Developments
- 11.2.2.5. Financials (Based on Availability)
- 11.2.3 Hubei Hanguang Technology
- 11.2.3.1. Overview
- 11.2.3.2. Products
- 11.2.3.3. SWOT Analysis
- 11.2.3.4. Recent Developments
- 11.2.3.5. Financials (Based on Availability)
- 11.2.4 AVIC HUADONG PHOTOELECTRIC.
- 11.2.4.1. Overview
- 11.2.4.2. Products
- 11.2.4.3. SWOT Analysis
- 11.2.4.4. Recent Developments
- 11.2.4.5. Financials (Based on Availability)
- 11.2.5 Titan Micro Electronics
- 11.2.5.1. Overview
- 11.2.5.2. Products
- 11.2.5.3. SWOT Analysis
- 11.2.5.4. Recent Developments
- 11.2.5.5. Financials (Based on Availability)
- 11.2.6 Samsung
- 11.2.6.1. Overview
- 11.2.6.2. Products
- 11.2.6.3. SWOT Analysis
- 11.2.6.4. Recent Developments
- 11.2.6.5. Financials (Based on Availability)
- 11.2.7 Intel
- 11.2.7.1. Overview
- 11.2.7.2. Products
- 11.2.7.3. SWOT Analysis
- 11.2.7.4. Recent Developments
- 11.2.7.5. Financials (Based on Availability)
- 11.2.1 Zhenhua Electronics Group
List of Figures
- Figure 1: Global Military Electronic Components Revenue Breakdown (million, %) by Region 2024 & 2032
- Figure 2: North America Military Electronic Components Revenue (million), by Application 2024 & 2032
- Figure 3: North America Military Electronic Components Revenue Share (%), by Application 2024 & 2032
- Figure 4: North America Military Electronic Components Revenue (million), by Type 2024 & 2032
- Figure 5: North America Military Electronic Components Revenue Share (%), by Type 2024 & 2032
- Figure 6: North America Military Electronic Components Revenue (million), by Country 2024 & 2032
- Figure 7: North America Military Electronic Components Revenue Share (%), by Country 2024 & 2032
- Figure 8: South America Military Electronic Components Revenue (million), by Application 2024 & 2032
- Figure 9: South America Military Electronic Components Revenue Share (%), by Application 2024 & 2032
- Figure 10: South America Military Electronic Components Revenue (million), by Type 2024 & 2032
- Figure 11: South America Military Electronic Components Revenue Share (%), by Type 2024 & 2032
- Figure 12: South America Military Electronic Components Revenue (million), by Country 2024 & 2032
- Figure 13: South America Military Electronic Components Revenue Share (%), by Country 2024 & 2032
- Figure 14: Europe Military Electronic Components Revenue (million), by Application 2024 & 2032
- Figure 15: Europe Military Electronic Components Revenue Share (%), by Application 2024 & 2032
- Figure 16: Europe Military Electronic Components Revenue (million), by Type 2024 & 2032
- Figure 17: Europe Military Electronic Components Revenue Share (%), by Type 2024 & 2032
- Figure 18: Europe Military Electronic Components Revenue (million), by Country 2024 & 2032
- Figure 19: Europe Military Electronic Components Revenue Share (%), by Country 2024 & 2032
- Figure 20: Middle East & Africa Military Electronic Components Revenue (million), by Application 2024 & 2032
- Figure 21: Middle East & Africa Military Electronic Components Revenue Share (%), by Application 2024 & 2032
- Figure 22: Middle East & Africa Military Electronic Components Revenue (million), by Type 2024 & 2032
- Figure 23: Middle East & Africa Military Electronic Components Revenue Share (%), by Type 2024 & 2032
- Figure 24: Middle East & Africa Military Electronic Components Revenue (million), by Country 2024 & 2032
- Figure 25: Middle East & Africa Military Electronic Components Revenue Share (%), by Country 2024 & 2032
- Figure 26: Asia Pacific Military Electronic Components Revenue (million), by Application 2024 & 2032
- Figure 27: Asia Pacific Military Electronic Components Revenue Share (%), by Application 2024 & 2032
- Figure 28: Asia Pacific Military Electronic Components Revenue (million), by Type 2024 & 2032
- Figure 29: Asia Pacific Military Electronic Components Revenue Share (%), by Type 2024 & 2032
- Figure 30: Asia Pacific Military Electronic Components Revenue (million), by Country 2024 & 2032
- Figure 31: Asia Pacific Military Electronic Components Revenue Share (%), by Country 2024 & 2032
List of Tables
- Table 1: Global Military Electronic Components Revenue million Forecast, by Region 2019 & 2032
- Table 2: Global Military Electronic Components Revenue million Forecast, by Application 2019 & 2032
- Table 3: Global Military Electronic Components Revenue million Forecast, by Type 2019 & 2032
- Table 4: Global Military Electronic Components Revenue million Forecast, by Region 2019 & 2032
- Table 5: Global Military Electronic Components Revenue million Forecast, by Application 2019 & 2032
- Table 6: Global Military Electronic Components Revenue million Forecast, by Type 2019 & 2032
- Table 7: Global Military Electronic Components Revenue million Forecast, by Country 2019 & 2032
- Table 8: United States Military Electronic Components Revenue (million) Forecast, by Application 2019 & 2032
- Table 9: Canada Military Electronic Components Revenue (million) Forecast, by Application 2019 & 2032
- Table 10: Mexico Military Electronic Components Revenue (million) Forecast, by Application 2019 & 2032
- Table 11: Global Military Electronic Components Revenue million Forecast, by Application 2019 & 2032
- Table 12: Global Military Electronic Components Revenue million Forecast, by Type 2019 & 2032
- Table 13: Global Military Electronic Components Revenue million Forecast, by Country 2019 & 2032
- Table 14: Brazil Military Electronic Components Revenue (million) Forecast, by Application 2019 & 2032
- Table 15: Argentina Military Electronic Components Revenue (million) Forecast, by Application 2019 & 2032
- Table 16: Rest of South America Military Electronic Components Revenue (million) Forecast, by Application 2019 & 2032
- Table 17: Global Military Electronic Components Revenue million Forecast, by Application 2019 & 2032
- Table 18: Global Military Electronic Components Revenue million Forecast, by Type 2019 & 2032
- Table 19: Global Military Electronic Components Revenue million Forecast, by Country 2019 & 2032
- Table 20: United Kingdom Military Electronic Components Revenue (million) Forecast, by Application 2019 & 2032
- Table 21: Germany Military Electronic Components Revenue (million) Forecast, by Application 2019 & 2032
- Table 22: France Military Electronic Components Revenue (million) Forecast, by Application 2019 & 2032
- Table 23: Italy Military Electronic Components Revenue (million) Forecast, by Application 2019 & 2032
- Table 24: Spain Military Electronic Components Revenue (million) Forecast, by Application 2019 & 2032
- Table 25: Russia Military Electronic Components Revenue (million) Forecast, by Application 2019 & 2032
- Table 26: Benelux Military Electronic Components Revenue (million) Forecast, by Application 2019 & 2032
- Table 27: Nordics Military Electronic Components Revenue (million) Forecast, by Application 2019 & 2032
- Table 28: Rest of Europe Military Electronic Components Revenue (million) Forecast, by Application 2019 & 2032
- Table 29: Global Military Electronic Components Revenue million Forecast, by Application 2019 & 2032
- Table 30: Global Military Electronic Components Revenue million Forecast, by Type 2019 & 2032
- Table 31: Global Military Electronic Components Revenue million Forecast, by Country 2019 & 2032
- Table 32: Turkey Military Electronic Components Revenue (million) Forecast, by Application 2019 & 2032
- Table 33: Israel Military Electronic Components Revenue (million) Forecast, by Application 2019 & 2032
- Table 34: GCC Military Electronic Components Revenue (million) Forecast, by Application 2019 & 2032
- Table 35: North Africa Military Electronic Components Revenue (million) Forecast, by Application 2019 & 2032
- Table 36: South Africa Military Electronic Components Revenue (million) Forecast, by Application 2019 & 2032
- Table 37: Rest of Middle East & Africa Military Electronic Components Revenue (million) Forecast, by Application 2019 & 2032
- Table 38: Global Military Electronic Components Revenue million Forecast, by Application 2019 & 2032
- Table 39: Global Military Electronic Components Revenue million Forecast, by Type 2019 & 2032
- Table 40: Global Military Electronic Components Revenue million Forecast, by Country 2019 & 2032
- Table 41: China Military Electronic Components Revenue (million) Forecast, by Application 2019 & 2032
- Table 42: India Military Electronic Components Revenue (million) Forecast, by Application 2019 & 2032
- Table 43: Japan Military Electronic Components Revenue (million) Forecast, by Application 2019 & 2032
- Table 44: South Korea Military Electronic Components Revenue (million) Forecast, by Application 2019 & 2032
- Table 45: ASEAN Military Electronic Components Revenue (million) Forecast, by Application 2019 & 2032
- Table 46: Oceania Military Electronic Components Revenue (million) Forecast, by Application 2019 & 2032
- Table 47: Rest of Asia Pacific Military Electronic Components Revenue (million) Forecast, by Application 2019 & 2032
Frequently Asked Questions
1. What is the projected Compound Annual Growth Rate (CAGR) of the Military Electronic Components?
The projected CAGR is approximately XXX%.
2. Which companies are prominent players in the Military Electronic Components?
Key companies in the market include Zhenhua Electronics Group, Shanghai Songshan Electronics, Hubei Hanguang Technology, AVIC HUADONG PHOTOELECTRIC., Titan Micro Electronics, Samsung, Intel.
3. What are the main segments of the Military Electronic Components?
The market segments include Application, Type.
4. Can you provide details about the market size?
The market size is estimated to be USD XXX million as of 2022.
5. What are some drivers contributing to market growth?
N/A
6. What are the notable trends driving market growth?
N/A
7. Are there any restraints impacting market growth?
N/A
8. Can you provide examples of recent developments in the market?
N/A
9. What pricing options are available for accessing the report?
Pricing options include single-user, multi-user, and enterprise licenses priced at USD 3950.00, USD 5925.00, and USD 7900.00 respectively.
10. Is the market size provided in terms of value or volume?
The market size is provided in terms of value, measured in million.
11. Are there any specific market keywords associated with the report?
Yes, the market keyword associated with the report is "Military Electronic Components," which aids in identifying and referencing the specific market segment covered.
12. How do I determine which pricing option suits my needs best?
The pricing options vary based on user requirements and access needs. Individual users may opt for single-user licenses, while businesses requiring broader access may choose multi-user or enterprise licenses for cost-effective access to the report.
13. Are there any additional resources or data provided in the Military Electronic Components report?
While the report offers comprehensive insights, it's advisable to review the specific contents or supplementary materials provided to ascertain if additional resources or data are available.
14. How can I stay updated on further developments or reports in the Military Electronic Components?
To stay informed about further developments, trends, and reports in the Military Electronic Components, consider subscribing to industry newsletters, following relevant companies and organizations, or regularly checking reputable industry news sources and publications.
Methodology
Step 1 - Identification of Relevant Samples Size from Population Database


Step 2 - Approaches for Defining Global Market Size (Value, Volume* & Price*)

Note*: In applicable scenarios
Step 3 - Data Sources
Primary Research
- Web Analytics
- Survey Reports
- Research Institute
- Latest Research Reports
- Opinion Leaders
Secondary Research
- Annual Reports
- White Paper
- Latest Press Release
- Industry Association
- Paid Database
- Investor Presentations

Step 4 - Data Triangulation
Involves using different sources of information in order to increase the validity of a study
These sources are likely to be stakeholders in a program - participants, other researchers, program staff, other community members, and so on.
Then we put all data in single framework & apply various statistical tools to find out the dynamic on the market.
During the analysis stage, feedback from the stakeholder groups would be compared to determine areas of agreement as well as areas of divergence
