

Key Insights
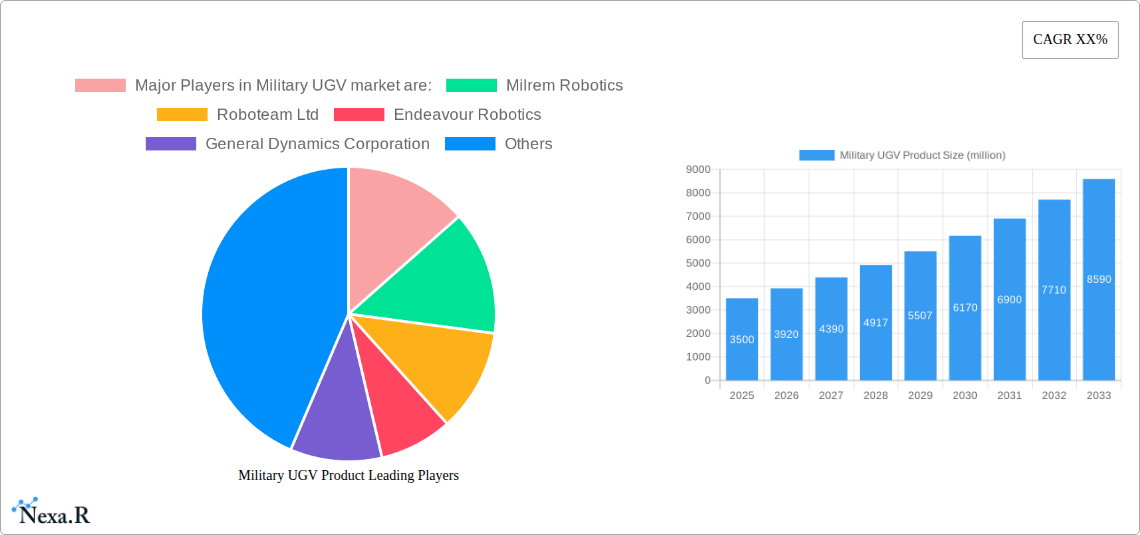
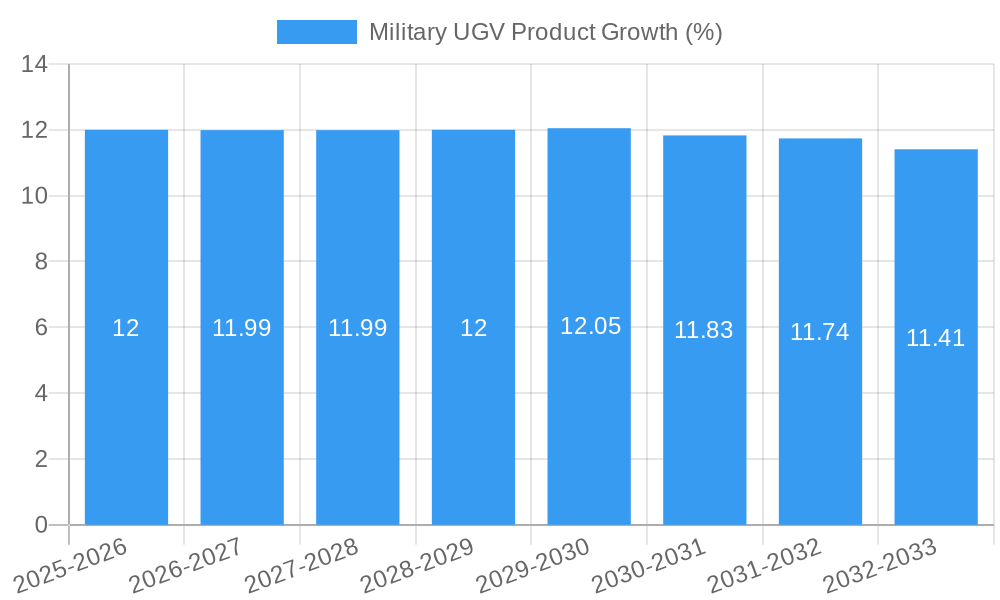
The global Military Unmanned Ground Vehicle (UGV) market is poised for significant expansion, estimated to reach a substantial valuation of approximately USD 3,500 million by 2025. Driven by a projected Compound Annual Growth Rate (CAGR) of around 12%, the market is expected to witness robust growth through 2033. This surge is primarily fueled by the increasing adoption of UGVs in critical military operations such as combat support, enhancing force protection and reducing human risk in hazardous environments. Sophisticated surveillance and reconnaissance capabilities offered by these advanced robotic systems are also a major catalyst, providing real-time intelligence and situational awareness. Furthermore, the growing emphasis on mine clearance operations and the development of specialized UGVs for logistical support and other ancillary roles are contributing to market expansion. Emerging economies are also demonstrating a heightened interest in modernizing their defense capabilities, leading to increased demand for advanced UGV solutions.
The military UGV landscape is characterized by a dynamic interplay of technological advancements and strategic defense investments. Key growth drivers include the relentless pursuit of enhanced operational efficiency, reduced personnel casualties, and the development of autonomous capabilities for military platforms. The market is segmented by application into combat, surveillance & reconnaissance, mine clearance, and others, with combat and surveillance & reconnaissance expected to dominate market share due to their immediate strategic importance. In terms of types, both tire-type and crawler UGVs are witnessing advancements, catering to diverse operational terrains. Major players like Milrem Robotics, General Dynamics Corporation, and Rheinmetall AG are at the forefront of innovation, investing heavily in R&D to develop next-generation UGVs. However, challenges such as high development costs, integration complexities with existing military infrastructure, and evolving regulatory frameworks present potential restraints to market growth. Despite these hurdles, the strategic imperative for technologically superior and adaptable defense solutions ensures a positive outlook for the military UGV market.
Military UGV Product Market Analysis: Dynamics, Trends, and Future Outlook (2019-2033)
This comprehensive report offers an in-depth analysis of the global Military Unmanned Ground Vehicle (UGV) Product market, meticulously examining its dynamics, growth trajectories, and future potential. With a study period spanning from 2019 to 2033, and detailed insights into the base year 2025, this report is an indispensable resource for stakeholders seeking to understand and capitalize on this rapidly evolving sector. The analysis covers parent and child markets, providing a holistic view of market opportunities and challenges.
Military UGV Product Market Dynamics & Structure
The Military UGV Product market is characterized by a dynamic interplay of technological innovation, evolving geopolitical landscapes, and stringent regulatory frameworks. Market concentration varies across different segments, with a few major players dominating specific niches while fostering innovation in others. Technological advancements, particularly in artificial intelligence, autonomous navigation, and advanced sensor technology, are primary drivers of market growth. However, high research and development costs and the need for robust cybersecurity present significant innovation barriers. Regulatory bodies are increasingly focused on establishing ethical guidelines and operational standards for UGV deployment, influencing product development and market entry.
- Market Concentration: Moderate to high in specific application areas like combat support, with a growing number of specialized manufacturers emerging.
- Technological Innovation Drivers: AI-powered autonomy, enhanced sensor suites (e.g., LiDAR, thermal imaging), advanced communication systems, and improved power efficiency.
- Regulatory Frameworks: Increasing focus on ethical considerations, interoperability standards, and rules of engagement for autonomous systems.
- Competitive Product Substitutes: While direct substitutes are limited, manned systems and alternative unmanned platforms (e.g., UAVs for certain reconnaissance tasks) represent indirect competition.
- End-User Demographics: Primarily defense ministries, national security agencies, and military research organizations across developed and developing nations.
- M&A Trends: Strategic acquisitions and partnerships are common as larger defense contractors seek to integrate UGV capabilities into their broader portfolios and smaller innovative companies aim for wider market access. Expected M&A deal volumes in the forecast period are estimated to be around 25-35 deals annually, with an average deal value of $50-$150 million.
Military UGV Product Growth Trends & Insights
The global Military UGV Product market is poised for significant expansion, driven by increasing defense spending and the growing recognition of UGV advantages in enhancing operational effectiveness and soldier safety. The market size is projected to grow from approximately $10 billion in 2025 to over $25 billion by 2033, exhibiting a robust Compound Annual Growth Rate (CAGR) of approximately 12%. Adoption rates are accelerating, particularly for reconnaissance, surveillance, and logistics support roles. Technological disruptions, such as the integration of swarm robotics and advanced human-machine teaming capabilities, are further reshaping the market. Consumer behavior shifts are evident, with military forces prioritizing systems that offer modularity, scalability, and reduced logistical footprints.
The market penetration of Military UGVs is expected to rise from around 15% of the total defense robotics budget in 2025 to over 30% by 2033. This growth is fueled by a continuous demand for enhanced situational awareness, reduced risk to personnel in hazardous environments, and improved efficiency in mission execution. The increasing complexity of modern warfare necessitates advanced solutions that can operate autonomously or semi-autonomously, providing critical support in contested zones. The development of sophisticated AI algorithms is enabling UGVs to perform increasingly complex tasks, from target identification and tracking to autonomous navigation in challenging terrains. Furthermore, the evolution of miniaturized and more powerful sensor technologies is enhancing the reconnaissance and surveillance capabilities of these vehicles, making them indispensable tools for intelligence gathering. The cost-effectiveness of deploying UGVs for certain missions compared to manned platforms is also a significant factor driving their adoption. Emerging trends like the integration of directed energy weapons and advanced counter-measure systems onto UGVs are also expected to spur future growth.
Dominant Regions, Countries, or Segments in Military UGV Product
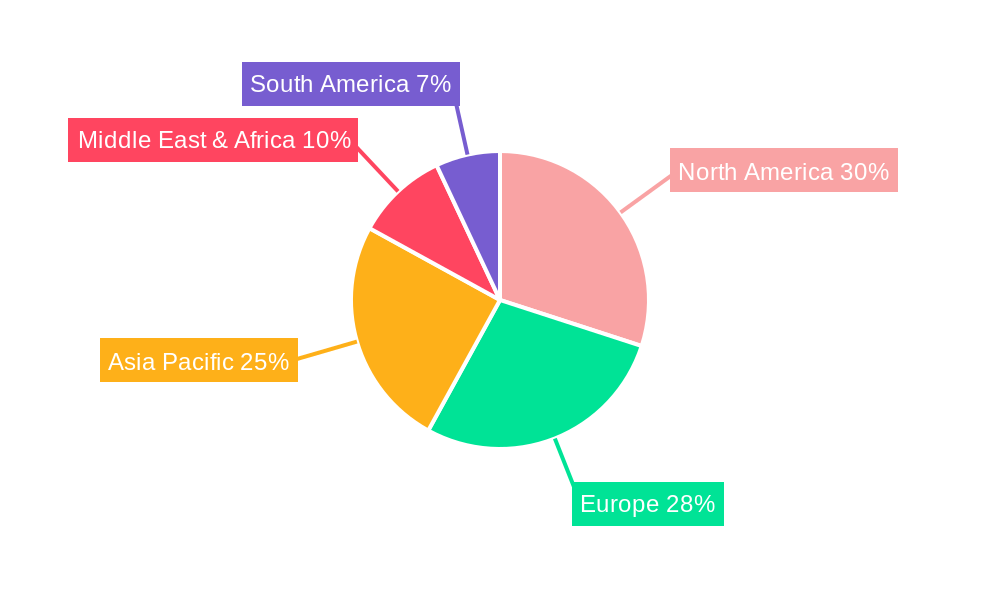
The North America region, particularly the United States, is currently the dominant force in the Military UGV Product market, projected to hold over 40% of the global market share in 2025, expanding to approximately 45% by 2033. This dominance is attributed to substantial defense budgets, continuous investment in advanced military technologies, and a strong focus on research and development. The Surveillance & Reconnaissance application segment is a key growth driver, accounting for an estimated 35% of the market in 2025 and projected to reach 40% by 2033. This is propelled by the persistent need for real-time intelligence, threat detection, and border monitoring in an increasingly complex geopolitical landscape.
Leading Region/Country: North America (primarily the United States)
- Dominance Factors: High defense expenditure, robust R&D ecosystem, proactive procurement policies for unmanned systems, and a well-established industrial base.
- Market Share: Estimated 40% in 2025, projected 45% by 2033.
- Growth Potential: Continual adoption for a wide range of military applications, from tactical reconnaissance to strategic surveillance.
Dominant Application Segment: Surveillance & Reconnaissance
- Key Drivers: Demand for enhanced situational awareness, threat identification, intelligence gathering, and reduced risk to personnel in high-threat environments.
- Market Share: Estimated 35% in 2025, projected 40% by 2033.
- Growth Potential: Integration of advanced sensor technologies, AI for data analysis, and extended operational endurance.
Dominant Type: Crawler UGV
- Key Drivers: Superior mobility in diverse and challenging terrains (off-road, urban environments, difficult weather conditions), crucial for combat and reconnaissance missions.
- Market Share: Estimated 55% in 2025, projected 58% by 2033.
- Growth Potential: Continued development in agility, payload capacity, and survivability for frontline operations.
Europe, particularly countries like Germany and the UK, also represents a significant market due to ongoing modernization efforts and a growing emphasis on unmanned systems within NATO frameworks. Asia-Pacific is emerging as a rapid growth region, driven by increasing defense investments from countries like China and India. The Combat application segment, though currently smaller than surveillance, is expected to see substantial growth as UGV technology matures for direct engagement roles, with an estimated market share of 25% in 2025 and projected to reach 30% by 2033. Mine Clearance and Other applications, while niche, will continue to be important, with Mine Clearance estimated at 15% and Others at 10% in 2025, with slight growth projected.
Military UGV Product Product Landscape
The Military UGV Product landscape is characterized by a surge in innovative solutions designed for enhanced battlefield effectiveness. Products are increasingly featuring modular payloads, allowing for rapid reconfiguration for different missions, from carrying equipment to deploying sensors or even engaging targets. Advanced autonomous navigation systems powered by AI enable these UGVs to operate effectively in complex, GPS-denied environments. Performance metrics are constantly being pushed, with improvements in endurance (up to 72 hours of continuous operation), speed (up to 50 km/h), and payload capacity (up to 500 kg). Unique selling propositions often revolve around their ruggedized design for extreme conditions, their ability to operate in swarms, and their integration with existing command and control systems.
Key Drivers, Barriers & Challenges in Military UGV Product
Key Drivers:
- Enhanced Soldier Safety: Reducing human exposure to hazardous environments and direct combat.
- Improved Operational Efficiency: Automating repetitive tasks, extending reconnaissance capabilities, and providing logistical support.
- Technological Advancements: Maturation of AI, robotics, sensor technology, and communication systems.
- Geopolitical Instability: Increased demand for advanced defense capabilities in response to global security threats.
- Cost-Effectiveness: In the long term, UGVs can offer a lower operational cost compared to manned systems for certain missions.
Key Barriers & Challenges:
- High R&D and Procurement Costs: Initial investment in cutting-edge UGV technology can be substantial, limiting adoption for some nations.
- Regulatory and Ethical Concerns: Developing clear guidelines and ethical frameworks for autonomous weapon systems and data privacy.
- Cybersecurity Vulnerabilities: Protecting UGVs from cyberattacks that could compromise their operation or data.
- Interoperability and Standardization: Ensuring seamless integration with existing military infrastructure and other unmanned systems.
- Reliability and Durability in Extreme Conditions: Guaranteeing consistent performance in harsh battlefield environments.
- Public Perception and Acceptance: Addressing societal concerns regarding autonomous systems in warfare.
- Supply Chain Disruptions: Potential for delays in critical component sourcing, impacting production timelines. The estimated impact of supply chain disruptions can lead to production delays of 10-20% in critical periods.
Emerging Opportunities in Military UGV Product
Emerging opportunities in the Military UGV Product sector lie in the development of highly specialized UGVs for urban warfare, counter-insurgency operations, and disaster response scenarios. The integration of advanced artificial intelligence for decision-making and human-machine teaming represents a significant growth area. Untapped markets include the expansion of UGV use in internal security and border patrol for nations with limited traditional defense resources. Innovative applications like autonomous mine detection and neutralization, as well as the development of modular, rapidly deployable UGV units for humanitarian aid missions in conflict zones, also present substantial opportunities. Evolving consumer preferences are leaning towards more adaptable and AI-driven platforms that can learn and adapt to new threats.
Growth Accelerators in the Military UGV Product Industry
The long-term growth of the Military UGV Product industry is being significantly accelerated by breakthroughs in artificial intelligence, particularly in areas like reinforcement learning for autonomous navigation and swarm intelligence for coordinated operations. Strategic partnerships between technology providers and established defense contractors are crucial for accelerating product development and market penetration. Furthermore, the increasing adoption of UGVs by a wider array of countries, driven by their proven effectiveness and the need for modernizing defense capabilities, is a key growth catalyst. Market expansion strategies, including the development of scalable and cost-effective UGV solutions tailored for specific regional threats, are also fueling sustained growth. The growing emphasis on joint operations involving both manned and unmanned systems is also a significant accelerator.
Key Players Shaping the Military UGV Product Market
- Milrem Robotics
- Roboteam Ltd
- Endeavour Robotics
- General Dynamics Corporation
- Rheinmetall AG
- Cobham PLC
- Harris Corporation
- NEXTER Group
- Israel Aerospace Industries Ltd
- Oshkosh Corporation
- ASELSAN AS
- QinetiQ Group PLC
Notable Milestones in Military UGV Product Sector
- 2019: Milrem Robotics launches the THeMIS UGV with enhanced payload capabilities.
- 2020: Endeavour Robotics unveils the new generation of its popular UGVs, focusing on AI integration.
- 2021: General Dynamics demonstrates advanced autonomous capabilities in its UGV prototypes.
- 2022: Rheinmetall AG secures a significant contract for its UGV systems with a European nation.
- 2023: Roboteam Ltd announces a strategic partnership for the development of advanced reconnaissance UGVs.
- 2024 (Early): Israel Aerospace Industries Ltd showcases a new modular UGV platform with versatile mission capabilities.
- 2024 (Mid): Oshkosh Corporation announces advancements in UGV power and mobility systems.
- 2025 (Projected): Significant advancements in AI-driven autonomy for UGV combat support roles are anticipated.
In-Depth Military UGV Product Market Outlook
The future market outlook for Military UGVs is exceptionally promising, driven by ongoing technological innovation and a sustained global demand for advanced defense solutions. Growth accelerators include the maturation of AI for increasingly sophisticated autonomous operations, fostering enhanced battlefield capabilities. Strategic partnerships and collaborations between leading defense firms and cutting-edge technology developers will continue to streamline product development and market entry. The expansion of UGV applications beyond traditional combat and reconnaissance into logistics, medical evacuation, and border security will broaden the market base. Furthermore, the increasing emphasis on interoperability and modularity in military procurement will favor UGV systems that can be easily integrated into existing forces and adapted to diverse operational needs, promising substantial long-term market potential and strategic opportunities for stakeholders.
Military UGV Product Segmentation
-
1. Application
- 1.1. Combat
- 1.2. Surveillance & Reconnaissance
- 1.3. Mine Clearance
- 1.4. Others
-
2. Types
- 2.1. Tire Type UGV
- 2.2. Crawler UGV
- 2.3. Others
Military UGV Product Segmentation By Geography
-
1. North America
- 1.1. United States
- 1.2. Canada
- 1.3. Mexico
-
2. South America
- 2.1. Brazil
- 2.2. Argentina
- 2.3. Rest of South America
-
3. Europe
- 3.1. United Kingdom
- 3.2. Germany
- 3.3. France
- 3.4. Italy
- 3.5. Spain
- 3.6. Russia
- 3.7. Benelux
- 3.8. Nordics
- 3.9. Rest of Europe
-
4. Middle East & Africa
- 4.1. Turkey
- 4.2. Israel
- 4.3. GCC
- 4.4. North Africa
- 4.5. South Africa
- 4.6. Rest of Middle East & Africa
-
5. Asia Pacific
- 5.1. China
- 5.2. India
- 5.3. Japan
- 5.4. South Korea
- 5.5. ASEAN
- 5.6. Oceania
- 5.7. Rest of Asia Pacific
Military UGV Product REPORT HIGHLIGHTS
| Aspects | Details |
|---|---|
| Study Period | 2019-2033 |
| Base Year | 2024 |
| Estimated Year | 2025 |
| Forecast Period | 2025-2033 |
| Historical Period | 2019-2024 |
| Growth Rate | CAGR of XX% from 2019-2033 |
| Segmentation |
|
Table of Contents
- 1. Introduction
- 1.1. Research Scope
- 1.2. Market Segmentation
- 1.3. Research Methodology
- 1.4. Definitions and Assumptions
- 2. Executive Summary
- 2.1. Introduction
- 3. Market Dynamics
- 3.1. Introduction
- 3.2. Market Drivers
- 3.3. Market Restrains
- 3.4. Market Trends
- 4. Market Factor Analysis
- 4.1. Porters Five Forces
- 4.2. Supply/Value Chain
- 4.3. PESTEL analysis
- 4.4. Market Entropy
- 4.5. Patent/Trademark Analysis
- 5. Global Military UGV Product Analysis, Insights and Forecast, 2019-2031
- 5.1. Market Analysis, Insights and Forecast - by Application
- 5.1.1. Combat
- 5.1.2. Surveillance & Reconnaissance
- 5.1.3. Mine Clearance
- 5.1.4. Others
- 5.2. Market Analysis, Insights and Forecast - by Types
- 5.2.1. Tire Type UGV
- 5.2.2. Crawler UGV
- 5.2.3. Others
- 5.3. Market Analysis, Insights and Forecast - by Region
- 5.3.1. North America
- 5.3.2. South America
- 5.3.3. Europe
- 5.3.4. Middle East & Africa
- 5.3.5. Asia Pacific
- 5.1. Market Analysis, Insights and Forecast - by Application
- 6. North America Military UGV Product Analysis, Insights and Forecast, 2019-2031
- 6.1. Market Analysis, Insights and Forecast - by Application
- 6.1.1. Combat
- 6.1.2. Surveillance & Reconnaissance
- 6.1.3. Mine Clearance
- 6.1.4. Others
- 6.2. Market Analysis, Insights and Forecast - by Types
- 6.2.1. Tire Type UGV
- 6.2.2. Crawler UGV
- 6.2.3. Others
- 6.1. Market Analysis, Insights and Forecast - by Application
- 7. South America Military UGV Product Analysis, Insights and Forecast, 2019-2031
- 7.1. Market Analysis, Insights and Forecast - by Application
- 7.1.1. Combat
- 7.1.2. Surveillance & Reconnaissance
- 7.1.3. Mine Clearance
- 7.1.4. Others
- 7.2. Market Analysis, Insights and Forecast - by Types
- 7.2.1. Tire Type UGV
- 7.2.2. Crawler UGV
- 7.2.3. Others
- 7.1. Market Analysis, Insights and Forecast - by Application
- 8. Europe Military UGV Product Analysis, Insights and Forecast, 2019-2031
- 8.1. Market Analysis, Insights and Forecast - by Application
- 8.1.1. Combat
- 8.1.2. Surveillance & Reconnaissance
- 8.1.3. Mine Clearance
- 8.1.4. Others
- 8.2. Market Analysis, Insights and Forecast - by Types
- 8.2.1. Tire Type UGV
- 8.2.2. Crawler UGV
- 8.2.3. Others
- 8.1. Market Analysis, Insights and Forecast - by Application
- 9. Middle East & Africa Military UGV Product Analysis, Insights and Forecast, 2019-2031
- 9.1. Market Analysis, Insights and Forecast - by Application
- 9.1.1. Combat
- 9.1.2. Surveillance & Reconnaissance
- 9.1.3. Mine Clearance
- 9.1.4. Others
- 9.2. Market Analysis, Insights and Forecast - by Types
- 9.2.1. Tire Type UGV
- 9.2.2. Crawler UGV
- 9.2.3. Others
- 9.1. Market Analysis, Insights and Forecast - by Application
- 10. Asia Pacific Military UGV Product Analysis, Insights and Forecast, 2019-2031
- 10.1. Market Analysis, Insights and Forecast - by Application
- 10.1.1. Combat
- 10.1.2. Surveillance & Reconnaissance
- 10.1.3. Mine Clearance
- 10.1.4. Others
- 10.2. Market Analysis, Insights and Forecast - by Types
- 10.2.1. Tire Type UGV
- 10.2.2. Crawler UGV
- 10.2.3. Others
- 10.1. Market Analysis, Insights and Forecast - by Application
- 11. Competitive Analysis
- 11.1. Global Market Share Analysis 2024
- 11.2. Company Profiles
- 11.2.1. Major Players in Military UGV market are
List of Figures
- Figure 1: Global Military UGV Product Revenue Breakdown (million, %) by Region 2024 & 2032
- Figure 2: Global Military UGV Product Volume Breakdown (K, %) by Region 2024 & 2032
- Figure 3: North America Military UGV Product Revenue (million), by Application 2024 & 2032
- Figure 4: North America Military UGV Product Volume (K), by Application 2024 & 2032
- Figure 5: North America Military UGV Product Revenue Share (%), by Application 2024 & 2032
- Figure 6: North America Military UGV Product Volume Share (%), by Application 2024 & 2032
- Figure 7: North America Military UGV Product Revenue (million), by Types 2024 & 2032
- Figure 8: North America Military UGV Product Volume (K), by Types 2024 & 2032
- Figure 9: North America Military UGV Product Revenue Share (%), by Types 2024 & 2032
- Figure 10: North America Military UGV Product Volume Share (%), by Types 2024 & 2032
- Figure 11: North America Military UGV Product Revenue (million), by Country 2024 & 2032
- Figure 12: North America Military UGV Product Volume (K), by Country 2024 & 2032
- Figure 13: North America Military UGV Product Revenue Share (%), by Country 2024 & 2032
- Figure 14: North America Military UGV Product Volume Share (%), by Country 2024 & 2032
- Figure 15: South America Military UGV Product Revenue (million), by Application 2024 & 2032
- Figure 16: South America Military UGV Product Volume (K), by Application 2024 & 2032
- Figure 17: South America Military UGV Product Revenue Share (%), by Application 2024 & 2032
- Figure 18: South America Military UGV Product Volume Share (%), by Application 2024 & 2032
- Figure 19: South America Military UGV Product Revenue (million), by Types 2024 & 2032
- Figure 20: South America Military UGV Product Volume (K), by Types 2024 & 2032
- Figure 21: South America Military UGV Product Revenue Share (%), by Types 2024 & 2032
- Figure 22: South America Military UGV Product Volume Share (%), by Types 2024 & 2032
- Figure 23: South America Military UGV Product Revenue (million), by Country 2024 & 2032
- Figure 24: South America Military UGV Product Volume (K), by Country 2024 & 2032
- Figure 25: South America Military UGV Product Revenue Share (%), by Country 2024 & 2032
- Figure 26: South America Military UGV Product Volume Share (%), by Country 2024 & 2032
- Figure 27: Europe Military UGV Product Revenue (million), by Application 2024 & 2032
- Figure 28: Europe Military UGV Product Volume (K), by Application 2024 & 2032
- Figure 29: Europe Military UGV Product Revenue Share (%), by Application 2024 & 2032
- Figure 30: Europe Military UGV Product Volume Share (%), by Application 2024 & 2032
- Figure 31: Europe Military UGV Product Revenue (million), by Types 2024 & 2032
- Figure 32: Europe Military UGV Product Volume (K), by Types 2024 & 2032
- Figure 33: Europe Military UGV Product Revenue Share (%), by Types 2024 & 2032
- Figure 34: Europe Military UGV Product Volume Share (%), by Types 2024 & 2032
- Figure 35: Europe Military UGV Product Revenue (million), by Country 2024 & 2032
- Figure 36: Europe Military UGV Product Volume (K), by Country 2024 & 2032
- Figure 37: Europe Military UGV Product Revenue Share (%), by Country 2024 & 2032
- Figure 38: Europe Military UGV Product Volume Share (%), by Country 2024 & 2032
- Figure 39: Middle East & Africa Military UGV Product Revenue (million), by Application 2024 & 2032
- Figure 40: Middle East & Africa Military UGV Product Volume (K), by Application 2024 & 2032
- Figure 41: Middle East & Africa Military UGV Product Revenue Share (%), by Application 2024 & 2032
- Figure 42: Middle East & Africa Military UGV Product Volume Share (%), by Application 2024 & 2032
- Figure 43: Middle East & Africa Military UGV Product Revenue (million), by Types 2024 & 2032
- Figure 44: Middle East & Africa Military UGV Product Volume (K), by Types 2024 & 2032
- Figure 45: Middle East & Africa Military UGV Product Revenue Share (%), by Types 2024 & 2032
- Figure 46: Middle East & Africa Military UGV Product Volume Share (%), by Types 2024 & 2032
- Figure 47: Middle East & Africa Military UGV Product Revenue (million), by Country 2024 & 2032
- Figure 48: Middle East & Africa Military UGV Product Volume (K), by Country 2024 & 2032
- Figure 49: Middle East & Africa Military UGV Product Revenue Share (%), by Country 2024 & 2032
- Figure 50: Middle East & Africa Military UGV Product Volume Share (%), by Country 2024 & 2032
- Figure 51: Asia Pacific Military UGV Product Revenue (million), by Application 2024 & 2032
- Figure 52: Asia Pacific Military UGV Product Volume (K), by Application 2024 & 2032
- Figure 53: Asia Pacific Military UGV Product Revenue Share (%), by Application 2024 & 2032
- Figure 54: Asia Pacific Military UGV Product Volume Share (%), by Application 2024 & 2032
- Figure 55: Asia Pacific Military UGV Product Revenue (million), by Types 2024 & 2032
- Figure 56: Asia Pacific Military UGV Product Volume (K), by Types 2024 & 2032
- Figure 57: Asia Pacific Military UGV Product Revenue Share (%), by Types 2024 & 2032
- Figure 58: Asia Pacific Military UGV Product Volume Share (%), by Types 2024 & 2032
- Figure 59: Asia Pacific Military UGV Product Revenue (million), by Country 2024 & 2032
- Figure 60: Asia Pacific Military UGV Product Volume (K), by Country 2024 & 2032
- Figure 61: Asia Pacific Military UGV Product Revenue Share (%), by Country 2024 & 2032
- Figure 62: Asia Pacific Military UGV Product Volume Share (%), by Country 2024 & 2032
List of Tables
- Table 1: Global Military UGV Product Revenue million Forecast, by Region 2019 & 2032
- Table 2: Global Military UGV Product Volume K Forecast, by Region 2019 & 2032
- Table 3: Global Military UGV Product Revenue million Forecast, by Application 2019 & 2032
- Table 4: Global Military UGV Product Volume K Forecast, by Application 2019 & 2032
- Table 5: Global Military UGV Product Revenue million Forecast, by Types 2019 & 2032
- Table 6: Global Military UGV Product Volume K Forecast, by Types 2019 & 2032
- Table 7: Global Military UGV Product Revenue million Forecast, by Region 2019 & 2032
- Table 8: Global Military UGV Product Volume K Forecast, by Region 2019 & 2032
- Table 9: Global Military UGV Product Revenue million Forecast, by Application 2019 & 2032
- Table 10: Global Military UGV Product Volume K Forecast, by Application 2019 & 2032
- Table 11: Global Military UGV Product Revenue million Forecast, by Types 2019 & 2032
- Table 12: Global Military UGV Product Volume K Forecast, by Types 2019 & 2032
- Table 13: Global Military UGV Product Revenue million Forecast, by Country 2019 & 2032
- Table 14: Global Military UGV Product Volume K Forecast, by Country 2019 & 2032
- Table 15: United States Military UGV Product Revenue (million) Forecast, by Application 2019 & 2032
- Table 16: United States Military UGV Product Volume (K) Forecast, by Application 2019 & 2032
- Table 17: Canada Military UGV Product Revenue (million) Forecast, by Application 2019 & 2032
- Table 18: Canada Military UGV Product Volume (K) Forecast, by Application 2019 & 2032
- Table 19: Mexico Military UGV Product Revenue (million) Forecast, by Application 2019 & 2032
- Table 20: Mexico Military UGV Product Volume (K) Forecast, by Application 2019 & 2032
- Table 21: Global Military UGV Product Revenue million Forecast, by Application 2019 & 2032
- Table 22: Global Military UGV Product Volume K Forecast, by Application 2019 & 2032
- Table 23: Global Military UGV Product Revenue million Forecast, by Types 2019 & 2032
- Table 24: Global Military UGV Product Volume K Forecast, by Types 2019 & 2032
- Table 25: Global Military UGV Product Revenue million Forecast, by Country 2019 & 2032
- Table 26: Global Military UGV Product Volume K Forecast, by Country 2019 & 2032
- Table 27: Brazil Military UGV Product Revenue (million) Forecast, by Application 2019 & 2032
- Table 28: Brazil Military UGV Product Volume (K) Forecast, by Application 2019 & 2032
- Table 29: Argentina Military UGV Product Revenue (million) Forecast, by Application 2019 & 2032
- Table 30: Argentina Military UGV Product Volume (K) Forecast, by Application 2019 & 2032
- Table 31: Rest of South America Military UGV Product Revenue (million) Forecast, by Application 2019 & 2032
- Table 32: Rest of South America Military UGV Product Volume (K) Forecast, by Application 2019 & 2032
- Table 33: Global Military UGV Product Revenue million Forecast, by Application 2019 & 2032
- Table 34: Global Military UGV Product Volume K Forecast, by Application 2019 & 2032
- Table 35: Global Military UGV Product Revenue million Forecast, by Types 2019 & 2032
- Table 36: Global Military UGV Product Volume K Forecast, by Types 2019 & 2032
- Table 37: Global Military UGV Product Revenue million Forecast, by Country 2019 & 2032
- Table 38: Global Military UGV Product Volume K Forecast, by Country 2019 & 2032
- Table 39: United Kingdom Military UGV Product Revenue (million) Forecast, by Application 2019 & 2032
- Table 40: United Kingdom Military UGV Product Volume (K) Forecast, by Application 2019 & 2032
- Table 41: Germany Military UGV Product Revenue (million) Forecast, by Application 2019 & 2032
- Table 42: Germany Military UGV Product Volume (K) Forecast, by Application 2019 & 2032
- Table 43: France Military UGV Product Revenue (million) Forecast, by Application 2019 & 2032
- Table 44: France Military UGV Product Volume (K) Forecast, by Application 2019 & 2032
- Table 45: Italy Military UGV Product Revenue (million) Forecast, by Application 2019 & 2032
- Table 46: Italy Military UGV Product Volume (K) Forecast, by Application 2019 & 2032
- Table 47: Spain Military UGV Product Revenue (million) Forecast, by Application 2019 & 2032
- Table 48: Spain Military UGV Product Volume (K) Forecast, by Application 2019 & 2032
- Table 49: Russia Military UGV Product Revenue (million) Forecast, by Application 2019 & 2032
- Table 50: Russia Military UGV Product Volume (K) Forecast, by Application 2019 & 2032
- Table 51: Benelux Military UGV Product Revenue (million) Forecast, by Application 2019 & 2032
- Table 52: Benelux Military UGV Product Volume (K) Forecast, by Application 2019 & 2032
- Table 53: Nordics Military UGV Product Revenue (million) Forecast, by Application 2019 & 2032
- Table 54: Nordics Military UGV Product Volume (K) Forecast, by Application 2019 & 2032
- Table 55: Rest of Europe Military UGV Product Revenue (million) Forecast, by Application 2019 & 2032
- Table 56: Rest of Europe Military UGV Product Volume (K) Forecast, by Application 2019 & 2032
- Table 57: Global Military UGV Product Revenue million Forecast, by Application 2019 & 2032
- Table 58: Global Military UGV Product Volume K Forecast, by Application 2019 & 2032
- Table 59: Global Military UGV Product Revenue million Forecast, by Types 2019 & 2032
- Table 60: Global Military UGV Product Volume K Forecast, by Types 2019 & 2032
- Table 61: Global Military UGV Product Revenue million Forecast, by Country 2019 & 2032
- Table 62: Global Military UGV Product Volume K Forecast, by Country 2019 & 2032
- Table 63: Turkey Military UGV Product Revenue (million) Forecast, by Application 2019 & 2032
- Table 64: Turkey Military UGV Product Volume (K) Forecast, by Application 2019 & 2032
- Table 65: Israel Military UGV Product Revenue (million) Forecast, by Application 2019 & 2032
- Table 66: Israel Military UGV Product Volume (K) Forecast, by Application 2019 & 2032
- Table 67: GCC Military UGV Product Revenue (million) Forecast, by Application 2019 & 2032
- Table 68: GCC Military UGV Product Volume (K) Forecast, by Application 2019 & 2032
- Table 69: North Africa Military UGV Product Revenue (million) Forecast, by Application 2019 & 2032
- Table 70: North Africa Military UGV Product Volume (K) Forecast, by Application 2019 & 2032
- Table 71: South Africa Military UGV Product Revenue (million) Forecast, by Application 2019 & 2032
- Table 72: South Africa Military UGV Product Volume (K) Forecast, by Application 2019 & 2032
- Table 73: Rest of Middle East & Africa Military UGV Product Revenue (million) Forecast, by Application 2019 & 2032
- Table 74: Rest of Middle East & Africa Military UGV Product Volume (K) Forecast, by Application 2019 & 2032
- Table 75: Global Military UGV Product Revenue million Forecast, by Application 2019 & 2032
- Table 76: Global Military UGV Product Volume K Forecast, by Application 2019 & 2032
- Table 77: Global Military UGV Product Revenue million Forecast, by Types 2019 & 2032
- Table 78: Global Military UGV Product Volume K Forecast, by Types 2019 & 2032
- Table 79: Global Military UGV Product Revenue million Forecast, by Country 2019 & 2032
- Table 80: Global Military UGV Product Volume K Forecast, by Country 2019 & 2032
- Table 81: China Military UGV Product Revenue (million) Forecast, by Application 2019 & 2032
- Table 82: China Military UGV Product Volume (K) Forecast, by Application 2019 & 2032
- Table 83: India Military UGV Product Revenue (million) Forecast, by Application 2019 & 2032
- Table 84: India Military UGV Product Volume (K) Forecast, by Application 2019 & 2032
- Table 85: Japan Military UGV Product Revenue (million) Forecast, by Application 2019 & 2032
- Table 86: Japan Military UGV Product Volume (K) Forecast, by Application 2019 & 2032
- Table 87: South Korea Military UGV Product Revenue (million) Forecast, by Application 2019 & 2032
- Table 88: South Korea Military UGV Product Volume (K) Forecast, by Application 2019 & 2032
- Table 89: ASEAN Military UGV Product Revenue (million) Forecast, by Application 2019 & 2032
- Table 90: ASEAN Military UGV Product Volume (K) Forecast, by Application 2019 & 2032
- Table 91: Oceania Military UGV Product Revenue (million) Forecast, by Application 2019 & 2032
- Table 92: Oceania Military UGV Product Volume (K) Forecast, by Application 2019 & 2032
- Table 93: Rest of Asia Pacific Military UGV Product Revenue (million) Forecast, by Application 2019 & 2032
- Table 94: Rest of Asia Pacific Military UGV Product Volume (K) Forecast, by Application 2019 & 2032
Frequently Asked Questions
1. What is the projected Compound Annual Growth Rate (CAGR) of the Military UGV Product?
The projected CAGR is approximately XX%.
2. Which companies are prominent players in the Military UGV Product?
Key companies in the market include Major Players in Military UGV market are:, Milrem Robotics, Roboteam Ltd, Endeavour Robotics, General Dynamics Corporation, Rheinmetall AG, Cobham PLC, Harris Corporation, NEXTER Group, Israel Aerospace Industries Ltd, Oshkosh Corporation, ASELSAN AS, QinetiQ Group PLC.
3. What are the main segments of the Military UGV Product?
The market segments include Application, Types.
4. Can you provide details about the market size?
The market size is estimated to be USD XXX million as of 2022.
5. What are some drivers contributing to market growth?
N/A
6. What are the notable trends driving market growth?
N/A
7. Are there any restraints impacting market growth?
N/A
8. Can you provide examples of recent developments in the market?
N/A
9. What pricing options are available for accessing the report?
Pricing options include single-user, multi-user, and enterprise licenses priced at USD 3350.00, USD 5025.00, and USD 6700.00 respectively.
10. Is the market size provided in terms of value or volume?
The market size is provided in terms of value, measured in million and volume, measured in K.
11. Are there any specific market keywords associated with the report?
Yes, the market keyword associated with the report is "Military UGV Product," which aids in identifying and referencing the specific market segment covered.
12. How do I determine which pricing option suits my needs best?
The pricing options vary based on user requirements and access needs. Individual users may opt for single-user licenses, while businesses requiring broader access may choose multi-user or enterprise licenses for cost-effective access to the report.
13. Are there any additional resources or data provided in the Military UGV Product report?
While the report offers comprehensive insights, it's advisable to review the specific contents or supplementary materials provided to ascertain if additional resources or data are available.
14. How can I stay updated on further developments or reports in the Military UGV Product?
To stay informed about further developments, trends, and reports in the Military UGV Product, consider subscribing to industry newsletters, following relevant companies and organizations, or regularly checking reputable industry news sources and publications.
Methodology
Step 1 - Identification of Relevant Samples Size from Population Database


Step 2 - Approaches for Defining Global Market Size (Value, Volume* & Price*)

Note*: In applicable scenarios
Step 3 - Data Sources
Primary Research
- Web Analytics
- Survey Reports
- Research Institute
- Latest Research Reports
- Opinion Leaders
Secondary Research
- Annual Reports
- White Paper
- Latest Press Release
- Industry Association
- Paid Database
- Investor Presentations

Step 4 - Data Triangulation
Involves using different sources of information in order to increase the validity of a study
These sources are likely to be stakeholders in a program - participants, other researchers, program staff, other community members, and so on.
Then we put all data in single framework & apply various statistical tools to find out the dynamic on the market.
During the analysis stage, feedback from the stakeholder groups would be compared to determine areas of agreement as well as areas of divergence
