

Key Insights
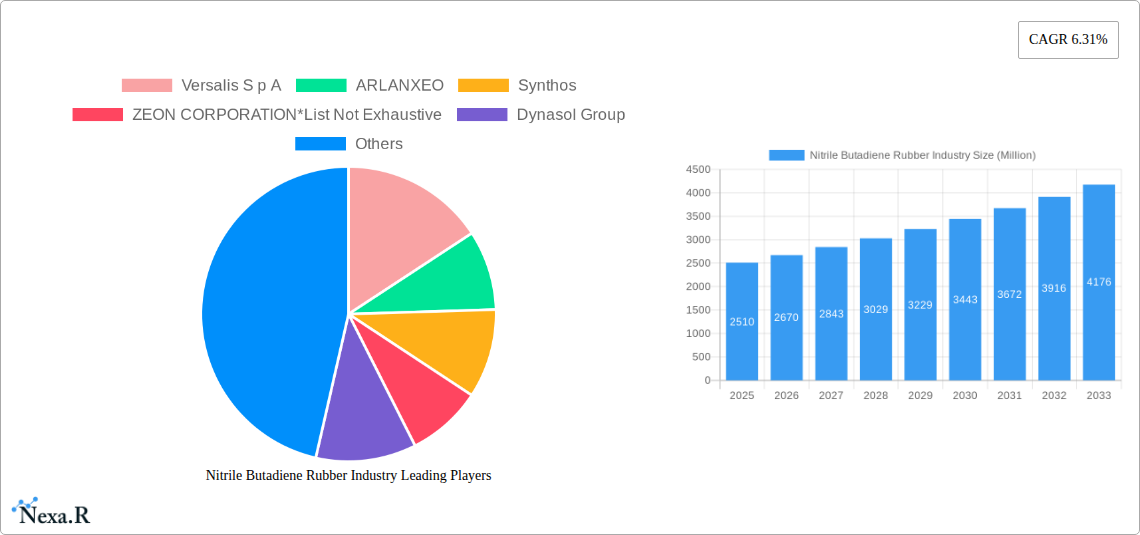
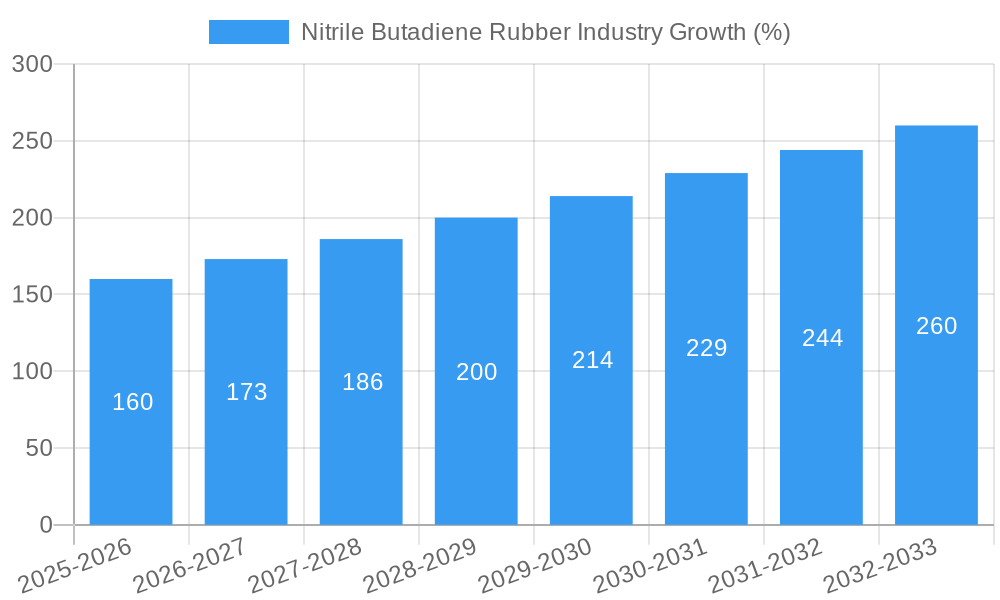
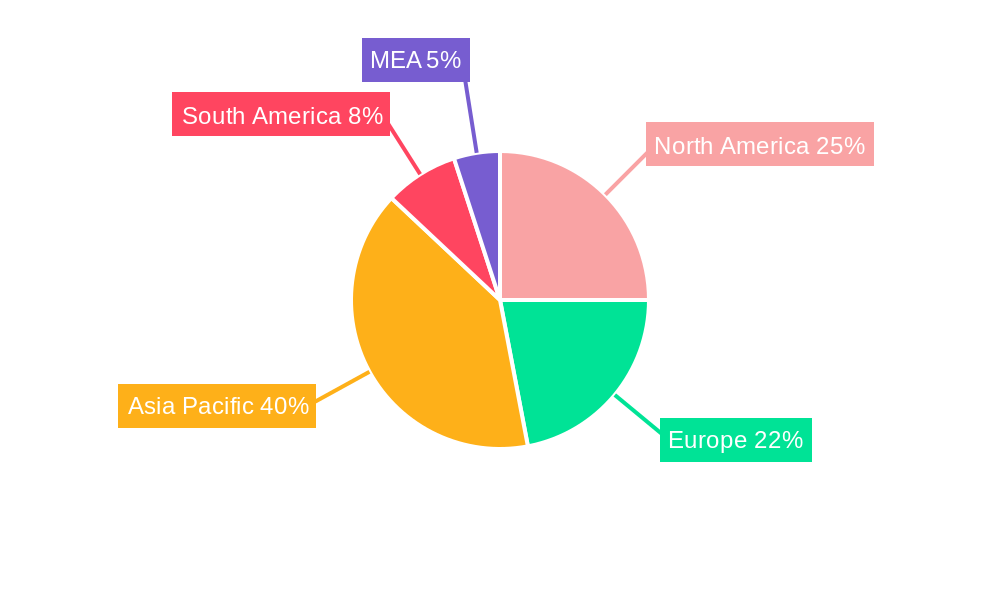
The Nitrile Butadiene Rubber (NBR) market, valued at $2.51 billion in 2025, is projected to experience robust growth, driven by its versatile properties and expanding applications across diverse sectors. A Compound Annual Growth Rate (CAGR) of 6.31% from 2025 to 2033 indicates a significant market expansion, reaching an estimated $4.2 billion by 2033. Key drivers include the burgeoning automotive and construction industries, increasing demand for durable and chemical-resistant materials in various applications like adhesives, sealants, and hoses. The rising adoption of NBR in the medical sector, propelled by its biocompatibility and resistance to various fluids, further fuels market growth. Growth is expected to be particularly strong in the Asia-Pacific region, driven by rapid industrialization and infrastructure development in countries like China and India. However, fluctuations in raw material prices and the emergence of competing elastomers could pose challenges to sustained market expansion. Segmentation analysis reveals significant contributions from the automotive and transportation, building and construction, and industrial sectors. Major players like Versalis, ARLANXEO, and others are strategically focusing on product innovation and geographical expansion to capitalize on this growth.
The NBR market's future trajectory is shaped by several trends. Sustainable manufacturing practices and the increasing demand for eco-friendly materials are pushing manufacturers to adopt more sustainable production methods. Advancements in NBR technology, leading to improved performance characteristics such as enhanced oil resistance and temperature stability, are attracting new applications. Furthermore, the growing focus on enhancing the safety and performance of products in critical sectors like aerospace and medical devices is boosting the demand for high-performance NBR. While challenges exist in managing raw material costs and competition, the overall outlook for the NBR market remains positive, supported by consistent growth across diverse industries and regions. Strategic partnerships, acquisitions, and technological advancements will be key factors in shaping the competitive landscape in the coming years.
Nitrile Butadiene Rubber (NBR) Industry Market Report: 2019-2033
This comprehensive report provides a detailed analysis of the Nitrile Butadiene Rubber (NBR) industry, encompassing market dynamics, growth trends, regional performance, product landscape, key players, and future outlook. With a study period spanning 2019-2033, a base year of 2025, and a forecast period of 2025-2033, this report offers invaluable insights for industry professionals, investors, and strategic decision-makers. The report analyzes the parent market of synthetic rubber and the child market of specialty elastomers, providing a complete understanding of the NBR industry's position and potential.
Nitrile Butadiene Rubber Industry Market Dynamics & Structure
The global Nitrile Butadiene Rubber (NBR) market is characterized by moderate concentration, with several major players holding significant market share. Technological innovation, primarily focusing on improved performance characteristics like oil resistance and temperature stability, is a key driver. Stringent regulatory frameworks concerning chemical safety and environmental impact influence production and application. Competition from alternative elastomers, such as silicone rubber and ethylene propylene diene monomer (EPDM) rubber, is a significant factor. End-user demographics are diverse, spanning various sectors, with automotive, medical, and industrial applications dominating. The M&A landscape shows a moderate level of activity, with strategic alliances and acquisitions shaping the competitive dynamics.
- Market Concentration: Moderately concentrated, with top 10 players holding approximately xx% market share (2024).
- Technological Innovation: Focus on enhanced oil resistance, temperature tolerance, and improved processing characteristics.
- Regulatory Framework: Compliance with REACH, RoHS, and other environmental regulations crucial.
- Competitive Substitutes: Silicone rubber, EPDM rubber, and other specialty elastomers pose competition.
- End-User Demographics: Diverse, with strong presence in automotive, medical, and industrial sectors.
- M&A Activity: Moderate level of mergers and acquisitions, driving consolidation and expansion.
Nitrile Butadiene Rubber Industry Growth Trends & Insights
The NBR market exhibited a CAGR of xx% during the historical period (2019-2024) and is projected to grow at a CAGR of xx% during the forecast period (2025-2033), reaching a market size of xx Million units by 2033. This growth is driven by increasing demand from key end-user industries, particularly the automotive and medical sectors. Technological advancements resulting in higher-performance NBR grades are further fueling market expansion. Consumer preference for durable and reliable products contributes to sustained demand. The adoption rate of NBR in various applications continues to increase, particularly in high-value applications requiring superior performance characteristics. Disruptive technologies, such as additive manufacturing, are expected to open new avenues for NBR applications.
Dominant Regions, Countries, or Segments in Nitrile Butadiene Rubber Industry
The Asia-Pacific region dominates the NBR market, driven by robust industrial growth, expanding automotive sector, and increasing medical device production. China and Japan are key contributors to this regional dominance. Within application segments, Gloves and Automotive and Transportation show the highest growth rates, reflecting the increasing demand for medical and automotive products.
- Key Drivers: Rapid industrialization, growing automotive sector, rising disposable incomes, and increasing healthcare expenditure.
- Dominance Factors: High manufacturing capacity, relatively low production costs, and a large consumer base.
- Growth Potential: Significant untapped potential in emerging economies, driven by infrastructure development and increased manufacturing activity. The Medical segment shows exceptional promise due to strict hygiene requirements.
Nitrile Butadiene Rubber Industry Product Landscape
NBR is offered in various grades, customized to meet specific application requirements. Innovations focus on enhancing properties like oil and chemical resistance, heat stability, and tensile strength. Advanced compounding techniques and the incorporation of fillers improve performance characteristics, leading to a wider range of applications. Unique selling propositions include improved durability, resilience, and cost-effectiveness compared to alternative materials.
Key Drivers, Barriers & Challenges in Nitrile Butadiene Rubber Industry
Key Drivers: Increasing demand from automotive and medical sectors; growth in construction and industrial applications; advancements in NBR technology leading to improved properties and cost reduction.
Key Challenges: Fluctuations in raw material prices; stringent environmental regulations; competition from alternative elastomers; supply chain disruptions; potential impact of economic downturns on demand.
Emerging Opportunities in Nitrile Butadiene Rubber Industry
Untapped markets in developing countries; expanding applications in renewable energy sectors; development of specialized NBR grades for niche applications; growth in the use of NBR in additive manufacturing; exploration of sustainable NBR production methods.
Growth Accelerators in the Nitrile Butadiene Rubber Industry Industry
Technological advancements, such as improved compounding techniques and the development of high-performance grades, are accelerating growth. Strategic partnerships and collaborations among industry players are fostering innovation and market expansion. Investments in research and development are driving the creation of new NBR-based products and applications, contributing to long-term growth.
Key Players Shaping the Nitrile Butadiene Rubber Industry Market
- Versalis S.p.A
- ARLANXEO
- Synthos
- ZEON CORPORATION
- Dynasol Group
- ENEOS Materials Corporation
- KUMHO PETROCHEMICAL
- SIBUR
- Synthomer PLC
- LG Chem
- China Petrochemical Corporation (Sinopec)
- Apcotex
- Lanxess
- TSRC
Notable Milestones in Nitrile Butadiene Rubber Industry Sector
- August 2022: Kumho Petrochemical announced a KRW 6,000 billion (~USD 5.10 billion) investment plan over five years, including KRW 3,300 billion (~USD 2.81 billion) for core business areas like NB latex and SSBR manufacturing. This significant investment signals confidence in the NBR market's future growth and indicates expansion plans.
In-Depth Nitrile Butadiene Rubber Industry Market Outlook
The NBR market is poised for sustained growth, driven by technological advancements, expanding end-user industries, and strategic investments by key players. Future market potential is substantial, with significant opportunities in emerging economies and niche applications. Strategic partnerships and innovative product development will be crucial for companies seeking to capture a larger market share. The industry is expected to witness further consolidation through mergers and acquisitions, shaping the competitive landscape in the coming years.
Nitrile Butadiene Rubber Industry Segmentation
-
1. Application
- 1.1. Adhesives and Sealants
- 1.2. Belts and Cables
- 1.3. Gloves
- 1.4. Hoses
- 1.5. Gaskets and O-Rings
- 1.6. Other Applications (Consumer Goods)
-
2. End-user Industry
- 2.1. Automotive and Transportation
- 2.2. Building and Construction
- 2.3. Industrial
- 2.4. Medical
- 2.5. Other End-user Industries (Oil and Gas, Aerospace)
Nitrile Butadiene Rubber Industry Segmentation By Geography
-
1. Asia Pacific
- 1.1. China
- 1.2. India
- 1.3. Japan
- 1.4. South Korea
- 1.5. Malaysia
- 1.6. Thailand
- 1.7. Vietnam
- 1.8. Indonesia
- 1.9. Rest of Asia Pacific
-
2. North America
- 2.1. United States
- 2.2. Canada
- 2.3. Mexico
-
3. Europe
- 3.1. Germany
- 3.2. United Kingdom
- 3.3. Italy
- 3.4. France
- 3.5. Spain
- 3.6. Turkey
- 3.7. Russia
- 3.8. NORDIC
- 3.9. Rest of Europe
-
4. South America
- 4.1. Brazil
- 4.2. Argentina
- 4.3. Colombia
- 4.4. Rest of South America
-
5. Middle East and Africa
- 5.1. Saudi Arabia
- 5.2. South Africa
- 5.3. Nigeria
- 5.4. Egypt
- 5.5. Qatar
- 5.6. UAE
- 5.7. Rest of Middle East and Africa
Nitrile Butadiene Rubber Industry REPORT HIGHLIGHTS
| Aspects | Details |
|---|---|
| Study Period | 2019-2033 |
| Base Year | 2024 |
| Estimated Year | 2025 |
| Forecast Period | 2025-2033 |
| Historical Period | 2019-2024 |
| Growth Rate | CAGR of 6.31% from 2019-2033 |
| Segmentation |
|
Table of Contents
- 1. Introduction
- 1.1. Research Scope
- 1.2. Market Segmentation
- 1.3. Research Methodology
- 1.4. Definitions and Assumptions
- 2. Executive Summary
- 2.1. Introduction
- 3. Market Dynamics
- 3.1. Introduction
- 3.2. Market Drivers
- 3.2.1. Expanding Automotive Industry; Industrial and Infrastructure Development Projects
- 3.3. Market Restrains
- 3.3.1. Availability of Substitute Materials; Fluctuating Raw Material Prices
- 3.4. Market Trends
- 3.4.1. Automotive and Transportation Sector Dominates the Market
- 4. Market Factor Analysis
- 4.1. Porters Five Forces
- 4.2. Supply/Value Chain
- 4.3. PESTEL analysis
- 4.4. Market Entropy
- 4.5. Patent/Trademark Analysis
- 5. Global Nitrile Butadiene Rubber Industry Analysis, Insights and Forecast, 2019-2031
- 5.1. Market Analysis, Insights and Forecast - by Application
- 5.1.1. Adhesives and Sealants
- 5.1.2. Belts and Cables
- 5.1.3. Gloves
- 5.1.4. Hoses
- 5.1.5. Gaskets and O-Rings
- 5.1.6. Other Applications (Consumer Goods)
- 5.2. Market Analysis, Insights and Forecast - by End-user Industry
- 5.2.1. Automotive and Transportation
- 5.2.2. Building and Construction
- 5.2.3. Industrial
- 5.2.4. Medical
- 5.2.5. Other End-user Industries (Oil and Gas, Aerospace)
- 5.3. Market Analysis, Insights and Forecast - by Region
- 5.3.1. Asia Pacific
- 5.3.2. North America
- 5.3.3. Europe
- 5.3.4. South America
- 5.3.5. Middle East and Africa
- 5.1. Market Analysis, Insights and Forecast - by Application
- 6. Asia Pacific Nitrile Butadiene Rubber Industry Analysis, Insights and Forecast, 2019-2031
- 6.1. Market Analysis, Insights and Forecast - by Application
- 6.1.1. Adhesives and Sealants
- 6.1.2. Belts and Cables
- 6.1.3. Gloves
- 6.1.4. Hoses
- 6.1.5. Gaskets and O-Rings
- 6.1.6. Other Applications (Consumer Goods)
- 6.2. Market Analysis, Insights and Forecast - by End-user Industry
- 6.2.1. Automotive and Transportation
- 6.2.2. Building and Construction
- 6.2.3. Industrial
- 6.2.4. Medical
- 6.2.5. Other End-user Industries (Oil and Gas, Aerospace)
- 6.1. Market Analysis, Insights and Forecast - by Application
- 7. North America Nitrile Butadiene Rubber Industry Analysis, Insights and Forecast, 2019-2031
- 7.1. Market Analysis, Insights and Forecast - by Application
- 7.1.1. Adhesives and Sealants
- 7.1.2. Belts and Cables
- 7.1.3. Gloves
- 7.1.4. Hoses
- 7.1.5. Gaskets and O-Rings
- 7.1.6. Other Applications (Consumer Goods)
- 7.2. Market Analysis, Insights and Forecast - by End-user Industry
- 7.2.1. Automotive and Transportation
- 7.2.2. Building and Construction
- 7.2.3. Industrial
- 7.2.4. Medical
- 7.2.5. Other End-user Industries (Oil and Gas, Aerospace)
- 7.1. Market Analysis, Insights and Forecast - by Application
- 8. Europe Nitrile Butadiene Rubber Industry Analysis, Insights and Forecast, 2019-2031
- 8.1. Market Analysis, Insights and Forecast - by Application
- 8.1.1. Adhesives and Sealants
- 8.1.2. Belts and Cables
- 8.1.3. Gloves
- 8.1.4. Hoses
- 8.1.5. Gaskets and O-Rings
- 8.1.6. Other Applications (Consumer Goods)
- 8.2. Market Analysis, Insights and Forecast - by End-user Industry
- 8.2.1. Automotive and Transportation
- 8.2.2. Building and Construction
- 8.2.3. Industrial
- 8.2.4. Medical
- 8.2.5. Other End-user Industries (Oil and Gas, Aerospace)
- 8.1. Market Analysis, Insights and Forecast - by Application
- 9. South America Nitrile Butadiene Rubber Industry Analysis, Insights and Forecast, 2019-2031
- 9.1. Market Analysis, Insights and Forecast - by Application
- 9.1.1. Adhesives and Sealants
- 9.1.2. Belts and Cables
- 9.1.3. Gloves
- 9.1.4. Hoses
- 9.1.5. Gaskets and O-Rings
- 9.1.6. Other Applications (Consumer Goods)
- 9.2. Market Analysis, Insights and Forecast - by End-user Industry
- 9.2.1. Automotive and Transportation
- 9.2.2. Building and Construction
- 9.2.3. Industrial
- 9.2.4. Medical
- 9.2.5. Other End-user Industries (Oil and Gas, Aerospace)
- 9.1. Market Analysis, Insights and Forecast - by Application
- 10. Middle East and Africa Nitrile Butadiene Rubber Industry Analysis, Insights and Forecast, 2019-2031
- 10.1. Market Analysis, Insights and Forecast - by Application
- 10.1.1. Adhesives and Sealants
- 10.1.2. Belts and Cables
- 10.1.3. Gloves
- 10.1.4. Hoses
- 10.1.5. Gaskets and O-Rings
- 10.1.6. Other Applications (Consumer Goods)
- 10.2. Market Analysis, Insights and Forecast - by End-user Industry
- 10.2.1. Automotive and Transportation
- 10.2.2. Building and Construction
- 10.2.3. Industrial
- 10.2.4. Medical
- 10.2.5. Other End-user Industries (Oil and Gas, Aerospace)
- 10.1. Market Analysis, Insights and Forecast - by Application
- 11. North America Nitrile Butadiene Rubber Industry Analysis, Insights and Forecast, 2019-2031
- 11.1. Market Analysis, Insights and Forecast - By Country/Sub-region
- 11.1.1 United States
- 11.1.2 Canada
- 11.1.3 Mexico
- 12. Europe Nitrile Butadiene Rubber Industry Analysis, Insights and Forecast, 2019-2031
- 12.1. Market Analysis, Insights and Forecast - By Country/Sub-region
- 12.1.1 Germany
- 12.1.2 France
- 12.1.3 Italy
- 12.1.4 United Kingdom
- 12.1.5 Netherlands
- 12.1.6 Rest of Europe
- 13. Asia Pacific Nitrile Butadiene Rubber Industry Analysis, Insights and Forecast, 2019-2031
- 13.1. Market Analysis, Insights and Forecast - By Country/Sub-region
- 13.1.1 China
- 13.1.2 Japan
- 13.1.3 India
- 13.1.4 South Korea
- 13.1.5 Taiwan
- 13.1.6 Australia
- 13.1.7 Rest of Asia-Pacific
- 14. South America Nitrile Butadiene Rubber Industry Analysis, Insights and Forecast, 2019-2031
- 14.1. Market Analysis, Insights and Forecast - By Country/Sub-region
- 14.1.1 Brazil
- 14.1.2 Argentina
- 14.1.3 Rest of South America
- 15. MEA Nitrile Butadiene Rubber Industry Analysis, Insights and Forecast, 2019-2031
- 15.1. Market Analysis, Insights and Forecast - By Country/Sub-region
- 15.1.1 Middle East
- 15.1.2 Africa
- 16. Competitive Analysis
- 16.1. Global Market Share Analysis 2024
- 16.2. Company Profiles
- 16.2.1 Versalis S p A
- 16.2.1.1. Overview
- 16.2.1.2. Products
- 16.2.1.3. SWOT Analysis
- 16.2.1.4. Recent Developments
- 16.2.1.5. Financials (Based on Availability)
- 16.2.2 ARLANXEO
- 16.2.2.1. Overview
- 16.2.2.2. Products
- 16.2.2.3. SWOT Analysis
- 16.2.2.4. Recent Developments
- 16.2.2.5. Financials (Based on Availability)
- 16.2.3 Synthos
- 16.2.3.1. Overview
- 16.2.3.2. Products
- 16.2.3.3. SWOT Analysis
- 16.2.3.4. Recent Developments
- 16.2.3.5. Financials (Based on Availability)
- 16.2.4 ZEON CORPORATION*List Not Exhaustive
- 16.2.4.1. Overview
- 16.2.4.2. Products
- 16.2.4.3. SWOT Analysis
- 16.2.4.4. Recent Developments
- 16.2.4.5. Financials (Based on Availability)
- 16.2.5 Dynasol Group
- 16.2.5.1. Overview
- 16.2.5.2. Products
- 16.2.5.3. SWOT Analysis
- 16.2.5.4. Recent Developments
- 16.2.5.5. Financials (Based on Availability)
- 16.2.6 ENEOS Materials Corporation
- 16.2.6.1. Overview
- 16.2.6.2. Products
- 16.2.6.3. SWOT Analysis
- 16.2.6.4. Recent Developments
- 16.2.6.5. Financials (Based on Availability)
- 16.2.7 KUMHO PETROCHEMICAL
- 16.2.7.1. Overview
- 16.2.7.2. Products
- 16.2.7.3. SWOT Analysis
- 16.2.7.4. Recent Developments
- 16.2.7.5. Financials (Based on Availability)
- 16.2.8 SIBUR
- 16.2.8.1. Overview
- 16.2.8.2. Products
- 16.2.8.3. SWOT Analysis
- 16.2.8.4. Recent Developments
- 16.2.8.5. Financials (Based on Availability)
- 16.2.9 Synthomer PLC
- 16.2.9.1. Overview
- 16.2.9.2. Products
- 16.2.9.3. SWOT Analysis
- 16.2.9.4. Recent Developments
- 16.2.9.5. Financials (Based on Availability)
- 16.2.10 LG Chem
- 16.2.10.1. Overview
- 16.2.10.2. Products
- 16.2.10.3. SWOT Analysis
- 16.2.10.4. Recent Developments
- 16.2.10.5. Financials (Based on Availability)
- 16.2.11 China Petrochemical Corporation (Sinopec)
- 16.2.11.1. Overview
- 16.2.11.2. Products
- 16.2.11.3. SWOT Analysis
- 16.2.11.4. Recent Developments
- 16.2.11.5. Financials (Based on Availability)
- 16.2.12 Apcotex
- 16.2.12.1. Overview
- 16.2.12.2. Products
- 16.2.12.3. SWOT Analysis
- 16.2.12.4. Recent Developments
- 16.2.12.5. Financials (Based on Availability)
- 16.2.13 Lanxess
- 16.2.13.1. Overview
- 16.2.13.2. Products
- 16.2.13.3. SWOT Analysis
- 16.2.13.4. Recent Developments
- 16.2.13.5. Financials (Based on Availability)
- 16.2.14 TSRC
- 16.2.14.1. Overview
- 16.2.14.2. Products
- 16.2.14.3. SWOT Analysis
- 16.2.14.4. Recent Developments
- 16.2.14.5. Financials (Based on Availability)
- 16.2.1 Versalis S p A
List of Figures
- Figure 1: Global Nitrile Butadiene Rubber Industry Revenue Breakdown (Million, %) by Region 2024 & 2032
- Figure 2: Global Nitrile Butadiene Rubber Industry Volume Breakdown (K Tons, %) by Region 2024 & 2032
- Figure 3: North America Nitrile Butadiene Rubber Industry Revenue (Million), by Country 2024 & 2032
- Figure 4: North America Nitrile Butadiene Rubber Industry Volume (K Tons), by Country 2024 & 2032
- Figure 5: North America Nitrile Butadiene Rubber Industry Revenue Share (%), by Country 2024 & 2032
- Figure 6: North America Nitrile Butadiene Rubber Industry Volume Share (%), by Country 2024 & 2032
- Figure 7: Europe Nitrile Butadiene Rubber Industry Revenue (Million), by Country 2024 & 2032
- Figure 8: Europe Nitrile Butadiene Rubber Industry Volume (K Tons), by Country 2024 & 2032
- Figure 9: Europe Nitrile Butadiene Rubber Industry Revenue Share (%), by Country 2024 & 2032
- Figure 10: Europe Nitrile Butadiene Rubber Industry Volume Share (%), by Country 2024 & 2032
- Figure 11: Asia Pacific Nitrile Butadiene Rubber Industry Revenue (Million), by Country 2024 & 2032
- Figure 12: Asia Pacific Nitrile Butadiene Rubber Industry Volume (K Tons), by Country 2024 & 2032
- Figure 13: Asia Pacific Nitrile Butadiene Rubber Industry Revenue Share (%), by Country 2024 & 2032
- Figure 14: Asia Pacific Nitrile Butadiene Rubber Industry Volume Share (%), by Country 2024 & 2032
- Figure 15: South America Nitrile Butadiene Rubber Industry Revenue (Million), by Country 2024 & 2032
- Figure 16: South America Nitrile Butadiene Rubber Industry Volume (K Tons), by Country 2024 & 2032
- Figure 17: South America Nitrile Butadiene Rubber Industry Revenue Share (%), by Country 2024 & 2032
- Figure 18: South America Nitrile Butadiene Rubber Industry Volume Share (%), by Country 2024 & 2032
- Figure 19: MEA Nitrile Butadiene Rubber Industry Revenue (Million), by Country 2024 & 2032
- Figure 20: MEA Nitrile Butadiene Rubber Industry Volume (K Tons), by Country 2024 & 2032
- Figure 21: MEA Nitrile Butadiene Rubber Industry Revenue Share (%), by Country 2024 & 2032
- Figure 22: MEA Nitrile Butadiene Rubber Industry Volume Share (%), by Country 2024 & 2032
- Figure 23: Asia Pacific Nitrile Butadiene Rubber Industry Revenue (Million), by Application 2024 & 2032
- Figure 24: Asia Pacific Nitrile Butadiene Rubber Industry Volume (K Tons), by Application 2024 & 2032
- Figure 25: Asia Pacific Nitrile Butadiene Rubber Industry Revenue Share (%), by Application 2024 & 2032
- Figure 26: Asia Pacific Nitrile Butadiene Rubber Industry Volume Share (%), by Application 2024 & 2032
- Figure 27: Asia Pacific Nitrile Butadiene Rubber Industry Revenue (Million), by End-user Industry 2024 & 2032
- Figure 28: Asia Pacific Nitrile Butadiene Rubber Industry Volume (K Tons), by End-user Industry 2024 & 2032
- Figure 29: Asia Pacific Nitrile Butadiene Rubber Industry Revenue Share (%), by End-user Industry 2024 & 2032
- Figure 30: Asia Pacific Nitrile Butadiene Rubber Industry Volume Share (%), by End-user Industry 2024 & 2032
- Figure 31: Asia Pacific Nitrile Butadiene Rubber Industry Revenue (Million), by Country 2024 & 2032
- Figure 32: Asia Pacific Nitrile Butadiene Rubber Industry Volume (K Tons), by Country 2024 & 2032
- Figure 33: Asia Pacific Nitrile Butadiene Rubber Industry Revenue Share (%), by Country 2024 & 2032
- Figure 34: Asia Pacific Nitrile Butadiene Rubber Industry Volume Share (%), by Country 2024 & 2032
- Figure 35: North America Nitrile Butadiene Rubber Industry Revenue (Million), by Application 2024 & 2032
- Figure 36: North America Nitrile Butadiene Rubber Industry Volume (K Tons), by Application 2024 & 2032
- Figure 37: North America Nitrile Butadiene Rubber Industry Revenue Share (%), by Application 2024 & 2032
- Figure 38: North America Nitrile Butadiene Rubber Industry Volume Share (%), by Application 2024 & 2032
- Figure 39: North America Nitrile Butadiene Rubber Industry Revenue (Million), by End-user Industry 2024 & 2032
- Figure 40: North America Nitrile Butadiene Rubber Industry Volume (K Tons), by End-user Industry 2024 & 2032
- Figure 41: North America Nitrile Butadiene Rubber Industry Revenue Share (%), by End-user Industry 2024 & 2032
- Figure 42: North America Nitrile Butadiene Rubber Industry Volume Share (%), by End-user Industry 2024 & 2032
- Figure 43: North America Nitrile Butadiene Rubber Industry Revenue (Million), by Country 2024 & 2032
- Figure 44: North America Nitrile Butadiene Rubber Industry Volume (K Tons), by Country 2024 & 2032
- Figure 45: North America Nitrile Butadiene Rubber Industry Revenue Share (%), by Country 2024 & 2032
- Figure 46: North America Nitrile Butadiene Rubber Industry Volume Share (%), by Country 2024 & 2032
- Figure 47: Europe Nitrile Butadiene Rubber Industry Revenue (Million), by Application 2024 & 2032
- Figure 48: Europe Nitrile Butadiene Rubber Industry Volume (K Tons), by Application 2024 & 2032
- Figure 49: Europe Nitrile Butadiene Rubber Industry Revenue Share (%), by Application 2024 & 2032
- Figure 50: Europe Nitrile Butadiene Rubber Industry Volume Share (%), by Application 2024 & 2032
- Figure 51: Europe Nitrile Butadiene Rubber Industry Revenue (Million), by End-user Industry 2024 & 2032
- Figure 52: Europe Nitrile Butadiene Rubber Industry Volume (K Tons), by End-user Industry 2024 & 2032
- Figure 53: Europe Nitrile Butadiene Rubber Industry Revenue Share (%), by End-user Industry 2024 & 2032
- Figure 54: Europe Nitrile Butadiene Rubber Industry Volume Share (%), by End-user Industry 2024 & 2032
- Figure 55: Europe Nitrile Butadiene Rubber Industry Revenue (Million), by Country 2024 & 2032
- Figure 56: Europe Nitrile Butadiene Rubber Industry Volume (K Tons), by Country 2024 & 2032
- Figure 57: Europe Nitrile Butadiene Rubber Industry Revenue Share (%), by Country 2024 & 2032
- Figure 58: Europe Nitrile Butadiene Rubber Industry Volume Share (%), by Country 2024 & 2032
- Figure 59: South America Nitrile Butadiene Rubber Industry Revenue (Million), by Application 2024 & 2032
- Figure 60: South America Nitrile Butadiene Rubber Industry Volume (K Tons), by Application 2024 & 2032
- Figure 61: South America Nitrile Butadiene Rubber Industry Revenue Share (%), by Application 2024 & 2032
- Figure 62: South America Nitrile Butadiene Rubber Industry Volume Share (%), by Application 2024 & 2032
- Figure 63: South America Nitrile Butadiene Rubber Industry Revenue (Million), by End-user Industry 2024 & 2032
- Figure 64: South America Nitrile Butadiene Rubber Industry Volume (K Tons), by End-user Industry 2024 & 2032
- Figure 65: South America Nitrile Butadiene Rubber Industry Revenue Share (%), by End-user Industry 2024 & 2032
- Figure 66: South America Nitrile Butadiene Rubber Industry Volume Share (%), by End-user Industry 2024 & 2032
- Figure 67: South America Nitrile Butadiene Rubber Industry Revenue (Million), by Country 2024 & 2032
- Figure 68: South America Nitrile Butadiene Rubber Industry Volume (K Tons), by Country 2024 & 2032
- Figure 69: South America Nitrile Butadiene Rubber Industry Revenue Share (%), by Country 2024 & 2032
- Figure 70: South America Nitrile Butadiene Rubber Industry Volume Share (%), by Country 2024 & 2032
- Figure 71: Middle East and Africa Nitrile Butadiene Rubber Industry Revenue (Million), by Application 2024 & 2032
- Figure 72: Middle East and Africa Nitrile Butadiene Rubber Industry Volume (K Tons), by Application 2024 & 2032
- Figure 73: Middle East and Africa Nitrile Butadiene Rubber Industry Revenue Share (%), by Application 2024 & 2032
- Figure 74: Middle East and Africa Nitrile Butadiene Rubber Industry Volume Share (%), by Application 2024 & 2032
- Figure 75: Middle East and Africa Nitrile Butadiene Rubber Industry Revenue (Million), by End-user Industry 2024 & 2032
- Figure 76: Middle East and Africa Nitrile Butadiene Rubber Industry Volume (K Tons), by End-user Industry 2024 & 2032
- Figure 77: Middle East and Africa Nitrile Butadiene Rubber Industry Revenue Share (%), by End-user Industry 2024 & 2032
- Figure 78: Middle East and Africa Nitrile Butadiene Rubber Industry Volume Share (%), by End-user Industry 2024 & 2032
- Figure 79: Middle East and Africa Nitrile Butadiene Rubber Industry Revenue (Million), by Country 2024 & 2032
- Figure 80: Middle East and Africa Nitrile Butadiene Rubber Industry Volume (K Tons), by Country 2024 & 2032
- Figure 81: Middle East and Africa Nitrile Butadiene Rubber Industry Revenue Share (%), by Country 2024 & 2032
- Figure 82: Middle East and Africa Nitrile Butadiene Rubber Industry Volume Share (%), by Country 2024 & 2032
List of Tables
- Table 1: Global Nitrile Butadiene Rubber Industry Revenue Million Forecast, by Region 2019 & 2032
- Table 2: Global Nitrile Butadiene Rubber Industry Volume K Tons Forecast, by Region 2019 & 2032
- Table 3: Global Nitrile Butadiene Rubber Industry Revenue Million Forecast, by Application 2019 & 2032
- Table 4: Global Nitrile Butadiene Rubber Industry Volume K Tons Forecast, by Application 2019 & 2032
- Table 5: Global Nitrile Butadiene Rubber Industry Revenue Million Forecast, by End-user Industry 2019 & 2032
- Table 6: Global Nitrile Butadiene Rubber Industry Volume K Tons Forecast, by End-user Industry 2019 & 2032
- Table 7: Global Nitrile Butadiene Rubber Industry Revenue Million Forecast, by Region 2019 & 2032
- Table 8: Global Nitrile Butadiene Rubber Industry Volume K Tons Forecast, by Region 2019 & 2032
- Table 9: Global Nitrile Butadiene Rubber Industry Revenue Million Forecast, by Country 2019 & 2032
- Table 10: Global Nitrile Butadiene Rubber Industry Volume K Tons Forecast, by Country 2019 & 2032
- Table 11: United States Nitrile Butadiene Rubber Industry Revenue (Million) Forecast, by Application 2019 & 2032
- Table 12: United States Nitrile Butadiene Rubber Industry Volume (K Tons) Forecast, by Application 2019 & 2032
- Table 13: Canada Nitrile Butadiene Rubber Industry Revenue (Million) Forecast, by Application 2019 & 2032
- Table 14: Canada Nitrile Butadiene Rubber Industry Volume (K Tons) Forecast, by Application 2019 & 2032
- Table 15: Mexico Nitrile Butadiene Rubber Industry Revenue (Million) Forecast, by Application 2019 & 2032
- Table 16: Mexico Nitrile Butadiene Rubber Industry Volume (K Tons) Forecast, by Application 2019 & 2032
- Table 17: Global Nitrile Butadiene Rubber Industry Revenue Million Forecast, by Country 2019 & 2032
- Table 18: Global Nitrile Butadiene Rubber Industry Volume K Tons Forecast, by Country 2019 & 2032
- Table 19: Germany Nitrile Butadiene Rubber Industry Revenue (Million) Forecast, by Application 2019 & 2032
- Table 20: Germany Nitrile Butadiene Rubber Industry Volume (K Tons) Forecast, by Application 2019 & 2032
- Table 21: France Nitrile Butadiene Rubber Industry Revenue (Million) Forecast, by Application 2019 & 2032
- Table 22: France Nitrile Butadiene Rubber Industry Volume (K Tons) Forecast, by Application 2019 & 2032
- Table 23: Italy Nitrile Butadiene Rubber Industry Revenue (Million) Forecast, by Application 2019 & 2032
- Table 24: Italy Nitrile Butadiene Rubber Industry Volume (K Tons) Forecast, by Application 2019 & 2032
- Table 25: United Kingdom Nitrile Butadiene Rubber Industry Revenue (Million) Forecast, by Application 2019 & 2032
- Table 26: United Kingdom Nitrile Butadiene Rubber Industry Volume (K Tons) Forecast, by Application 2019 & 2032
- Table 27: Netherlands Nitrile Butadiene Rubber Industry Revenue (Million) Forecast, by Application 2019 & 2032
- Table 28: Netherlands Nitrile Butadiene Rubber Industry Volume (K Tons) Forecast, by Application 2019 & 2032
- Table 29: Rest of Europe Nitrile Butadiene Rubber Industry Revenue (Million) Forecast, by Application 2019 & 2032
- Table 30: Rest of Europe Nitrile Butadiene Rubber Industry Volume (K Tons) Forecast, by Application 2019 & 2032
- Table 31: Global Nitrile Butadiene Rubber Industry Revenue Million Forecast, by Country 2019 & 2032
- Table 32: Global Nitrile Butadiene Rubber Industry Volume K Tons Forecast, by Country 2019 & 2032
- Table 33: China Nitrile Butadiene Rubber Industry Revenue (Million) Forecast, by Application 2019 & 2032
- Table 34: China Nitrile Butadiene Rubber Industry Volume (K Tons) Forecast, by Application 2019 & 2032
- Table 35: Japan Nitrile Butadiene Rubber Industry Revenue (Million) Forecast, by Application 2019 & 2032
- Table 36: Japan Nitrile Butadiene Rubber Industry Volume (K Tons) Forecast, by Application 2019 & 2032
- Table 37: India Nitrile Butadiene Rubber Industry Revenue (Million) Forecast, by Application 2019 & 2032
- Table 38: India Nitrile Butadiene Rubber Industry Volume (K Tons) Forecast, by Application 2019 & 2032
- Table 39: South Korea Nitrile Butadiene Rubber Industry Revenue (Million) Forecast, by Application 2019 & 2032
- Table 40: South Korea Nitrile Butadiene Rubber Industry Volume (K Tons) Forecast, by Application 2019 & 2032
- Table 41: Taiwan Nitrile Butadiene Rubber Industry Revenue (Million) Forecast, by Application 2019 & 2032
- Table 42: Taiwan Nitrile Butadiene Rubber Industry Volume (K Tons) Forecast, by Application 2019 & 2032
- Table 43: Australia Nitrile Butadiene Rubber Industry Revenue (Million) Forecast, by Application 2019 & 2032
- Table 44: Australia Nitrile Butadiene Rubber Industry Volume (K Tons) Forecast, by Application 2019 & 2032
- Table 45: Rest of Asia-Pacific Nitrile Butadiene Rubber Industry Revenue (Million) Forecast, by Application 2019 & 2032
- Table 46: Rest of Asia-Pacific Nitrile Butadiene Rubber Industry Volume (K Tons) Forecast, by Application 2019 & 2032
- Table 47: Global Nitrile Butadiene Rubber Industry Revenue Million Forecast, by Country 2019 & 2032
- Table 48: Global Nitrile Butadiene Rubber Industry Volume K Tons Forecast, by Country 2019 & 2032
- Table 49: Brazil Nitrile Butadiene Rubber Industry Revenue (Million) Forecast, by Application 2019 & 2032
- Table 50: Brazil Nitrile Butadiene Rubber Industry Volume (K Tons) Forecast, by Application 2019 & 2032
- Table 51: Argentina Nitrile Butadiene Rubber Industry Revenue (Million) Forecast, by Application 2019 & 2032
- Table 52: Argentina Nitrile Butadiene Rubber Industry Volume (K Tons) Forecast, by Application 2019 & 2032
- Table 53: Rest of South America Nitrile Butadiene Rubber Industry Revenue (Million) Forecast, by Application 2019 & 2032
- Table 54: Rest of South America Nitrile Butadiene Rubber Industry Volume (K Tons) Forecast, by Application 2019 & 2032
- Table 55: Global Nitrile Butadiene Rubber Industry Revenue Million Forecast, by Country 2019 & 2032
- Table 56: Global Nitrile Butadiene Rubber Industry Volume K Tons Forecast, by Country 2019 & 2032
- Table 57: Middle East Nitrile Butadiene Rubber Industry Revenue (Million) Forecast, by Application 2019 & 2032
- Table 58: Middle East Nitrile Butadiene Rubber Industry Volume (K Tons) Forecast, by Application 2019 & 2032
- Table 59: Africa Nitrile Butadiene Rubber Industry Revenue (Million) Forecast, by Application 2019 & 2032
- Table 60: Africa Nitrile Butadiene Rubber Industry Volume (K Tons) Forecast, by Application 2019 & 2032
- Table 61: Global Nitrile Butadiene Rubber Industry Revenue Million Forecast, by Application 2019 & 2032
- Table 62: Global Nitrile Butadiene Rubber Industry Volume K Tons Forecast, by Application 2019 & 2032
- Table 63: Global Nitrile Butadiene Rubber Industry Revenue Million Forecast, by End-user Industry 2019 & 2032
- Table 64: Global Nitrile Butadiene Rubber Industry Volume K Tons Forecast, by End-user Industry 2019 & 2032
- Table 65: Global Nitrile Butadiene Rubber Industry Revenue Million Forecast, by Country 2019 & 2032
- Table 66: Global Nitrile Butadiene Rubber Industry Volume K Tons Forecast, by Country 2019 & 2032
- Table 67: China Nitrile Butadiene Rubber Industry Revenue (Million) Forecast, by Application 2019 & 2032
- Table 68: China Nitrile Butadiene Rubber Industry Volume (K Tons) Forecast, by Application 2019 & 2032
- Table 69: India Nitrile Butadiene Rubber Industry Revenue (Million) Forecast, by Application 2019 & 2032
- Table 70: India Nitrile Butadiene Rubber Industry Volume (K Tons) Forecast, by Application 2019 & 2032
- Table 71: Japan Nitrile Butadiene Rubber Industry Revenue (Million) Forecast, by Application 2019 & 2032
- Table 72: Japan Nitrile Butadiene Rubber Industry Volume (K Tons) Forecast, by Application 2019 & 2032
- Table 73: South Korea Nitrile Butadiene Rubber Industry Revenue (Million) Forecast, by Application 2019 & 2032
- Table 74: South Korea Nitrile Butadiene Rubber Industry Volume (K Tons) Forecast, by Application 2019 & 2032
- Table 75: Malaysia Nitrile Butadiene Rubber Industry Revenue (Million) Forecast, by Application 2019 & 2032
- Table 76: Malaysia Nitrile Butadiene Rubber Industry Volume (K Tons) Forecast, by Application 2019 & 2032
- Table 77: Thailand Nitrile Butadiene Rubber Industry Revenue (Million) Forecast, by Application 2019 & 2032
- Table 78: Thailand Nitrile Butadiene Rubber Industry Volume (K Tons) Forecast, by Application 2019 & 2032
- Table 79: Vietnam Nitrile Butadiene Rubber Industry Revenue (Million) Forecast, by Application 2019 & 2032
- Table 80: Vietnam Nitrile Butadiene Rubber Industry Volume (K Tons) Forecast, by Application 2019 & 2032
- Table 81: Indonesia Nitrile Butadiene Rubber Industry Revenue (Million) Forecast, by Application 2019 & 2032
- Table 82: Indonesia Nitrile Butadiene Rubber Industry Volume (K Tons) Forecast, by Application 2019 & 2032
- Table 83: Rest of Asia Pacific Nitrile Butadiene Rubber Industry Revenue (Million) Forecast, by Application 2019 & 2032
- Table 84: Rest of Asia Pacific Nitrile Butadiene Rubber Industry Volume (K Tons) Forecast, by Application 2019 & 2032
- Table 85: Global Nitrile Butadiene Rubber Industry Revenue Million Forecast, by Application 2019 & 2032
- Table 86: Global Nitrile Butadiene Rubber Industry Volume K Tons Forecast, by Application 2019 & 2032
- Table 87: Global Nitrile Butadiene Rubber Industry Revenue Million Forecast, by End-user Industry 2019 & 2032
- Table 88: Global Nitrile Butadiene Rubber Industry Volume K Tons Forecast, by End-user Industry 2019 & 2032
- Table 89: Global Nitrile Butadiene Rubber Industry Revenue Million Forecast, by Country 2019 & 2032
- Table 90: Global Nitrile Butadiene Rubber Industry Volume K Tons Forecast, by Country 2019 & 2032
- Table 91: United States Nitrile Butadiene Rubber Industry Revenue (Million) Forecast, by Application 2019 & 2032
- Table 92: United States Nitrile Butadiene Rubber Industry Volume (K Tons) Forecast, by Application 2019 & 2032
- Table 93: Canada Nitrile Butadiene Rubber Industry Revenue (Million) Forecast, by Application 2019 & 2032
- Table 94: Canada Nitrile Butadiene Rubber Industry Volume (K Tons) Forecast, by Application 2019 & 2032
- Table 95: Mexico Nitrile Butadiene Rubber Industry Revenue (Million) Forecast, by Application 2019 & 2032
- Table 96: Mexico Nitrile Butadiene Rubber Industry Volume (K Tons) Forecast, by Application 2019 & 2032
- Table 97: Global Nitrile Butadiene Rubber Industry Revenue Million Forecast, by Application 2019 & 2032
- Table 98: Global Nitrile Butadiene Rubber Industry Volume K Tons Forecast, by Application 2019 & 2032
- Table 99: Global Nitrile Butadiene Rubber Industry Revenue Million Forecast, by End-user Industry 2019 & 2032
- Table 100: Global Nitrile Butadiene Rubber Industry Volume K Tons Forecast, by End-user Industry 2019 & 2032
- Table 101: Global Nitrile Butadiene Rubber Industry Revenue Million Forecast, by Country 2019 & 2032
- Table 102: Global Nitrile Butadiene Rubber Industry Volume K Tons Forecast, by Country 2019 & 2032
- Table 103: Germany Nitrile Butadiene Rubber Industry Revenue (Million) Forecast, by Application 2019 & 2032
- Table 104: Germany Nitrile Butadiene Rubber Industry Volume (K Tons) Forecast, by Application 2019 & 2032
- Table 105: United Kingdom Nitrile Butadiene Rubber Industry Revenue (Million) Forecast, by Application 2019 & 2032
- Table 106: United Kingdom Nitrile Butadiene Rubber Industry Volume (K Tons) Forecast, by Application 2019 & 2032
- Table 107: Italy Nitrile Butadiene Rubber Industry Revenue (Million) Forecast, by Application 2019 & 2032
- Table 108: Italy Nitrile Butadiene Rubber Industry Volume (K Tons) Forecast, by Application 2019 & 2032
- Table 109: France Nitrile Butadiene Rubber Industry Revenue (Million) Forecast, by Application 2019 & 2032
- Table 110: France Nitrile Butadiene Rubber Industry Volume (K Tons) Forecast, by Application 2019 & 2032
- Table 111: Spain Nitrile Butadiene Rubber Industry Revenue (Million) Forecast, by Application 2019 & 2032
- Table 112: Spain Nitrile Butadiene Rubber Industry Volume (K Tons) Forecast, by Application 2019 & 2032
- Table 113: Turkey Nitrile Butadiene Rubber Industry Revenue (Million) Forecast, by Application 2019 & 2032
- Table 114: Turkey Nitrile Butadiene Rubber Industry Volume (K Tons) Forecast, by Application 2019 & 2032
- Table 115: Russia Nitrile Butadiene Rubber Industry Revenue (Million) Forecast, by Application 2019 & 2032
- Table 116: Russia Nitrile Butadiene Rubber Industry Volume (K Tons) Forecast, by Application 2019 & 2032
- Table 117: NORDIC Nitrile Butadiene Rubber Industry Revenue (Million) Forecast, by Application 2019 & 2032
- Table 118: NORDIC Nitrile Butadiene Rubber Industry Volume (K Tons) Forecast, by Application 2019 & 2032
- Table 119: Rest of Europe Nitrile Butadiene Rubber Industry Revenue (Million) Forecast, by Application 2019 & 2032
- Table 120: Rest of Europe Nitrile Butadiene Rubber Industry Volume (K Tons) Forecast, by Application 2019 & 2032
- Table 121: Global Nitrile Butadiene Rubber Industry Revenue Million Forecast, by Application 2019 & 2032
- Table 122: Global Nitrile Butadiene Rubber Industry Volume K Tons Forecast, by Application 2019 & 2032
- Table 123: Global Nitrile Butadiene Rubber Industry Revenue Million Forecast, by End-user Industry 2019 & 2032
- Table 124: Global Nitrile Butadiene Rubber Industry Volume K Tons Forecast, by End-user Industry 2019 & 2032
- Table 125: Global Nitrile Butadiene Rubber Industry Revenue Million Forecast, by Country 2019 & 2032
- Table 126: Global Nitrile Butadiene Rubber Industry Volume K Tons Forecast, by Country 2019 & 2032
- Table 127: Brazil Nitrile Butadiene Rubber Industry Revenue (Million) Forecast, by Application 2019 & 2032
- Table 128: Brazil Nitrile Butadiene Rubber Industry Volume (K Tons) Forecast, by Application 2019 & 2032
- Table 129: Argentina Nitrile Butadiene Rubber Industry Revenue (Million) Forecast, by Application 2019 & 2032
- Table 130: Argentina Nitrile Butadiene Rubber Industry Volume (K Tons) Forecast, by Application 2019 & 2032
- Table 131: Colombia Nitrile Butadiene Rubber Industry Revenue (Million) Forecast, by Application 2019 & 2032
- Table 132: Colombia Nitrile Butadiene Rubber Industry Volume (K Tons) Forecast, by Application 2019 & 2032
- Table 133: Rest of South America Nitrile Butadiene Rubber Industry Revenue (Million) Forecast, by Application 2019 & 2032
- Table 134: Rest of South America Nitrile Butadiene Rubber Industry Volume (K Tons) Forecast, by Application 2019 & 2032
- Table 135: Global Nitrile Butadiene Rubber Industry Revenue Million Forecast, by Application 2019 & 2032
- Table 136: Global Nitrile Butadiene Rubber Industry Volume K Tons Forecast, by Application 2019 & 2032
- Table 137: Global Nitrile Butadiene Rubber Industry Revenue Million Forecast, by End-user Industry 2019 & 2032
- Table 138: Global Nitrile Butadiene Rubber Industry Volume K Tons Forecast, by End-user Industry 2019 & 2032
- Table 139: Global Nitrile Butadiene Rubber Industry Revenue Million Forecast, by Country 2019 & 2032
- Table 140: Global Nitrile Butadiene Rubber Industry Volume K Tons Forecast, by Country 2019 & 2032
- Table 141: Saudi Arabia Nitrile Butadiene Rubber Industry Revenue (Million) Forecast, by Application 2019 & 2032
- Table 142: Saudi Arabia Nitrile Butadiene Rubber Industry Volume (K Tons) Forecast, by Application 2019 & 2032
- Table 143: South Africa Nitrile Butadiene Rubber Industry Revenue (Million) Forecast, by Application 2019 & 2032
- Table 144: South Africa Nitrile Butadiene Rubber Industry Volume (K Tons) Forecast, by Application 2019 & 2032
- Table 145: Nigeria Nitrile Butadiene Rubber Industry Revenue (Million) Forecast, by Application 2019 & 2032
- Table 146: Nigeria Nitrile Butadiene Rubber Industry Volume (K Tons) Forecast, by Application 2019 & 2032
- Table 147: Egypt Nitrile Butadiene Rubber Industry Revenue (Million) Forecast, by Application 2019 & 2032
- Table 148: Egypt Nitrile Butadiene Rubber Industry Volume (K Tons) Forecast, by Application 2019 & 2032
- Table 149: Qatar Nitrile Butadiene Rubber Industry Revenue (Million) Forecast, by Application 2019 & 2032
- Table 150: Qatar Nitrile Butadiene Rubber Industry Volume (K Tons) Forecast, by Application 2019 & 2032
- Table 151: UAE Nitrile Butadiene Rubber Industry Revenue (Million) Forecast, by Application 2019 & 2032
- Table 152: UAE Nitrile Butadiene Rubber Industry Volume (K Tons) Forecast, by Application 2019 & 2032
- Table 153: Rest of Middle East and Africa Nitrile Butadiene Rubber Industry Revenue (Million) Forecast, by Application 2019 & 2032
- Table 154: Rest of Middle East and Africa Nitrile Butadiene Rubber Industry Volume (K Tons) Forecast, by Application 2019 & 2032
Frequently Asked Questions
1. What is the projected Compound Annual Growth Rate (CAGR) of the Nitrile Butadiene Rubber Industry?
The projected CAGR is approximately 6.31%.
2. Which companies are prominent players in the Nitrile Butadiene Rubber Industry?
Key companies in the market include Versalis S p A, ARLANXEO, Synthos, ZEON CORPORATION*List Not Exhaustive, Dynasol Group, ENEOS Materials Corporation, KUMHO PETROCHEMICAL, SIBUR, Synthomer PLC, LG Chem, China Petrochemical Corporation (Sinopec), Apcotex, Lanxess, TSRC.
3. What are the main segments of the Nitrile Butadiene Rubber Industry?
The market segments include Application, End-user Industry.
4. Can you provide details about the market size?
The market size is estimated to be USD 2.51 Million as of 2022.
5. What are some drivers contributing to market growth?
Expanding Automotive Industry; Industrial and Infrastructure Development Projects.
6. What are the notable trends driving market growth?
Automotive and Transportation Sector Dominates the Market.
7. Are there any restraints impacting market growth?
Availability of Substitute Materials; Fluctuating Raw Material Prices.
8. Can you provide examples of recent developments in the market?
August 2022: Kumho Petrochemical will be KRW6,000 billion (~USD 5.10 billion) into existing and new businesses in the next five years. As part of the initiative, Kumho will invest KRW 3,300 billion (~USD 2.81 billion) in its core business areas, which include nitrile butadiene latex (NB latex) production and styrene solution butadiene rubber (SSBR) manufacturing.
9. What pricing options are available for accessing the report?
Pricing options include single-user, multi-user, and enterprise licenses priced at USD 4750, USD 5250, and USD 8750 respectively.
10. Is the market size provided in terms of value or volume?
The market size is provided in terms of value, measured in Million and volume, measured in K Tons.
11. Are there any specific market keywords associated with the report?
Yes, the market keyword associated with the report is "Nitrile Butadiene Rubber Industry," which aids in identifying and referencing the specific market segment covered.
12. How do I determine which pricing option suits my needs best?
The pricing options vary based on user requirements and access needs. Individual users may opt for single-user licenses, while businesses requiring broader access may choose multi-user or enterprise licenses for cost-effective access to the report.
13. Are there any additional resources or data provided in the Nitrile Butadiene Rubber Industry report?
While the report offers comprehensive insights, it's advisable to review the specific contents or supplementary materials provided to ascertain if additional resources or data are available.
14. How can I stay updated on further developments or reports in the Nitrile Butadiene Rubber Industry?
To stay informed about further developments, trends, and reports in the Nitrile Butadiene Rubber Industry, consider subscribing to industry newsletters, following relevant companies and organizations, or regularly checking reputable industry news sources and publications.
Methodology
Step 1 - Identification of Relevant Samples Size from Population Database


Step 2 - Approaches for Defining Global Market Size (Value, Volume* & Price*)

Note*: In applicable scenarios
Step 3 - Data Sources
Primary Research
- Web Analytics
- Survey Reports
- Research Institute
- Latest Research Reports
- Opinion Leaders
Secondary Research
- Annual Reports
- White Paper
- Latest Press Release
- Industry Association
- Paid Database
- Investor Presentations

Step 4 - Data Triangulation
Involves using different sources of information in order to increase the validity of a study
These sources are likely to be stakeholders in a program - participants, other researchers, program staff, other community members, and so on.
Then we put all data in single framework & apply various statistical tools to find out the dynamic on the market.
During the analysis stage, feedback from the stakeholder groups would be compared to determine areas of agreement as well as areas of divergence
