

Key Insights
The North American printed signage market, a dynamic sector including billboards, backlit displays, and banners, demonstrates steady growth potential. While historical CAGR was 0.00, this indicated a period of adjustment to digital signage's influence. Current analysis forecasts moderate, consistent expansion driven by the enduring need for physical branding across retail, BFSI, and other industries, alongside the adoption of advanced materials and printing technologies. The market is segmented by product type, placement (indoor/outdoor), and end-user vertical. Billboards remain dominant in outdoor advertising, while point-of-sale displays are crucial in retail. The United States leads the market due to its robust retail infrastructure and advertising expenditure, with Canada and Mexico contributing substantial shares. Competition spans global corporations and specialized regional businesses.
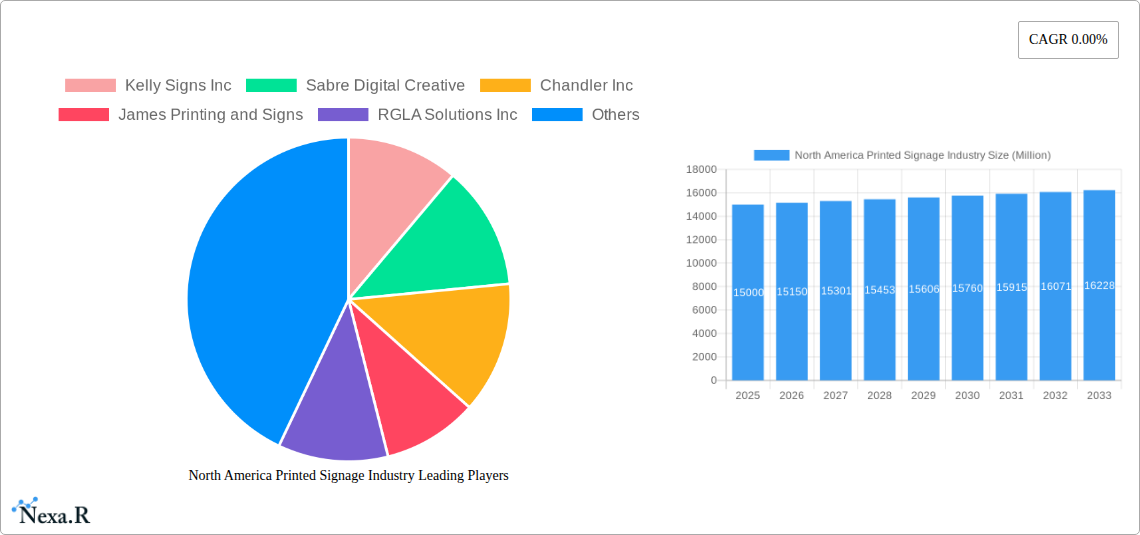
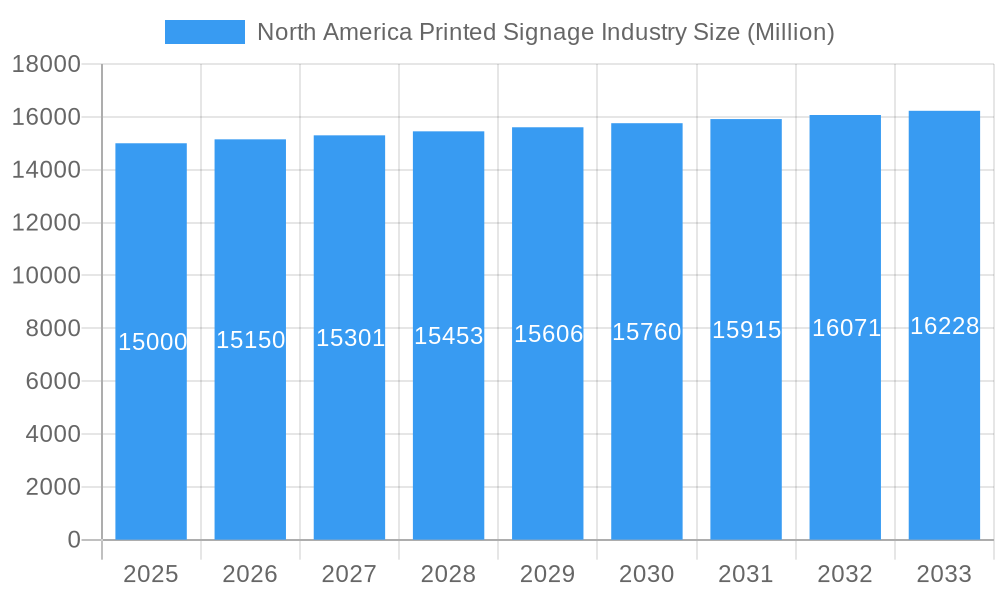
North America Printed Signage Industry Market Size (In Billion)
Key growth catalysts include the post-pandemic revival of in-person experiences, boosting demand for impactful physical branding. Technological innovations, particularly sustainable materials and high-resolution printing, will further propel market expansion. The primary restraint is the ongoing proliferation of digital advertising and its potential impact on marketing budgets. However, the complementary relationship between digital and physical signage, often used in a multi-channel strategy, mitigates this concern. Future trends point towards personalized, digitally integrated signage solutions, ensuring continued market evolution. The forecast period of 2025-2033 presents significant opportunities for market participants who adapt to evolving consumer demands and technological shifts, projecting a market size of 41.86 billion with a CAGR of 2.01.
North America Printed Signage Industry Company Market Share
North America Printed Signage Industry: A Comprehensive Market Report (2019-2033)
This in-depth report provides a comprehensive analysis of the North America printed signage industry, covering market dynamics, growth trends, key players, and future outlook. The study period spans from 2019 to 2033, with 2025 serving as the base and estimated year. The report segments the market by product (Billboard, Backlit Display, Pop Display, Banner, Flag, Backdrop, Corporate Graphics, Exhibition & Trade Show Material, Other Products), type (Indoor, Outdoor), end-user vertical (BFSI, Retail, Sports & Leisure, Entertainment, Transportation & Logistics, Healthcare, Others), and country (United States, Canada). The market size is presented in million units.
Keywords: North America Printed Signage, Signage Industry, Printed Signage Market, Billboard Advertising, Indoor Signage, Outdoor Signage, Retail Signage, Pop Displays, Banner Printing, Trade Show Displays, Market Analysis, Market Research, Market Forecast, Industry Trends, Kelly Signs Inc, Sabre Digital Creative, Chandler Inc, James Printing and Signs, RGLA Solutions Inc, Accel Group Inc, Vistaprint, AJ Printing & Graphics Inc, Avery Dennison Corporation, Southwest Printing Co.
North America Printed Signage Industry Market Dynamics & Structure
The North American printed signage market is characterized by moderate concentration, with several large players and numerous smaller regional businesses. Technological innovation, particularly in digital printing and LED displays, is a significant driver, alongside evolving regulatory frameworks concerning outdoor advertising and sustainability. Competitive substitutes include digital signage and online advertising. The end-user demographics are diverse, reflecting the widespread use of signage across various industries. M&A activity has been moderate, with larger companies seeking to expand their market share and product offerings.
- Market Concentration: Moderately concentrated, with a few dominant players and a large number of smaller companies. xx% market share held by the top 5 players (2025).
- Technological Innovation: Digital printing, LED technology, and sustainable materials are key innovation drivers.
- Regulatory Frameworks: Local and regional regulations on outdoor advertising significantly impact market growth.
- Competitive Substitutes: Digital signage, online advertising, and video displays pose competitive challenges.
- End-User Demographics: Diverse across various sectors, with retail, BFSI and transportation demonstrating significant demand.
- M&A Trends: Moderate M&A activity, driven by expansion and diversification strategies. xx M&A deals recorded in the period 2019-2024.
North America Printed Signage Industry Growth Trends & Insights
The North American printed signage market experienced [insert actual or predicted value] million units in 2024, with a projected CAGR of xx% from 2025 to 2033, reaching [insert actual or predicted value] million units by 2033. This growth is fueled by increased retail activity, expansion of the entertainment sector, and ongoing infrastructure development. The adoption rate of new technologies, such as eco-friendly printing methods and interactive displays, is steadily increasing. Consumer behavior shifts towards digital experiences are partially offset by a sustained need for physical branding and impactful in-person communication. The market penetration of digital printing technologies has reached xx% in 2025 and is projected to reach xx% by 2033, impacting traditional printing methods.
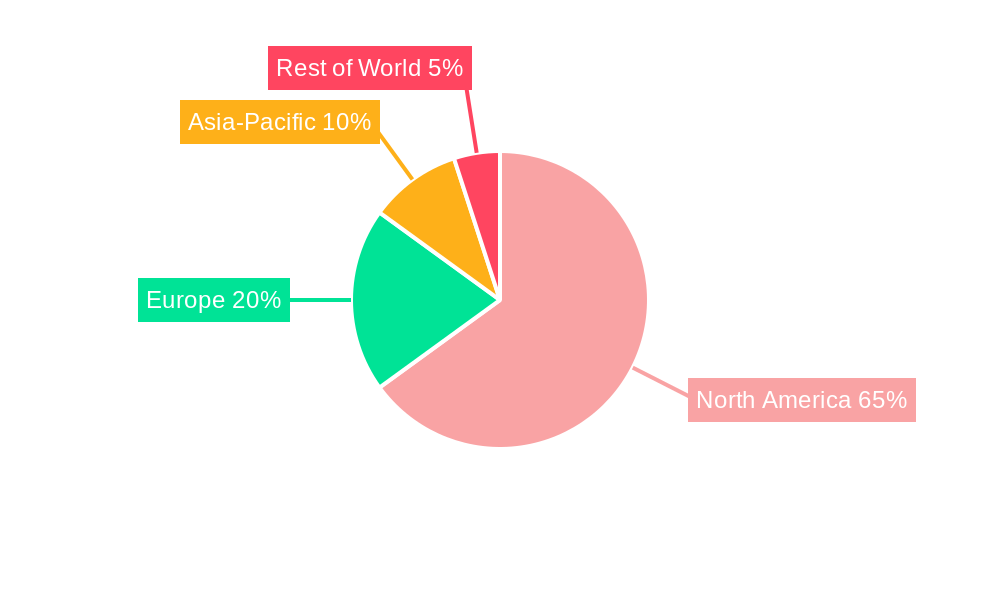
Dominant Regions, Countries, or Segments in North America Printed Signage Industry
The United States dominates the North American printed signage market, accounting for approximately xx% of the total market value in 2025. Within the product segment, billboards and retail signage displays are the largest revenue generators, followed by banners and trade show materials. The retail sector constitutes the largest end-user vertical, driven by the need for visually appealing point-of-sale (POS) materials and brand promotion.
- Key Drivers (United States): Robust retail sector, high advertising spending, developed infrastructure, and supportive government policies.
- Key Drivers (Canada): Growing tourism sector, expansion of retail chains, and increasing focus on brand visibility.
- Dominant Segments: Billboards (xx million units in 2025), Retail Signage (xx million units in 2025), and Indoor Signage (xx million units in 2025).
North America Printed Signage Industry Product Landscape
The printed signage industry offers a wide range of products, from traditional billboards and banners to sophisticated backlit displays and interactive signage. Innovations include the use of sustainable materials, advanced printing techniques, and integrated technologies like QR codes and NFC for enhanced customer engagement. Key selling propositions include durability, customization options, and effective brand communication. Advancements in digital printing deliver higher quality, faster turnaround times, and reduced costs.
Key Drivers, Barriers & Challenges in North America Printed Signage Industry
Key Drivers:
Increased marketing budgets across industries, growing focus on brand visibility, expanding retail landscape, development of new digital printing technologies and the rise of experiential marketing are primary drivers.
Key Challenges & Restraints:
The rising costs of raw materials, intense competition from digital signage alternatives, and environmental concerns regarding waste generation pose significant challenges. Supply chain disruptions, regulatory hurdles pertaining to outdoor advertising, and the need for continuous innovation represent further restraints. Competition from online advertising is estimated to impact the market by xx% by 2033.
Emerging Opportunities in North America Printed Signage Industry
Untapped markets include smaller businesses and community organizations, which increasingly require cost-effective and easily customizable signage solutions. The integration of AR/VR technology into signage displays presents significant opportunities, while growing demand for eco-friendly and sustainable signage materials is also an emerging trend. Personalized signage, utilizing data-driven approaches for targeted advertising, also offers strong potential.
Growth Accelerators in the North America Printed Signage Industry
Technological advancements such as improved printing techniques, lightweight and durable materials, and the integration of digital elements will continue to fuel growth. Strategic partnerships between signage companies and marketing agencies will foster innovation. Expansion into new markets, such as emerging technologies, experiential marketing campaigns, and sustainable solutions will unlock further potential.
Key Players Shaping the North America Printed Signage Industry Market
- Kelly Signs Inc
- Sabre Digital Creative
- Chandler Inc
- James Printing and Signs
- RGLA Solutions Inc
- Accel Group Inc
- Vistaprint
- AJ Printing & Graphics Inc
- Avery Dennison Corporation
- Southwest Printing Co
Notable Milestones in North America Printed Signage Industry Sector
- 2020: Increased adoption of digital printing technologies due to the pandemic's impact on traditional printing methods.
- 2021: Several key players invested in sustainable and eco-friendly signage materials.
- 2022: Launch of several innovative interactive signage solutions incorporating augmented reality features.
- 2023: Consolidation within the industry through mergers and acquisitions.
- 2024: Increased focus on data-driven signage solutions for personalized advertising.
In-Depth North America Printed Signage Industry Market Outlook
The future of the North American printed signage market appears positive, driven by continuous innovation, market expansion into new sectors, and rising demand for effective brand communication. Companies that embrace sustainable practices, integrate digital technologies, and focus on personalized solutions will likely experience significant growth. Strategic partnerships, expansion into emerging sectors, and a customer-centric approach will be crucial for success in the coming years.
North America Printed Signage Industry Segmentation
-
1. Product
- 1.1. Billboard
- 1.2. Backlit Display
- 1.3. Pop Display
- 1.4. Banner, Flag, and Backdrop
- 1.5. Corporat
- 1.6. Other Products
-
2. Type
- 2.1. Indoor Printed Signage
- 2.2. Outdoor Printed Signage
-
3. End-user Vertical
- 3.1. BFSI
- 3.2. Retail
- 3.3. Sports and Leisure
- 3.4. Entertainment
- 3.5. Transportation and Logistics
- 3.6. Healthcare
- 3.7. Other End-user Verticals
North America Printed Signage Industry Segmentation By Geography
-
1. North America
- 1.1. United States
- 1.2. Canada
- 1.3. Mexico
North America Printed Signage Industry Regional Market Share
Geographic Coverage of North America Printed Signage Industry
North America Printed Signage Industry REPORT HIGHLIGHTS
| Aspects | Details |
|---|---|
| Study Period | 2020-2034 |
| Base Year | 2025 |
| Estimated Year | 2026 |
| Forecast Period | 2026-2034 |
| Historical Period | 2020-2025 |
| Growth Rate | CAGR of 2.01% from 2020-2034 |
| Segmentation |
|
Table of Contents
- 1. Introduction
- 1.1. Research Scope
- 1.2. Market Segmentation
- 1.3. Research Objective
- 1.4. Definitions and Assumptions
- 2. Executive Summary
- 2.1. Market Snapshot
- 3. Market Dynamics
- 3.1. Market Drivers
- 3.2. Market Restrains
- 3.3. Market Trends
- 3.4. Market Opportunities
- 4. Market Factor Analysis
- 4.1. Porters Five Forces
- 4.1.1. Bargaining Power of Suppliers
- 4.1.2. Bargaining Power of Buyers
- 4.1.3. Threat of New Entrants
- 4.1.4. Threat of Substitutes
- 4.1.5. Competitive Rivalry
- 4.2. PESTEL analysis
- 4.3. BCG Analysis
- 4.3.1. Stars (High Growth, High Market Share)
- 4.3.2. Cash Cows (Low Growth, High Market Share)
- 4.3.3. Question Mark (High Growth, Low Market Share)
- 4.3.4. Dogs (Low Growth, Low Market Share)
- 4.4. Ansoff Matrix Analysis
- 4.5. Supply Chain Analysis
- 4.6. Regulatory Landscape
- 4.7. Current Market Potential and Opportunity Assessment (TAM–SAM–SOM Framework)
- 4.8. NRP Analyst Note
- 4.1. Porters Five Forces
- 5. Market Analysis, Insights and Forecast 2021-2033
- 5.1. Market Analysis, Insights and Forecast - by Product
- 5.1.1. Billboard
- 5.1.2. Backlit Display
- 5.1.3. Pop Display
- 5.1.4. Banner, Flag, and Backdrop
- 5.1.5. Corporat
- 5.1.6. Other Products
- 5.2. Market Analysis, Insights and Forecast - by Type
- 5.2.1. Indoor Printed Signage
- 5.2.2. Outdoor Printed Signage
- 5.3. Market Analysis, Insights and Forecast - by End-user Vertical
- 5.3.1. BFSI
- 5.3.2. Retail
- 5.3.3. Sports and Leisure
- 5.3.4. Entertainment
- 5.3.5. Transportation and Logistics
- 5.3.6. Healthcare
- 5.3.7. Other End-user Verticals
- 5.4. Market Analysis, Insights and Forecast - by Region
- 5.4.1. North America
- 5.1. Market Analysis, Insights and Forecast - by Product
- 6. North America Printed Signage Industry Analysis, Insights and Forecast, 2021-2033
- 6.1. Market Analysis, Insights and Forecast - by Product
- 6.1.1. Billboard
- 6.1.2. Backlit Display
- 6.1.3. Pop Display
- 6.1.4. Banner, Flag, and Backdrop
- 6.1.5. Corporat
- 6.1.6. Other Products
- 6.2. Market Analysis, Insights and Forecast - by Type
- 6.2.1. Indoor Printed Signage
- 6.2.2. Outdoor Printed Signage
- 6.3. Market Analysis, Insights and Forecast - by End-user Vertical
- 6.3.1. BFSI
- 6.3.2. Retail
- 6.3.3. Sports and Leisure
- 6.3.4. Entertainment
- 6.3.5. Transportation and Logistics
- 6.3.6. Healthcare
- 6.3.7. Other End-user Verticals
- 6.1. Market Analysis, Insights and Forecast - by Product
- 7. Competitive Analysis
- 7.1. Company Profiles
- 7.1.1 Kelly Signs Inc
- 7.1.1.1. Company Overview
- 7.1.1.2. Products
- 7.1.1.3. Company Financials
- 7.1.1.4. SWOT Analysis
- 7.1.2 Sabre Digital Creative
- 7.1.2.1. Company Overview
- 7.1.2.2. Products
- 7.1.2.3. Company Financials
- 7.1.2.4. SWOT Analysis
- 7.1.3 Chandler Inc
- 7.1.3.1. Company Overview
- 7.1.3.2. Products
- 7.1.3.3. Company Financials
- 7.1.3.4. SWOT Analysis
- 7.1.4 James Printing and Signs
- 7.1.4.1. Company Overview
- 7.1.4.2. Products
- 7.1.4.3. Company Financials
- 7.1.4.4. SWOT Analysis
- 7.1.5 RGLA Solutions Inc
- 7.1.5.1. Company Overview
- 7.1.5.2. Products
- 7.1.5.3. Company Financials
- 7.1.5.4. SWOT Analysis
- 7.1.6 Accel Group Inc
- 7.1.6.1. Company Overview
- 7.1.6.2. Products
- 7.1.6.3. Company Financials
- 7.1.6.4. SWOT Analysis
- 7.1.7 Vistaprint*List Not Exhaustive
- 7.1.7.1. Company Overview
- 7.1.7.2. Products
- 7.1.7.3. Company Financials
- 7.1.7.4. SWOT Analysis
- 7.1.8 AJ Printing & Graphics Inc
- 7.1.8.1. Company Overview
- 7.1.8.2. Products
- 7.1.8.3. Company Financials
- 7.1.8.4. SWOT Analysis
- 7.1.9 Avery Dennison Corporation
- 7.1.9.1. Company Overview
- 7.1.9.2. Products
- 7.1.9.3. Company Financials
- 7.1.9.4. SWOT Analysis
- 7.1.10 Southwest Printing Co
- 7.1.10.1. Company Overview
- 7.1.10.2. Products
- 7.1.10.3. Company Financials
- 7.1.10.4. SWOT Analysis
- 7.1.1 Kelly Signs Inc
- 7.2. Market Entropy
- 7.2.1 Company's Key Areas Served
- 7.2.2 Recent Developments
- 7.3. Company Market Share Analysis 2025
- 7.3.1 Top 5 Companies Market Share Analysis
- 7.3.2 Top 3 Companies Market Share Analysis
- 7.4. List of Potential Customers
- 8. Research Methodology
List of Figures
- Figure 1: North America Printed Signage Industry Revenue Breakdown (billion, %) by Product 2025 & 2033
- Figure 2: North America Printed Signage Industry Share (%) by Company 2025
List of Tables
- Table 1: North America Printed Signage Industry Revenue billion Forecast, by Product 2020 & 2033
- Table 2: North America Printed Signage Industry Revenue billion Forecast, by Type 2020 & 2033
- Table 3: North America Printed Signage Industry Revenue billion Forecast, by End-user Vertical 2020 & 2033
- Table 4: North America Printed Signage Industry Revenue billion Forecast, by Region 2020 & 2033
- Table 5: North America Printed Signage Industry Revenue billion Forecast, by Product 2020 & 2033
- Table 6: North America Printed Signage Industry Revenue billion Forecast, by Type 2020 & 2033
- Table 7: North America Printed Signage Industry Revenue billion Forecast, by End-user Vertical 2020 & 2033
- Table 8: North America Printed Signage Industry Revenue billion Forecast, by Country 2020 & 2033
- Table 9: United States North America Printed Signage Industry Revenue (billion) Forecast, by Application 2020 & 2033
- Table 10: Canada North America Printed Signage Industry Revenue (billion) Forecast, by Application 2020 & 2033
- Table 11: Mexico North America Printed Signage Industry Revenue (billion) Forecast, by Application 2020 & 2033
Frequently Asked Questions
1. What is the projected Compound Annual Growth Rate (CAGR) of the North America Printed Signage Industry?
The projected CAGR is approximately 2.01%.
2. Which companies are prominent players in the North America Printed Signage Industry?
Key companies in the market include Kelly Signs Inc, Sabre Digital Creative, Chandler Inc, James Printing and Signs, RGLA Solutions Inc, Accel Group Inc, Vistaprint*List Not Exhaustive, AJ Printing & Graphics Inc, Avery Dennison Corporation, Southwest Printing Co.
3. What are the main segments of the North America Printed Signage Industry?
The market segments include Product, Type, End-user Vertical.
4. Can you provide details about the market size?
The market size is estimated to be USD 41.86 billion as of 2022.
5. What are some drivers contributing to market growth?
; Cost Effectiveness of Printed Signage.
6. What are the notable trends driving market growth?
Corporate Graphics. Exhibition. and Trade Show Material to Witness Downfall.
7. Are there any restraints impacting market growth?
; Advent of Digital Signage; Drawbacks of Screen Printing.
8. Can you provide examples of recent developments in the market?
N/A
9. What pricing options are available for accessing the report?
Pricing options include single-user, multi-user, and enterprise licenses priced at USD 4750, USD 4950, and USD 6800 respectively.
10. Is the market size provided in terms of value or volume?
The market size is provided in terms of value, measured in billion.
11. Are there any specific market keywords associated with the report?
Yes, the market keyword associated with the report is "North America Printed Signage Industry," which aids in identifying and referencing the specific market segment covered.
12. How do I determine which pricing option suits my needs best?
The pricing options vary based on user requirements and access needs. Individual users may opt for single-user licenses, while businesses requiring broader access may choose multi-user or enterprise licenses for cost-effective access to the report.
13. Are there any additional resources or data provided in the North America Printed Signage Industry report?
While the report offers comprehensive insights, it's advisable to review the specific contents or supplementary materials provided to ascertain if additional resources or data are available.
14. How can I stay updated on further developments or reports in the North America Printed Signage Industry?
To stay informed about further developments, trends, and reports in the North America Printed Signage Industry, consider subscribing to industry newsletters, following relevant companies and organizations, or regularly checking reputable industry news sources and publications.
Methodology
Step 1 - Identification of Relevant Samples Size from Population Database


Step 2 - Approaches for Defining Global Market Size (Value, Volume* & Price*)

Note*: In applicable scenarios
Step 3 - Data Sources
Primary Research
- Web Analytics
- Survey Reports
- Research Institute
- Latest Research Reports
- Opinion Leaders
Secondary Research
- Annual Reports
- White Paper
- Latest Press Release
- Industry Association
- Paid Database
- Investor Presentations

Step 4 - Data Triangulation
Involves using different sources of information in order to increase the validity of a study
These sources are likely to be stakeholders in a program - participants, other researchers, program staff, other community members, and so on.
Then we put all data in single framework & apply various statistical tools to find out the dynamic on the market.
During the analysis stage, feedback from the stakeholder groups would be compared to determine areas of agreement as well as areas of divergence