

Key Insights
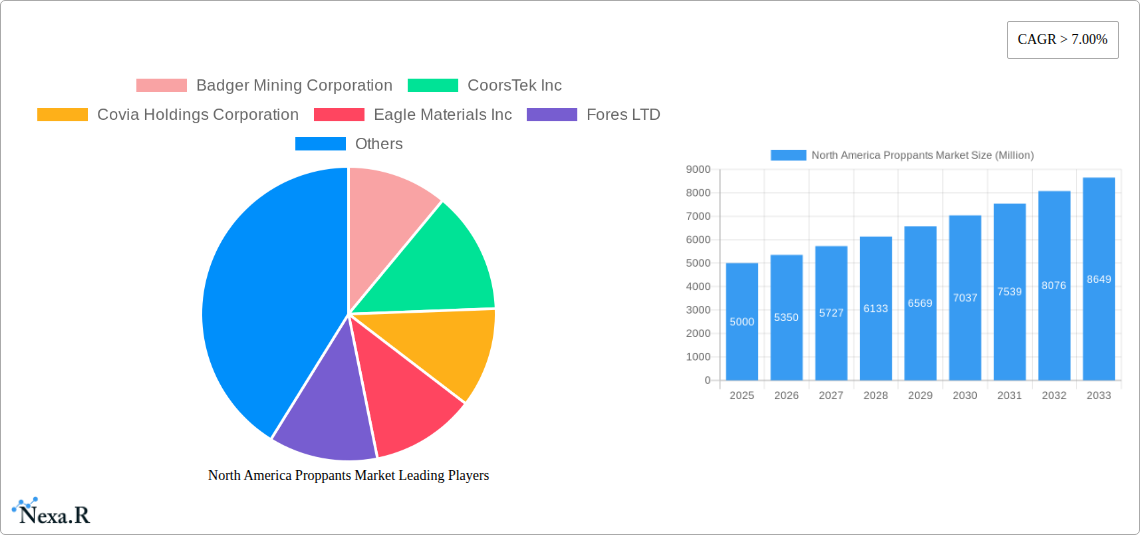
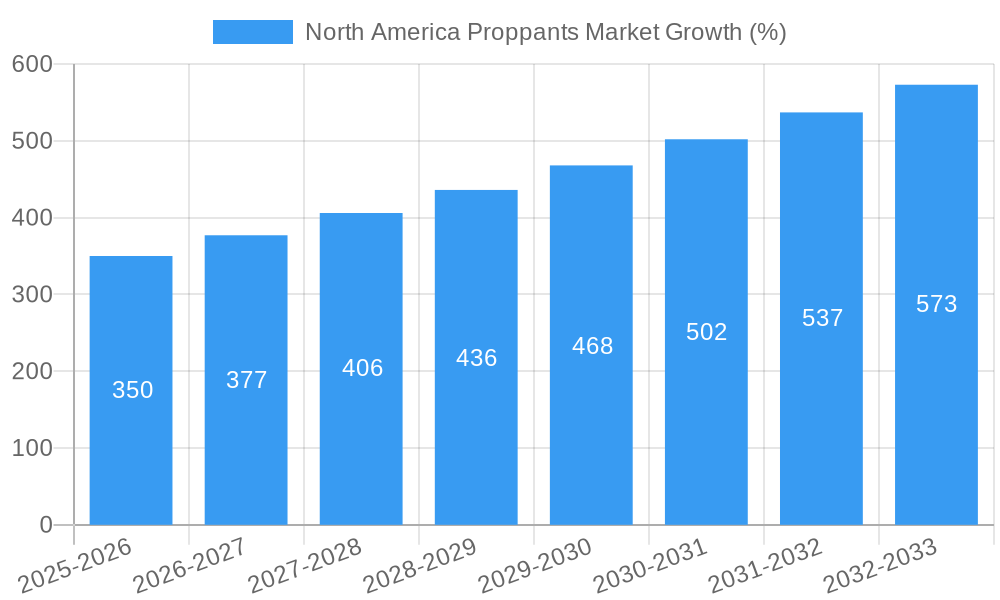
The North America proppants market is experiencing robust growth, fueled by a resurgence in oil and gas exploration and production activities. The market, valued at approximately $5 billion in 2025, is projected to maintain a Compound Annual Growth Rate (CAGR) exceeding 7% through 2033, reaching an estimated market size of over $9 billion. This expansion is driven primarily by the increasing demand for hydraulic fracturing ("fracking") in shale gas and tight oil formations, necessitating large volumes of proppants to enhance well productivity. Technological advancements in proppant manufacturing, leading to improved strength and performance characteristics, further contribute to market growth. While environmental concerns regarding fracking remain a persistent restraint, the ongoing need for energy security and the relatively low cost of proppants compared to other well completion technologies continue to support market expansion.
Significant market segmentation exists within the North America proppants market. Key players like Badger Mining Corporation, CoorsTek Inc, and others are actively involved, competing on factors such as proppant type (sand, ceramic), quality, and pricing. Regional variations in shale gas reserves and regulatory environments influence market dynamics across North America, with potentially higher growth rates in regions with significant shale gas production. The ongoing development of sustainable and environmentally friendly proppant alternatives could reshape the competitive landscape in the coming years, potentially leading to further market fragmentation and innovation. The forecast period, extending to 2033, anticipates continued growth driven by the aforementioned factors, although this may be subject to fluctuations based on global energy prices and government regulations.
North America Proppants Market Report: 2019-2033
This comprehensive report provides a detailed analysis of the North America proppants market, encompassing market dynamics, growth trends, regional dominance, product landscape, key players, and future outlook. The study period covers 2019-2033, with a base year of 2025 and a forecast period of 2025-2033. The report is essential for industry professionals, investors, and stakeholders seeking a deep understanding of this crucial segment of the oil and gas industry. The parent market is the North American Oil & Gas Industry, with the child market being Proppants (specifically focusing on frac sand and ceramic proppants). The market value is predicted to reach XX Million by 2033.
North America Proppants Market Dynamics & Structure
The North America proppants market is characterized by moderate concentration, with several major players vying for market share. Technological innovation, particularly in resin-coated proppants and enhanced proppant performance, is a key driver. Stringent environmental regulations and evolving safety standards influence market operations. The market also faces competition from alternative fracturing techniques. End-user demographics are primarily driven by the oil and gas industry's activity levels. M&A activity has been significant, with several consolidations and acquisitions aiming to enhance market position and expand product portfolios.
- Market Concentration: Moderately concentrated, with top 5 players holding approximately xx% market share in 2024.
- Technological Innovation: Focus on resin-coated proppants, higher strength materials, and improved conductivity.
- Regulatory Framework: Stringent environmental regulations and safety standards impacting production and transportation.
- Competitive Substitutes: Alternative fracturing techniques pose a competitive threat.
- End-User Demographics: Predominantly oil and gas exploration and production companies.
- M&A Trends: Consolidation of players through mergers and acquisitions to achieve economies of scale and expand market reach. Approximate xx M&A deals in the past 5 years.
North America Proppants Market Growth Trends & Insights
The North America proppants market has experienced fluctuating growth over the historical period (2019-2024), largely mirroring the ups and downs of oil and gas production. The market is expected to witness a CAGR of xx% during the forecast period (2025-2033), driven by increasing shale gas exploration and production. Technological advancements in proppant design and manufacturing are enhancing efficiency and performance, leading to increased adoption rates. Shifting consumer behavior towards environmentally friendly proppants presents both opportunities and challenges. Market penetration of resin-coated proppants is expected to grow from xx% in 2024 to xx% by 2033.
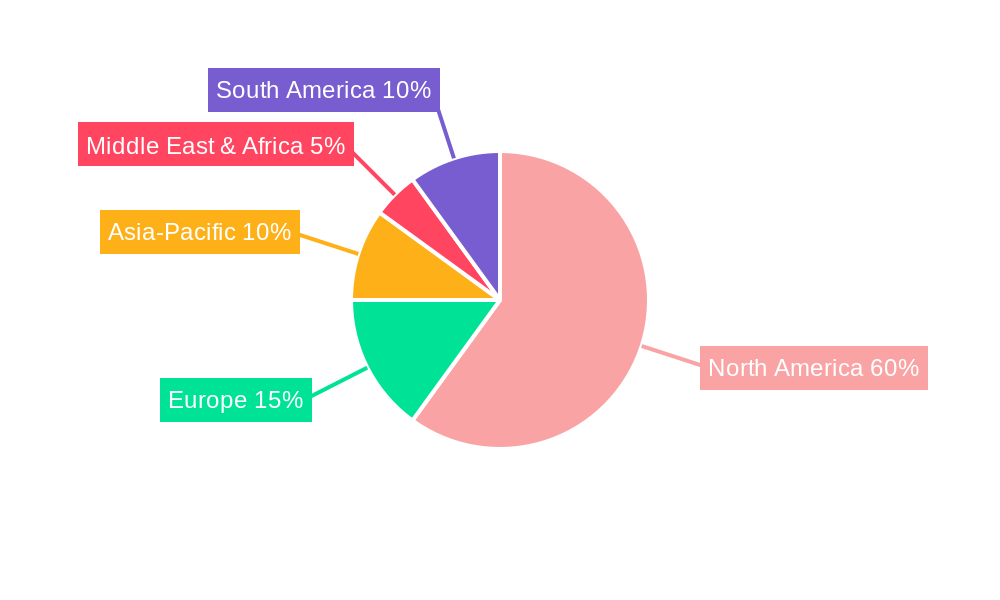
Dominant Regions, Countries, or Segments in North America Proppants Market
The Permian Basin in the United States remains the dominant region for proppant consumption, driven by extensive shale gas production activities. Texas and Pennsylvania are key producing states, benefiting from favorable geological conditions and supportive regulatory frameworks. The growth in these regions is fueled by robust infrastructure, efficient logistics, and a skilled workforce. The Canadian market is also experiencing significant growth, especially in the Western Canadian Sedimentary Basin, boosted by ongoing oil sands projects and shale gas development.
- Key Drivers (Permian Basin): Abundant shale gas reserves, existing infrastructure, favorable government policies, and robust oil and gas activity.
- Key Drivers (Canada): Oil sands development, shale gas exploration, and government incentives for energy production.
- Market Share: Permian Basin accounts for approximately xx% of the North American proppant market, with Texas and Pennsylvania holding the largest shares.
North America Proppants Market Product Landscape
The proppants market offers a range of products, including frac sand (with varying mesh sizes and specifications) and ceramic proppants. Recent innovations focus on enhancing proppant strength, conductivity, and overall well productivity. Resin-coated proppants are gaining traction due to their improved performance characteristics. Key selling propositions include higher fracture conductivity, enhanced proppant embedment, and improved well stimulation results.
Key Drivers, Barriers & Challenges in North America Proppants Market
Key Drivers:
- Growing shale gas and oil production.
- Technological advancements in proppant design and manufacturing.
- Government support for energy independence.
Key Challenges:
- Fluctuations in oil and gas prices.
- Environmental regulations impacting production and disposal.
- Intense competition among proppant producers, leading to price pressure. This pressure is estimated to reduce profit margins by approximately xx% by 2033.
- Supply chain disruptions and transportation costs.
Emerging Opportunities in North America Proppants Market
Emerging opportunities include the development of sustainable and environmentally friendly proppants, expansion into unconventional resource plays, and the adoption of advanced well completion techniques. The market is also witnessing growth in the demand for specialized proppants tailored to specific geological formations.
Growth Accelerators in the North America Proppants Market Industry
Technological breakthroughs in proppant manufacturing, strategic partnerships to improve supply chain efficiency, and expansion into new geographical areas are key growth accelerators. Increased investment in research and development and the adoption of digital technologies are further fueling market growth.
Key Players Shaping the North America Proppants Market Market
- Badger Mining Corporation
- CoorsTek Inc
- Covia Holdings Corporation
- Eagle Materials Inc
- Fores LTD
- Halliburton
- Hexion
- Hi-Crush
- Imerys
- Preferred Proppants LLC
- Saint-Gobain
- Schlumberger Limited
- Superior Silica Sands (Emerge Energy Services)
- US SILICA
- WAYFINDER
Notable Milestones in North America Proppants Market Sector
- September 2022: Hexion Inc. and Wayfinder Corp partnered to enhance resin-coated proppant offerings in the Western Canadian Sedimentary Basin.
- October 2021: U.S. Silica announced the exploration of separating its non-oil and gas division.
In-Depth North America Proppants Market Market Outlook
The North America proppants market is poised for sustained growth driven by ongoing technological advancements, strategic collaborations, and expanding exploration and production activities in unconventional resource plays. The market presents significant opportunities for companies focused on innovation, efficiency, and sustainability. Strategic partnerships and acquisitions will continue to shape the competitive landscape, enhancing production capabilities and market reach.
North America Proppants Market Segmentation
-
1. Type
- 1.1. Frac Sand
- 1.2. Resin Coated
- 1.3. Ceramic
-
2. Geography
- 2.1. United States
- 2.2. Canada
- 2.3. Mexico
North America Proppants Market Segmentation By Geography
- 1. United States
- 2. Canada
- 3. Mexico
North America Proppants Market REPORT HIGHLIGHTS
| Aspects | Details |
|---|---|
| Study Period | 2019-2033 |
| Base Year | 2024 |
| Estimated Year | 2025 |
| Forecast Period | 2025-2033 |
| Historical Period | 2019-2024 |
| Growth Rate | CAGR of > 7.00% from 2019-2033 |
| Segmentation |
|
Table of Contents
- 1. Introduction
- 1.1. Research Scope
- 1.2. Market Segmentation
- 1.3. Research Methodology
- 1.4. Definitions and Assumptions
- 2. Executive Summary
- 2.1. Introduction
- 3. Market Dynamics
- 3.1. Introduction
- 3.2. Market Drivers
- 3.2.1. Improvements in Fracking Technology; Increasing Usage of Frac Sand (Quantity per Well); Increasing Shale Gas Production Activities
- 3.3. Market Restrains
- 3.3.1. Improvements in Fracking Technology; Increasing Usage of Frac Sand (Quantity per Well); Increasing Shale Gas Production Activities
- 3.4. Market Trends
- 3.4.1. Frac Sand to Dominate the Market
- 4. Market Factor Analysis
- 4.1. Porters Five Forces
- 4.2. Supply/Value Chain
- 4.3. PESTEL analysis
- 4.4. Market Entropy
- 4.5. Patent/Trademark Analysis
- 5. Global North America Proppants Market Analysis, Insights and Forecast, 2019-2031
- 5.1. Market Analysis, Insights and Forecast - by Type
- 5.1.1. Frac Sand
- 5.1.2. Resin Coated
- 5.1.3. Ceramic
- 5.2. Market Analysis, Insights and Forecast - by Geography
- 5.2.1. United States
- 5.2.2. Canada
- 5.2.3. Mexico
- 5.3. Market Analysis, Insights and Forecast - by Region
- 5.3.1. United States
- 5.3.2. Canada
- 5.3.3. Mexico
- 5.1. Market Analysis, Insights and Forecast - by Type
- 6. United States North America Proppants Market Analysis, Insights and Forecast, 2019-2031
- 6.1. Market Analysis, Insights and Forecast - by Type
- 6.1.1. Frac Sand
- 6.1.2. Resin Coated
- 6.1.3. Ceramic
- 6.2. Market Analysis, Insights and Forecast - by Geography
- 6.2.1. United States
- 6.2.2. Canada
- 6.2.3. Mexico
- 6.1. Market Analysis, Insights and Forecast - by Type
- 7. Canada North America Proppants Market Analysis, Insights and Forecast, 2019-2031
- 7.1. Market Analysis, Insights and Forecast - by Type
- 7.1.1. Frac Sand
- 7.1.2. Resin Coated
- 7.1.3. Ceramic
- 7.2. Market Analysis, Insights and Forecast - by Geography
- 7.2.1. United States
- 7.2.2. Canada
- 7.2.3. Mexico
- 7.1. Market Analysis, Insights and Forecast - by Type
- 8. Mexico North America Proppants Market Analysis, Insights and Forecast, 2019-2031
- 8.1. Market Analysis, Insights and Forecast - by Type
- 8.1.1. Frac Sand
- 8.1.2. Resin Coated
- 8.1.3. Ceramic
- 8.2. Market Analysis, Insights and Forecast - by Geography
- 8.2.1. United States
- 8.2.2. Canada
- 8.2.3. Mexico
- 8.1. Market Analysis, Insights and Forecast - by Type
- 9. Competitive Analysis
- 9.1. Global Market Share Analysis 2024
- 9.2. Company Profiles
- 9.2.1 Badger Mining Corporation
- 9.2.1.1. Overview
- 9.2.1.2. Products
- 9.2.1.3. SWOT Analysis
- 9.2.1.4. Recent Developments
- 9.2.1.5. Financials (Based on Availability)
- 9.2.2 CoorsTek Inc
- 9.2.2.1. Overview
- 9.2.2.2. Products
- 9.2.2.3. SWOT Analysis
- 9.2.2.4. Recent Developments
- 9.2.2.5. Financials (Based on Availability)
- 9.2.3 Covia Holdings Corporation
- 9.2.3.1. Overview
- 9.2.3.2. Products
- 9.2.3.3. SWOT Analysis
- 9.2.3.4. Recent Developments
- 9.2.3.5. Financials (Based on Availability)
- 9.2.4 Eagle Materials Inc
- 9.2.4.1. Overview
- 9.2.4.2. Products
- 9.2.4.3. SWOT Analysis
- 9.2.4.4. Recent Developments
- 9.2.4.5. Financials (Based on Availability)
- 9.2.5 Fores LTD
- 9.2.5.1. Overview
- 9.2.5.2. Products
- 9.2.5.3. SWOT Analysis
- 9.2.5.4. Recent Developments
- 9.2.5.5. Financials (Based on Availability)
- 9.2.6 Halliburton
- 9.2.6.1. Overview
- 9.2.6.2. Products
- 9.2.6.3. SWOT Analysis
- 9.2.6.4. Recent Developments
- 9.2.6.5. Financials (Based on Availability)
- 9.2.7 Hexion
- 9.2.7.1. Overview
- 9.2.7.2. Products
- 9.2.7.3. SWOT Analysis
- 9.2.7.4. Recent Developments
- 9.2.7.5. Financials (Based on Availability)
- 9.2.8 Hi-Crush
- 9.2.8.1. Overview
- 9.2.8.2. Products
- 9.2.8.3. SWOT Analysis
- 9.2.8.4. Recent Developments
- 9.2.8.5. Financials (Based on Availability)
- 9.2.9 Imerys
- 9.2.9.1. Overview
- 9.2.9.2. Products
- 9.2.9.3. SWOT Analysis
- 9.2.9.4. Recent Developments
- 9.2.9.5. Financials (Based on Availability)
- 9.2.10 Preferred Proppants LLC
- 9.2.10.1. Overview
- 9.2.10.2. Products
- 9.2.10.3. SWOT Analysis
- 9.2.10.4. Recent Developments
- 9.2.10.5. Financials (Based on Availability)
- 9.2.11 Saint-Gobain
- 9.2.11.1. Overview
- 9.2.11.2. Products
- 9.2.11.3. SWOT Analysis
- 9.2.11.4. Recent Developments
- 9.2.11.5. Financials (Based on Availability)
- 9.2.12 Schlumberger Limited
- 9.2.12.1. Overview
- 9.2.12.2. Products
- 9.2.12.3. SWOT Analysis
- 9.2.12.4. Recent Developments
- 9.2.12.5. Financials (Based on Availability)
- 9.2.13 Superior Silica Sands (Emerge Energy Services)
- 9.2.13.1. Overview
- 9.2.13.2. Products
- 9.2.13.3. SWOT Analysis
- 9.2.13.4. Recent Developments
- 9.2.13.5. Financials (Based on Availability)
- 9.2.14 US SILICA
- 9.2.14.1. Overview
- 9.2.14.2. Products
- 9.2.14.3. SWOT Analysis
- 9.2.14.4. Recent Developments
- 9.2.14.5. Financials (Based on Availability)
- 9.2.15 WAYFINDER*List Not Exhaustive
- 9.2.15.1. Overview
- 9.2.15.2. Products
- 9.2.15.3. SWOT Analysis
- 9.2.15.4. Recent Developments
- 9.2.15.5. Financials (Based on Availability)
- 9.2.1 Badger Mining Corporation
List of Figures
- Figure 1: Global North America Proppants Market Revenue Breakdown (Million, %) by Region 2024 & 2032
- Figure 2: United States North America Proppants Market Revenue (Million), by Type 2024 & 2032
- Figure 3: United States North America Proppants Market Revenue Share (%), by Type 2024 & 2032
- Figure 4: United States North America Proppants Market Revenue (Million), by Geography 2024 & 2032
- Figure 5: United States North America Proppants Market Revenue Share (%), by Geography 2024 & 2032
- Figure 6: United States North America Proppants Market Revenue (Million), by Country 2024 & 2032
- Figure 7: United States North America Proppants Market Revenue Share (%), by Country 2024 & 2032
- Figure 8: Canada North America Proppants Market Revenue (Million), by Type 2024 & 2032
- Figure 9: Canada North America Proppants Market Revenue Share (%), by Type 2024 & 2032
- Figure 10: Canada North America Proppants Market Revenue (Million), by Geography 2024 & 2032
- Figure 11: Canada North America Proppants Market Revenue Share (%), by Geography 2024 & 2032
- Figure 12: Canada North America Proppants Market Revenue (Million), by Country 2024 & 2032
- Figure 13: Canada North America Proppants Market Revenue Share (%), by Country 2024 & 2032
- Figure 14: Mexico North America Proppants Market Revenue (Million), by Type 2024 & 2032
- Figure 15: Mexico North America Proppants Market Revenue Share (%), by Type 2024 & 2032
- Figure 16: Mexico North America Proppants Market Revenue (Million), by Geography 2024 & 2032
- Figure 17: Mexico North America Proppants Market Revenue Share (%), by Geography 2024 & 2032
- Figure 18: Mexico North America Proppants Market Revenue (Million), by Country 2024 & 2032
- Figure 19: Mexico North America Proppants Market Revenue Share (%), by Country 2024 & 2032
List of Tables
- Table 1: Global North America Proppants Market Revenue Million Forecast, by Region 2019 & 2032
- Table 2: Global North America Proppants Market Revenue Million Forecast, by Type 2019 & 2032
- Table 3: Global North America Proppants Market Revenue Million Forecast, by Geography 2019 & 2032
- Table 4: Global North America Proppants Market Revenue Million Forecast, by Region 2019 & 2032
- Table 5: Global North America Proppants Market Revenue Million Forecast, by Type 2019 & 2032
- Table 6: Global North America Proppants Market Revenue Million Forecast, by Geography 2019 & 2032
- Table 7: Global North America Proppants Market Revenue Million Forecast, by Country 2019 & 2032
- Table 8: Global North America Proppants Market Revenue Million Forecast, by Type 2019 & 2032
- Table 9: Global North America Proppants Market Revenue Million Forecast, by Geography 2019 & 2032
- Table 10: Global North America Proppants Market Revenue Million Forecast, by Country 2019 & 2032
- Table 11: Global North America Proppants Market Revenue Million Forecast, by Type 2019 & 2032
- Table 12: Global North America Proppants Market Revenue Million Forecast, by Geography 2019 & 2032
- Table 13: Global North America Proppants Market Revenue Million Forecast, by Country 2019 & 2032
Frequently Asked Questions
1. What is the projected Compound Annual Growth Rate (CAGR) of the North America Proppants Market?
The projected CAGR is approximately > 7.00%.
2. Which companies are prominent players in the North America Proppants Market?
Key companies in the market include Badger Mining Corporation, CoorsTek Inc, Covia Holdings Corporation, Eagle Materials Inc, Fores LTD, Halliburton, Hexion, Hi-Crush, Imerys, Preferred Proppants LLC, Saint-Gobain, Schlumberger Limited, Superior Silica Sands (Emerge Energy Services), US SILICA, WAYFINDER*List Not Exhaustive.
3. What are the main segments of the North America Proppants Market?
The market segments include Type, Geography.
4. Can you provide details about the market size?
The market size is estimated to be USD XX Million as of 2022.
5. What are some drivers contributing to market growth?
Improvements in Fracking Technology; Increasing Usage of Frac Sand (Quantity per Well); Increasing Shale Gas Production Activities.
6. What are the notable trends driving market growth?
Frac Sand to Dominate the Market.
7. Are there any restraints impacting market growth?
Improvements in Fracking Technology; Increasing Usage of Frac Sand (Quantity per Well); Increasing Shale Gas Production Activities.
8. Can you provide examples of recent developments in the market?
In September 2022, Hexion Inc. and Wayfinder Corp partnered to better serve resin-coated proppant users in the Western Canadian Sedimentary Basin. This strategic partnership joined Hexion's leading resin and chemical expertise with Wayfinder's new state-of-the-art manufacturing facility and logistics network.
9. What pricing options are available for accessing the report?
Pricing options include single-user, multi-user, and enterprise licenses priced at USD 4750, USD 5250, and USD 8750 respectively.
10. Is the market size provided in terms of value or volume?
The market size is provided in terms of value, measured in Million.
11. Are there any specific market keywords associated with the report?
Yes, the market keyword associated with the report is "North America Proppants Market," which aids in identifying and referencing the specific market segment covered.
12. How do I determine which pricing option suits my needs best?
The pricing options vary based on user requirements and access needs. Individual users may opt for single-user licenses, while businesses requiring broader access may choose multi-user or enterprise licenses for cost-effective access to the report.
13. Are there any additional resources or data provided in the North America Proppants Market report?
While the report offers comprehensive insights, it's advisable to review the specific contents or supplementary materials provided to ascertain if additional resources or data are available.
14. How can I stay updated on further developments or reports in the North America Proppants Market?
To stay informed about further developments, trends, and reports in the North America Proppants Market, consider subscribing to industry newsletters, following relevant companies and organizations, or regularly checking reputable industry news sources and publications.
Methodology
Step 1 - Identification of Relevant Samples Size from Population Database


Step 2 - Approaches for Defining Global Market Size (Value, Volume* & Price*)

Note*: In applicable scenarios
Step 3 - Data Sources
Primary Research
- Web Analytics
- Survey Reports
- Research Institute
- Latest Research Reports
- Opinion Leaders
Secondary Research
- Annual Reports
- White Paper
- Latest Press Release
- Industry Association
- Paid Database
- Investor Presentations

Step 4 - Data Triangulation
Involves using different sources of information in order to increase the validity of a study
These sources are likely to be stakeholders in a program - participants, other researchers, program staff, other community members, and so on.
Then we put all data in single framework & apply various statistical tools to find out the dynamic on the market.
During the analysis stage, feedback from the stakeholder groups would be compared to determine areas of agreement as well as areas of divergence
