

Key Insights
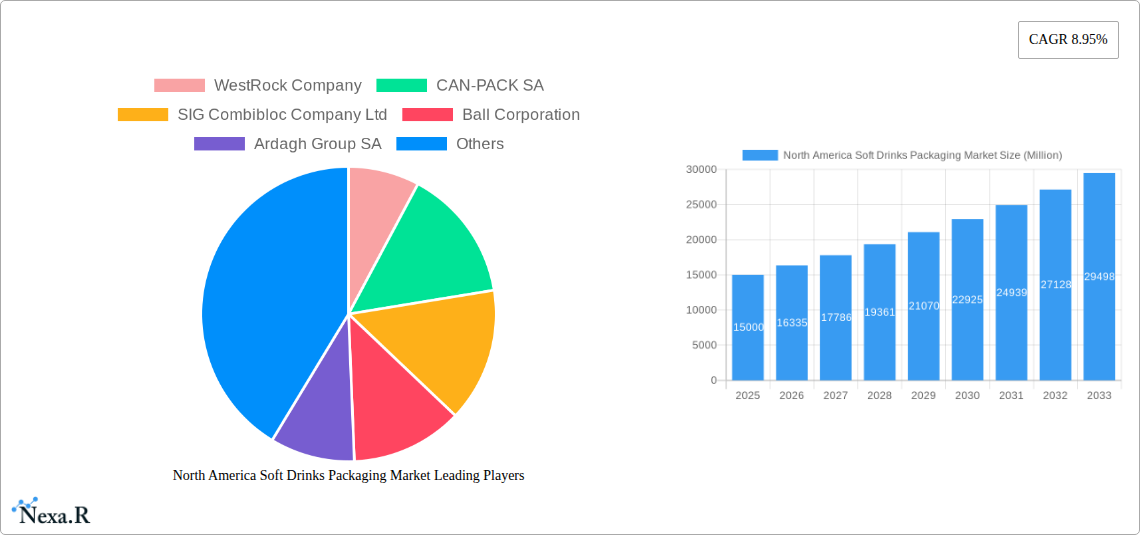
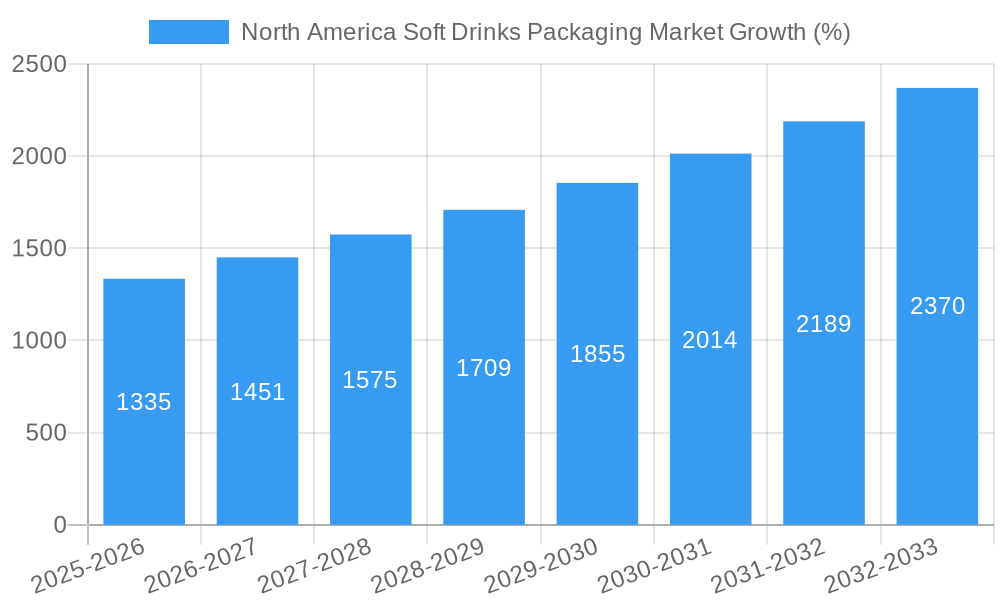
The North America soft drinks packaging market, valued at approximately $15 billion in 2025, is projected to experience robust growth, fueled by a compound annual growth rate (CAGR) of 8.95% from 2025 to 2033. This expansion is driven by several key factors. Firstly, the increasing consumption of soft drinks, particularly within convenient, on-the-go formats, necessitates a higher demand for packaging solutions. Secondly, the rising popularity of sustainable and eco-friendly packaging materials, such as recycled paperboard and plant-based plastics, is reshaping the market landscape. Companies are increasingly investing in research and development to meet consumer preferences for environmentally responsible options. This trend is further propelled by stringent government regulations aimed at reducing plastic waste. Finally, technological advancements in packaging design and production are contributing to enhanced efficiency, cost-effectiveness, and product preservation. The shift towards lightweighting and improved barrier properties in packaging materials is also contributing to this growth.
The market segmentation reveals significant opportunities across various material types and product categories. Plastic remains a dominant material, offering versatility and cost-effectiveness, although its share is likely to decrease slightly due to environmental concerns. Paper and paperboard are expected to gain traction, reflecting the aforementioned consumer and regulatory push towards sustainability. Within product types, bottled water and carbonated drinks constitute substantial segments, driven by their continued popularity. However, the growing demand for healthier alternatives, such as juices and RTD (ready-to-drink) beverages, presents lucrative avenues for packaging manufacturers. Key players like WestRock, Ball Corporation, and Amcor are actively competing in this dynamic market, focusing on innovation and strategic partnerships to maintain their market positions and capture emerging opportunities. Regional analysis indicates that the United States dominates the North American market, followed by Canada and Mexico.
North America Soft Drinks Packaging Market: A Comprehensive Report (2019-2033)
This in-depth report provides a comprehensive analysis of the North America soft drinks packaging market, encompassing market dynamics, growth trends, regional performance, product landscape, key players, and future outlook. The study period covers 2019-2033, with a base year of 2025 and a forecast period of 2025-2033. The report is essential for industry professionals, investors, and strategic decision-makers seeking a detailed understanding of this dynamic market. The report analyzes the parent market of Packaging and the child market of Soft Drinks Packaging in North America.
North America Soft Drinks Packaging Market Dynamics & Structure
This section analyzes the competitive landscape, technological advancements, regulatory influences, and market trends shaping the North America soft drinks packaging market. We delve into market concentration, identifying major players and their market share percentages (xx%). The report explores the impact of technological innovations, such as lightweighting and sustainable materials, on market growth. Regulatory frameworks concerning recyclability and material sourcing are examined, alongside the influence of consumer preferences and environmental concerns. The analysis also includes the impact of mergers and acquisitions (M&A) activity, examining deal volumes in the recent past (xx deals in the past 5 years).
- Market Concentration: Highly fragmented with top 5 players holding xx% market share.
- Technological Innovation: Focus on sustainable packaging, lightweighting, and improved barrier properties.
- Regulatory Frameworks: Increasing emphasis on recyclability and reduced environmental impact.
- Competitive Product Substitutes: Growing interest in alternative packaging materials like biodegradable plastics.
- End-User Demographics: Shifting consumer preferences towards convenience, sustainability, and health consciousness.
- M&A Trends: Moderate consolidation with strategic acquisitions driving market expansion.
North America Soft Drinks Packaging Market Growth Trends & Insights
This section details the evolution of the North America soft drinks packaging market, analyzing market size (xx Million units in 2024, projected to reach xx Million units in 2033), adoption rates, and technological disruption. We examine consumer behavior shifts, such as the increasing demand for on-the-go packaging and eco-friendly options. Key metrics such as the Compound Annual Growth Rate (CAGR) and market penetration are presented to offer a detailed understanding of market growth trajectory. The impact of e-commerce and changing distribution channels on packaging choices are also assessed.
(Detailed analysis using specific metrics and paragraphs will be included here, based on XXX - data source details to be provided).
Dominant Regions, Countries, or Segments in North America Soft Drinks Packaging Market
This section identifies the leading regions, countries, and segments within the North American soft drinks packaging market. It will analyze the factors driving growth in each segment: Packaging Material Type (Plastic, Paper and Paperboard, Glass, Metal, Other Materials) and Product Type (Bottled Water, Carbonated Drinks, Juices, RTD Beverages, Sports Drinks, Other Product Types). We will examine market share, growth potential, and specific regional drivers like economic policies and infrastructure development.
- Leading Segment (Packaging Material Type): Plastic currently dominates, followed by paper and paperboard.
- Leading Segment (Product Type): Bottled water shows highest growth followed by carbonated drinks.
- Dominant Region: The US holds the largest market share, followed by Canada and Mexico. (Detailed analysis with paragraphs and bullet points highlighting specific regional drivers will be provided here.)
North America Soft Drinks Packaging Market Product Landscape
This section describes product innovations, applications, and performance metrics within the North American soft drinks packaging market. We highlight unique selling propositions of various packaging types, including lightweight designs, improved barrier properties, and enhanced recyclability. Technological advancements such as the increasing use of digital printing for customized packaging are discussed. (Detailed paragraph describing product innovation and key performance metrics.)
Key Drivers, Barriers & Challenges in North America Soft Drinks Packaging Market
This section outlines the key drivers and challenges influencing the North America soft drinks packaging market. Drivers include rising demand for soft drinks, increasing consumer preference for convenience, technological advancements in packaging materials, and government regulations. Challenges include fluctuating raw material prices, stringent environmental regulations, and intense competition.
- Key Drivers: Growing soft drink consumption, technological innovation, and sustainability concerns.
- Key Challenges: Raw material cost volatility, environmental regulations, and competitive pressure.
Emerging Opportunities in North America Soft Drinks Packaging Market
This section identifies emerging opportunities within the North American soft drinks packaging market. These include growing demand for sustainable and eco-friendly packaging options, increasing adoption of lightweight packaging materials, and innovative packaging designs catering to specific consumer needs.
Growth Accelerators in the North America Soft Drinks Packaging Market Industry
This section analyzes factors that will accelerate the long-term growth of the North America soft drinks packaging market. These include technological advancements in packaging materials and manufacturing processes, strategic partnerships and collaborations within the industry, and expansion into new and untapped markets. This section also highlights the benefits of sustainable packaging practices which drive continued growth.
Key Players Shaping the North America Soft Drinks Packaging Market Market
- WestRock Company
- CAN-PACK SA
- SIG Combibloc Company Ltd
- Ball Corporation
- Ardagh Group SA
- Alcoa Corporation
- Crown Holdings Inc
- Graham Packaging Company
- Tetra Pak International
- The Scoular Company
- Toyo Seikan Group Holdings Ltd
- Pactive LLC
- Placon Corporation
- Genpak LLC
- Owens-Illinois Inc
- Amcor Ltd
Notable Milestones in North America Soft Drinks Packaging Sector
- May 2021: Ball Corporation launches its Ball Aluminum Cup for soft drinks, nationwide.
- April 2021: Amcor announces a strategic investment in ePac flexible packaging.
In-Depth North America Soft Drinks Packaging Market Outlook
The North America soft drinks packaging market is poised for continued growth, driven by factors such as increasing demand for convenient and sustainable packaging solutions. Strategic partnerships, technological innovations, and expansion into new markets will play a crucial role in shaping the market's future. The market is expected to witness strong growth in the forecast period, with significant opportunities for companies that can adapt to evolving consumer preferences and regulatory changes.
North America Soft Drinks Packaging Market Segmentation
-
1. Packaging Material Type
- 1.1. Plastic
- 1.2. Paper and Paperboard
- 1.3. Glass
- 1.4. Metal
- 1.5. Other Materials
-
2. Product Type
- 2.1. Bottled Water
- 2.2. Carbonated Drinks
- 2.3. Juices
- 2.4. RTD Beverages
- 2.5. Sports Drinks
- 2.6. Other Product Types
-
3. Geography
- 3.1. United States
- 3.2. Canada
North America Soft Drinks Packaging Market Segmentation By Geography
- 1. United States
- 2. Canada
North America Soft Drinks Packaging Market REPORT HIGHLIGHTS
| Aspects | Details |
|---|---|
| Study Period | 2019-2033 |
| Base Year | 2024 |
| Estimated Year | 2025 |
| Forecast Period | 2025-2033 |
| Historical Period | 2019-2024 |
| Growth Rate | CAGR of 8.95% from 2019-2033 |
| Segmentation |
|
Table of Contents
- 1. Introduction
- 1.1. Research Scope
- 1.2. Market Segmentation
- 1.3. Research Methodology
- 1.4. Definitions and Assumptions
- 2. Executive Summary
- 2.1. Introduction
- 3. Market Dynamics
- 3.1. Introduction
- 3.2. Market Drivers
- 3.2.1. Increasing Soft Drink Consumption; Increased Demand for Convenience Packaging from Consumers
- 3.3. Market Restrains
- 3.3.1. Environmental Concerns Regarding Usage of Plastic; Stringent Government Regulations
- 3.4. Market Trends
- 3.4.1. The RTD Beverages Segment is Expected to Hold a Significant Market Share
- 4. Market Factor Analysis
- 4.1. Porters Five Forces
- 4.2. Supply/Value Chain
- 4.3. PESTEL analysis
- 4.4. Market Entropy
- 4.5. Patent/Trademark Analysis
- 5. North America Soft Drinks Packaging Market Analysis, Insights and Forecast, 2019-2031
- 5.1. Market Analysis, Insights and Forecast - by Packaging Material Type
- 5.1.1. Plastic
- 5.1.2. Paper and Paperboard
- 5.1.3. Glass
- 5.1.4. Metal
- 5.1.5. Other Materials
- 5.2. Market Analysis, Insights and Forecast - by Product Type
- 5.2.1. Bottled Water
- 5.2.2. Carbonated Drinks
- 5.2.3. Juices
- 5.2.4. RTD Beverages
- 5.2.5. Sports Drinks
- 5.2.6. Other Product Types
- 5.3. Market Analysis, Insights and Forecast - by Geography
- 5.3.1. United States
- 5.3.2. Canada
- 5.4. Market Analysis, Insights and Forecast - by Region
- 5.4.1. United States
- 5.4.2. Canada
- 5.1. Market Analysis, Insights and Forecast - by Packaging Material Type
- 6. United States North America Soft Drinks Packaging Market Analysis, Insights and Forecast, 2019-2031
- 6.1. Market Analysis, Insights and Forecast - by Packaging Material Type
- 6.1.1. Plastic
- 6.1.2. Paper and Paperboard
- 6.1.3. Glass
- 6.1.4. Metal
- 6.1.5. Other Materials
- 6.2. Market Analysis, Insights and Forecast - by Product Type
- 6.2.1. Bottled Water
- 6.2.2. Carbonated Drinks
- 6.2.3. Juices
- 6.2.4. RTD Beverages
- 6.2.5. Sports Drinks
- 6.2.6. Other Product Types
- 6.3. Market Analysis, Insights and Forecast - by Geography
- 6.3.1. United States
- 6.3.2. Canada
- 6.1. Market Analysis, Insights and Forecast - by Packaging Material Type
- 7. Canada North America Soft Drinks Packaging Market Analysis, Insights and Forecast, 2019-2031
- 7.1. Market Analysis, Insights and Forecast - by Packaging Material Type
- 7.1.1. Plastic
- 7.1.2. Paper and Paperboard
- 7.1.3. Glass
- 7.1.4. Metal
- 7.1.5. Other Materials
- 7.2. Market Analysis, Insights and Forecast - by Product Type
- 7.2.1. Bottled Water
- 7.2.2. Carbonated Drinks
- 7.2.3. Juices
- 7.2.4. RTD Beverages
- 7.2.5. Sports Drinks
- 7.2.6. Other Product Types
- 7.3. Market Analysis, Insights and Forecast - by Geography
- 7.3.1. United States
- 7.3.2. Canada
- 7.1. Market Analysis, Insights and Forecast - by Packaging Material Type
- 8. United States North America Soft Drinks Packaging Market Analysis, Insights and Forecast, 2019-2031
- 9. Canada North America Soft Drinks Packaging Market Analysis, Insights and Forecast, 2019-2031
- 10. Mexico North America Soft Drinks Packaging Market Analysis, Insights and Forecast, 2019-2031
- 11. Rest of North America North America Soft Drinks Packaging Market Analysis, Insights and Forecast, 2019-2031
- 12. Competitive Analysis
- 12.1. Market Share Analysis 2024
- 12.2. Company Profiles
- 12.2.1 WestRock Company
- 12.2.1.1. Overview
- 12.2.1.2. Products
- 12.2.1.3. SWOT Analysis
- 12.2.1.4. Recent Developments
- 12.2.1.5. Financials (Based on Availability)
- 12.2.2 CAN-PACK SA
- 12.2.2.1. Overview
- 12.2.2.2. Products
- 12.2.2.3. SWOT Analysis
- 12.2.2.4. Recent Developments
- 12.2.2.5. Financials (Based on Availability)
- 12.2.3 SIG Combibloc Company Ltd
- 12.2.3.1. Overview
- 12.2.3.2. Products
- 12.2.3.3. SWOT Analysis
- 12.2.3.4. Recent Developments
- 12.2.3.5. Financials (Based on Availability)
- 12.2.4 Ball Corporation
- 12.2.4.1. Overview
- 12.2.4.2. Products
- 12.2.4.3. SWOT Analysis
- 12.2.4.4. Recent Developments
- 12.2.4.5. Financials (Based on Availability)
- 12.2.5 Ardagh Group SA
- 12.2.5.1. Overview
- 12.2.5.2. Products
- 12.2.5.3. SWOT Analysis
- 12.2.5.4. Recent Developments
- 12.2.5.5. Financials (Based on Availability)
- 12.2.6 Alcoa Corporation*List Not Exhaustive
- 12.2.6.1. Overview
- 12.2.6.2. Products
- 12.2.6.3. SWOT Analysis
- 12.2.6.4. Recent Developments
- 12.2.6.5. Financials (Based on Availability)
- 12.2.7 Crown Holdings Inc
- 12.2.7.1. Overview
- 12.2.7.2. Products
- 12.2.7.3. SWOT Analysis
- 12.2.7.4. Recent Developments
- 12.2.7.5. Financials (Based on Availability)
- 12.2.8 Graham Packaging Company
- 12.2.8.1. Overview
- 12.2.8.2. Products
- 12.2.8.3. SWOT Analysis
- 12.2.8.4. Recent Developments
- 12.2.8.5. Financials (Based on Availability)
- 12.2.9 Tetra Pak International
- 12.2.9.1. Overview
- 12.2.9.2. Products
- 12.2.9.3. SWOT Analysis
- 12.2.9.4. Recent Developments
- 12.2.9.5. Financials (Based on Availability)
- 12.2.10 The Scoular Company
- 12.2.10.1. Overview
- 12.2.10.2. Products
- 12.2.10.3. SWOT Analysis
- 12.2.10.4. Recent Developments
- 12.2.10.5. Financials (Based on Availability)
- 12.2.11 Toyo Seikan Group Holdings Ltd
- 12.2.11.1. Overview
- 12.2.11.2. Products
- 12.2.11.3. SWOT Analysis
- 12.2.11.4. Recent Developments
- 12.2.11.5. Financials (Based on Availability)
- 12.2.12 Pactive LLC
- 12.2.12.1. Overview
- 12.2.12.2. Products
- 12.2.12.3. SWOT Analysis
- 12.2.12.4. Recent Developments
- 12.2.12.5. Financials (Based on Availability)
- 12.2.13 Placon Corporation
- 12.2.13.1. Overview
- 12.2.13.2. Products
- 12.2.13.3. SWOT Analysis
- 12.2.13.4. Recent Developments
- 12.2.13.5. Financials (Based on Availability)
- 12.2.14 Genpak LLC
- 12.2.14.1. Overview
- 12.2.14.2. Products
- 12.2.14.3. SWOT Analysis
- 12.2.14.4. Recent Developments
- 12.2.14.5. Financials (Based on Availability)
- 12.2.15 Owens-Illinois Inc
- 12.2.15.1. Overview
- 12.2.15.2. Products
- 12.2.15.3. SWOT Analysis
- 12.2.15.4. Recent Developments
- 12.2.15.5. Financials (Based on Availability)
- 12.2.16 Amcor Ltd
- 12.2.16.1. Overview
- 12.2.16.2. Products
- 12.2.16.3. SWOT Analysis
- 12.2.16.4. Recent Developments
- 12.2.16.5. Financials (Based on Availability)
- 12.2.1 WestRock Company
List of Figures
- Figure 1: North America Soft Drinks Packaging Market Revenue Breakdown (Million, %) by Product 2024 & 2032
- Figure 2: North America Soft Drinks Packaging Market Share (%) by Company 2024
List of Tables
- Table 1: North America Soft Drinks Packaging Market Revenue Million Forecast, by Region 2019 & 2032
- Table 2: North America Soft Drinks Packaging Market Revenue Million Forecast, by Packaging Material Type 2019 & 2032
- Table 3: North America Soft Drinks Packaging Market Revenue Million Forecast, by Product Type 2019 & 2032
- Table 4: North America Soft Drinks Packaging Market Revenue Million Forecast, by Geography 2019 & 2032
- Table 5: North America Soft Drinks Packaging Market Revenue Million Forecast, by Region 2019 & 2032
- Table 6: North America Soft Drinks Packaging Market Revenue Million Forecast, by Country 2019 & 2032
- Table 7: United States North America Soft Drinks Packaging Market Revenue (Million) Forecast, by Application 2019 & 2032
- Table 8: Canada North America Soft Drinks Packaging Market Revenue (Million) Forecast, by Application 2019 & 2032
- Table 9: Mexico North America Soft Drinks Packaging Market Revenue (Million) Forecast, by Application 2019 & 2032
- Table 10: Rest of North America North America Soft Drinks Packaging Market Revenue (Million) Forecast, by Application 2019 & 2032
- Table 11: North America Soft Drinks Packaging Market Revenue Million Forecast, by Packaging Material Type 2019 & 2032
- Table 12: North America Soft Drinks Packaging Market Revenue Million Forecast, by Product Type 2019 & 2032
- Table 13: North America Soft Drinks Packaging Market Revenue Million Forecast, by Geography 2019 & 2032
- Table 14: North America Soft Drinks Packaging Market Revenue Million Forecast, by Country 2019 & 2032
- Table 15: North America Soft Drinks Packaging Market Revenue Million Forecast, by Packaging Material Type 2019 & 2032
- Table 16: North America Soft Drinks Packaging Market Revenue Million Forecast, by Product Type 2019 & 2032
- Table 17: North America Soft Drinks Packaging Market Revenue Million Forecast, by Geography 2019 & 2032
- Table 18: North America Soft Drinks Packaging Market Revenue Million Forecast, by Country 2019 & 2032
Frequently Asked Questions
1. What is the projected Compound Annual Growth Rate (CAGR) of the North America Soft Drinks Packaging Market?
The projected CAGR is approximately 8.95%.
2. Which companies are prominent players in the North America Soft Drinks Packaging Market?
Key companies in the market include WestRock Company, CAN-PACK SA, SIG Combibloc Company Ltd, Ball Corporation, Ardagh Group SA, Alcoa Corporation*List Not Exhaustive, Crown Holdings Inc, Graham Packaging Company, Tetra Pak International, The Scoular Company, Toyo Seikan Group Holdings Ltd, Pactive LLC, Placon Corporation, Genpak LLC, Owens-Illinois Inc, Amcor Ltd.
3. What are the main segments of the North America Soft Drinks Packaging Market?
The market segments include Packaging Material Type, Product Type, Geography.
4. Can you provide details about the market size?
The market size is estimated to be USD XX Million as of 2022.
5. What are some drivers contributing to market growth?
Increasing Soft Drink Consumption; Increased Demand for Convenience Packaging from Consumers.
6. What are the notable trends driving market growth?
The RTD Beverages Segment is Expected to Hold a Significant Market Share.
7. Are there any restraints impacting market growth?
Environmental Concerns Regarding Usage of Plastic; Stringent Government Regulations.
8. Can you provide examples of recent developments in the market?
In May 2021, Ball Corporation announced the availability of the first-of-its-kind Ball Aluminum Cup for soft drinks at major retailers in all 50 states across the United States. The product was made available between May and June for the first time to more than 18,000 food, drug, and mass retailers, including Kroger, Target, Albertsons, CVS, and others. The nationwide retail rollout follows the success of a limited pilot that began in 2019. Since then, the cups have been available in select retailers, restaurants, and major sports and entertainment venues such as Ball Arena in Denver, SoFi Stadium in Inglewood, and Allegiant Stadium in Las Vegas.
9. What pricing options are available for accessing the report?
Pricing options include single-user, multi-user, and enterprise licenses priced at USD 4750, USD 5250, and USD 8750 respectively.
10. Is the market size provided in terms of value or volume?
The market size is provided in terms of value, measured in Million.
11. Are there any specific market keywords associated with the report?
Yes, the market keyword associated with the report is "North America Soft Drinks Packaging Market," which aids in identifying and referencing the specific market segment covered.
12. How do I determine which pricing option suits my needs best?
The pricing options vary based on user requirements and access needs. Individual users may opt for single-user licenses, while businesses requiring broader access may choose multi-user or enterprise licenses for cost-effective access to the report.
13. Are there any additional resources or data provided in the North America Soft Drinks Packaging Market report?
While the report offers comprehensive insights, it's advisable to review the specific contents or supplementary materials provided to ascertain if additional resources or data are available.
14. How can I stay updated on further developments or reports in the North America Soft Drinks Packaging Market?
To stay informed about further developments, trends, and reports in the North America Soft Drinks Packaging Market, consider subscribing to industry newsletters, following relevant companies and organizations, or regularly checking reputable industry news sources and publications.
Methodology
Step 1 - Identification of Relevant Samples Size from Population Database


Step 2 - Approaches for Defining Global Market Size (Value, Volume* & Price*)

Note*: In applicable scenarios
Step 3 - Data Sources
Primary Research
- Web Analytics
- Survey Reports
- Research Institute
- Latest Research Reports
- Opinion Leaders
Secondary Research
- Annual Reports
- White Paper
- Latest Press Release
- Industry Association
- Paid Database
- Investor Presentations

Step 4 - Data Triangulation
Involves using different sources of information in order to increase the validity of a study
These sources are likely to be stakeholders in a program - participants, other researchers, program staff, other community members, and so on.
Then we put all data in single framework & apply various statistical tools to find out the dynamic on the market.
During the analysis stage, feedback from the stakeholder groups would be compared to determine areas of agreement as well as areas of divergence
