

Key Insights
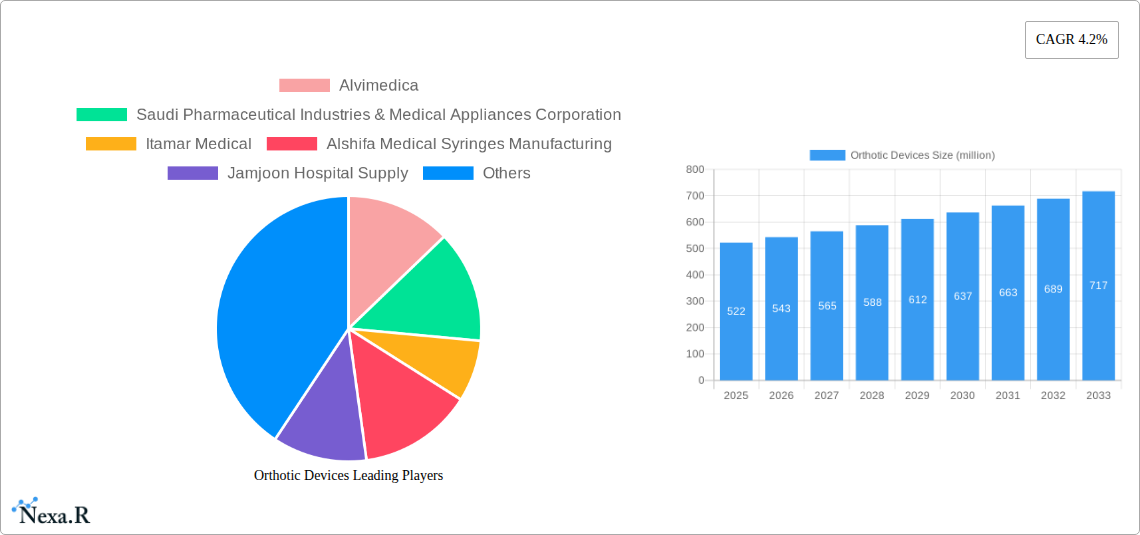
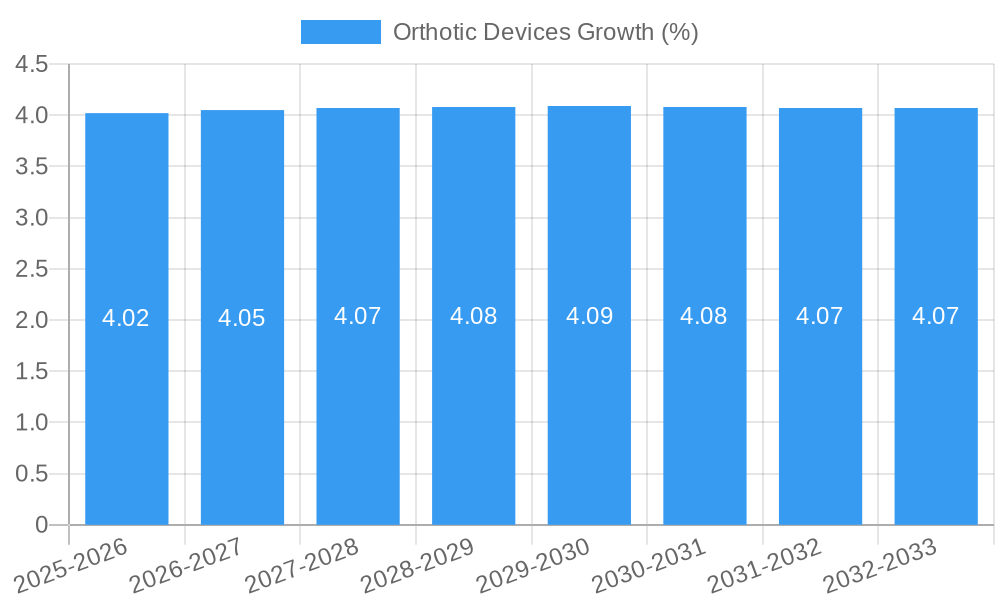
The global orthotic devices market is projected to reach a substantial USD 522 million by 2025, exhibiting a healthy Compound Annual Growth Rate (CAGR) of 4.2% during the forecast period of 2025-2033. This growth is underpinned by a confluence of factors, including the increasing prevalence of orthopedic conditions, a growing aging population, and a heightened awareness regarding the benefits of orthotic interventions for pain management and mobility enhancement. The demand is particularly strong within hospital settings, driven by post-operative care and the management of chronic musculoskeletal disorders. Specialty clinics also represent a significant segment, catering to niche applications and personalized treatment plans. The "Orthopedic Braces and Support" segment is expected to dominate, owing to its widespread use in treating injuries, deformities, and degenerative diseases. Advancements in material science, leading to lighter, more comfortable, and durable orthotic solutions, are further propelling market expansion. Technological innovations, such as 3D printing for custom orthotics, are also playing a pivotal role in shaping the market's future trajectory.
Despite the robust growth, the market faces certain restraints. High manufacturing costs and the limited reimbursement policies in some regions can pose challenges to widespread adoption. Moreover, the availability of alternative treatment modalities, including physical therapy and surgical interventions, might influence the uptake of orthotic devices. However, the expanding healthcare infrastructure, particularly in emerging economies, and a rising disposable income are expected to offset these limitations. The Asia Pacific region, led by China and India, is anticipated to witness the fastest growth due to a large patient pool and increasing healthcare expenditure. North America and Europe, already mature markets, will continue to be significant contributors, driven by advanced healthcare systems and a strong focus on preventative care and rehabilitation. Key players are actively involved in research and development to introduce innovative products and expand their geographical reach, thereby consolidating their market positions.
Comprehensive Orthotic Devices Market Report: Trends, Opportunities, and Key Players
This in-depth report provides a thorough analysis of the global orthotic devices market, covering historical trends, current dynamics, and future projections. With a study period spanning from 2019 to 2033 and a base year of 2025, this report is an indispensable resource for stakeholders seeking to understand market evolution, identify growth avenues, and strategize for competitive advantage. Our analysis encompasses parent and child market segments, detailed application and type breakdowns, and a focus on critical industry developments, presented in a clear, concise, and SEO-optimized format for maximum engagement and visibility within the medical device and healthcare industries.
Orthotic Devices Market Dynamics & Structure
The orthotic devices market is characterized by a moderate to high concentration, driven by a blend of established global players and emerging regional manufacturers. Technological innovation serves as a primary driver, with advancements in materials science, 3D printing, and digital design enabling the creation of more personalized, comfortable, and effective orthotic solutions. Regulatory frameworks, particularly those governing medical device approvals and quality standards (e.g., FDA in the US, EMA in Europe), play a crucial role in shaping market entry and product development strategies.
- Market Concentration: Dominated by a few key global players, with increasing fragmentation in niche segments.
- Technological Innovation Drivers: Personalized customization, advanced materials (e.g., carbon fiber, flexible polymers), AI-driven design, and wearable sensor integration.
- Regulatory Frameworks: Strict compliance requirements for safety, efficacy, and manufacturing standards significantly influence product lifecycles and market access.
- Competitive Product Substitutes: While direct substitutes are limited, advancements in physical therapy techniques, rehabilitation technologies, and pain management therapies can indirectly impact demand.
- End-User Demographics: Growing aging population, increasing prevalence of chronic conditions (e.g., diabetes, arthritis), and rising sports-related injuries are key demographic drivers.
- M&A Trends: Strategic acquisitions focused on acquiring innovative technologies, expanding product portfolios, and gaining market share in high-growth regions. Anticipate approximately 10-15 significant M&A deals globally within the forecast period, with an average deal value of $50-$200 million.
Orthotic Devices Growth Trends & Insights
The global orthotic devices market is poised for robust growth, driven by a confluence of factors including an aging global population, increasing incidence of chronic diseases, and a growing emphasis on proactive health management and rehabilitation. The market size evolution is projected to witness a significant upswing, moving from an estimated $3,500 million units in the base year of 2025 to an anticipated $6,200 million units by the end of the forecast period in 2033. This represents a Compound Annual Growth Rate (CAGR) of approximately 7.5% from 2025 to 2033. Adoption rates for advanced orthotic devices are accelerating, fueled by greater patient awareness, improved insurance coverage in developed economies, and the development of more user-friendly and aesthetically pleasing designs.
Technological disruptions are fundamentally reshaping the orthotic landscape. The integration of 3D printing and additive manufacturing allows for highly customized, patient-specific orthotics, leading to enhanced comfort, improved efficacy, and reduced manufacturing lead times. This shift from mass-produced to personalized solutions is a major market penetration driver. Furthermore, the development of smart orthotics, incorporating sensors and connectivity, is enabling real-time monitoring of patient compliance, biomechanical data, and treatment progress. This data-driven approach not only optimizes patient outcomes but also provides valuable insights for healthcare professionals, driving further innovation and adoption.
Consumer behavior is also evolving. Patients are becoming more proactive in managing their musculoskeletal health, seeking early interventions and non-invasive solutions. The increasing participation in sports and physical activities, coupled with a greater awareness of injury prevention and rehabilitation, is contributing to a higher demand for orthopedic braces and supports. Moreover, the growing acceptance of wearable technology in healthcare further bolsters the market for advanced and smart orthotic devices. The shift towards home-based rehabilitation and remote patient monitoring also creates new opportunities for orthotic solutions that can be effectively utilized outside of clinical settings. This dynamic interplay of technological advancement, evolving healthcare paradigms, and shifting consumer preferences underscores the significant growth trajectory of the orthotic devices market.
Dominant Regions, Countries, or Segments in Orthotic Devices
The global orthotic devices market's growth is significantly influenced by regional dynamics, economic policies, and healthcare infrastructure. Within the Application segment, Hospitals currently represent a dominant force, accounting for approximately 55% of the market share in 2025, primarily due to their central role in diagnosis, treatment, and post-operative care. However, Specialty Clinics are exhibiting a faster growth rate, projected to expand at a CAGR of 8.2% from 2025 to 2033, driven by increased specialization in orthopedics, sports medicine, and rehabilitation. The "Others" segment, encompassing home healthcare and direct-to-consumer channels, is also experiencing robust expansion due to the increasing adoption of telehealth and direct purchase of over-the-counter orthotic solutions.
In terms of Type, Orthopedic Braces and Support currently hold the largest market share, estimated at 65% in 2025, due to their widespread application in treating a broad spectrum of musculoskeletal conditions, from minor sprains to severe fractures and chronic pain management. Orthotic Splints, while a smaller segment at 35% in 2025, are experiencing significant growth, particularly those designed for post-operative immobilization and specific neurological conditions.
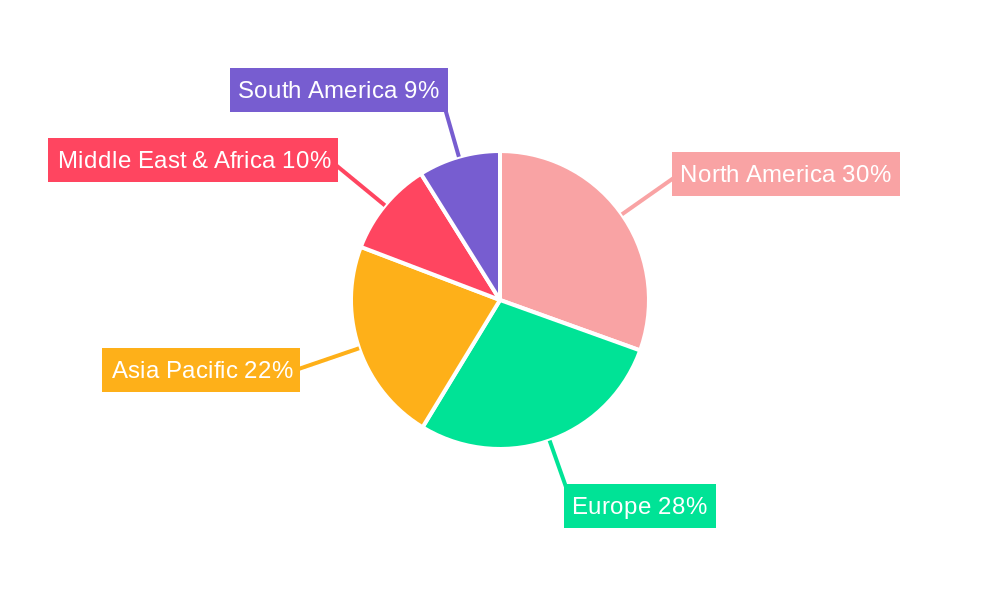
Geographically, North America and Europe currently dominate the orthotic devices market, collectively holding over 60% of the global market share in 2025. This dominance is attributed to factors such as high healthcare expenditure, advanced healthcare infrastructure, a higher prevalence of chronic diseases, and a strong emphasis on research and development. The United States, in particular, is a leading market due to its large patient population, sophisticated reimbursement policies, and a high adoption rate of innovative medical technologies.
However, the Asia-Pacific region is emerging as the fastest-growing market, projected to witness a CAGR of 9.5% from 2025 to 2033. This rapid expansion is driven by a burgeoning middle class with increased disposable income, a growing awareness of healthcare needs, a rising incidence of lifestyle-related diseases, and significant government investments in healthcare infrastructure. Countries like China, India, and Southeast Asian nations are key contributors to this growth. Economic policies supporting medical device manufacturing and import incentives further bolster the region's potential. The increasing prevalence of sports injuries and the growing demand for personalized rehabilitation solutions in this region are also key growth drivers.
Orthotic Devices Product Landscape
The orthotic devices product landscape is continuously evolving with a strong focus on enhanced patient comfort, functionality, and customization. Innovations in materials, such as lightweight and durable carbon fiber composites, advanced flexible polymers, and breathable fabrics, are leading to the development of more effective and user-friendly orthopedic braces and supports. The integration of 3D printing technology has revolutionized the manufacturing of orthotic splints, enabling precise, patient-specific fits that improve therapeutic outcomes and reduce the risk of skin irritation or pressure sores. Smart orthotics, incorporating embedded sensors, are emerging, offering real-time biomechanical data and activity tracking for personalized rehabilitation programs.
Key Drivers, Barriers & Challenges in Orthotic Devices
Key Drivers:
- Aging Population: Increasing prevalence of age-related musculoskeletal conditions like osteoarthritis and osteoporosis.
- Rising Chronic Diseases: Growing incidence of diabetes, cardiovascular diseases, and neurological disorders requiring orthotic intervention.
- Technological Advancements: Innovations in materials, 3D printing, and wearable sensors enabling personalized and advanced orthotics.
- Increased Sports Participation & Awareness: Growing demand for injury prevention and rehabilitation solutions in sports and fitness.
- Favorable Reimbursement Policies: Expanding insurance coverage for orthotic devices in developed markets.
Barriers & Challenges:
- High Cost of Advanced Orthotics: The premium pricing of personalized and smart orthotics can be a barrier for a significant portion of the population.
- Regulatory Hurdles: Stringent approval processes for new medical devices can lead to extended development timelines and increased costs.
- Limited Awareness in Emerging Markets: Lower awareness regarding the benefits and availability of advanced orthotic solutions in developing economies.
- Supply Chain Disruptions: Potential for disruptions in the supply of raw materials and finished goods, impacting production and availability.
- Competition from Non-Orthotic Therapies: Advancements in physical therapy, regenerative medicine, and surgical interventions can present indirect competition.
Emerging Opportunities in Orthotic Devices
Emerging opportunities in the orthotic devices market lie in the increasing demand for personalized and customized solutions, driven by advancements in 3D printing and digital scanning technologies. The integration of wearable technology and IoT into orthotics presents a significant avenue for growth, enabling real-time patient monitoring, remote rehabilitation, and data-driven treatment adjustments. Furthermore, the growing focus on preventive healthcare and sports medicine is creating a demand for lightweight, high-performance orthotics designed for athletes and active individuals. Untapped markets in emerging economies, with their growing middle class and improving healthcare infrastructure, offer substantial potential for market expansion. The development of affordable and accessible orthotic solutions for underserved populations is another key area of opportunity.
Growth Accelerators in the Orthotic Devices Industry
The orthotic devices industry is experiencing accelerated growth due to several catalysts. Technological breakthroughs, particularly in additive manufacturing, material science, and miniaturized sensor technology, are enabling the creation of more sophisticated, patient-centric orthotic solutions. Strategic partnerships between orthotic manufacturers, medical device companies, and research institutions are fostering innovation and accelerating product development cycles. Furthermore, market expansion strategies, including increased penetration into emerging economies and the development of direct-to-consumer models for certain orthotic products, are driving overall market growth. The increasing adoption of telehealth and remote patient monitoring also acts as a growth accelerator, creating new demand for connected orthotic devices.
Key Players Shaping the Orthotic Devices Market
- Alvimedica
- Saudi Pharmaceutical Industries & Medical Appliances Corporation
- Itamar Medical
- Alshifa Medical Syringes Manufacturing
- Jamjoon Hospital Supply
Notable Milestones in Orthotic Devices Sector
- 2019: Increased adoption of AI in custom orthotic design for enhanced precision.
- 2020: Emergence of advanced composite materials for lighter and stronger orthotic devices.
- 2021: Significant growth in the market for smart orthotics with integrated sensor technology.
- 2022: Expansion of 3D printing applications for mass customization of orthotic insoles and braces.
- 2023: Increased focus on sustainable manufacturing practices within the orthotics industry.
- 2024: Growing demand for orthotic solutions in geriatric care and sports rehabilitation.
In-Depth Orthotic Devices Market Outlook
The orthotic devices market is projected to maintain its upward trajectory, driven by sustained demand from an aging global population and a continuous influx of technological innovations. Growth accelerators such as advancements in 3D printing for personalized solutions and the integration of smart technologies for remote patient monitoring will continue to fuel market expansion. Strategic collaborations and a growing focus on preventive healthcare are expected to unlock further market potential. Emerging economies represent a significant frontier for future growth, where increasing healthcare expenditure and rising disposable incomes will drive demand for a wider range of orthotic products. Stakeholders who can effectively navigate regulatory landscapes, embrace technological innovation, and cater to the evolving needs of end-users are well-positioned for success in this dynamic market.
Orthotic Devices Segmentation
-
1. Application
- 1.1. Hospital
- 1.2. Specialty Clinic
- 1.3. Others
-
2. Type
- 2.1. Orthopedic Braces and Support
- 2.2. Orthotic Splints
Orthotic Devices Segmentation By Geography
-
1. North America
- 1.1. United States
- 1.2. Canada
- 1.3. Mexico
-
2. South America
- 2.1. Brazil
- 2.2. Argentina
- 2.3. Rest of South America
-
3. Europe
- 3.1. United Kingdom
- 3.2. Germany
- 3.3. France
- 3.4. Italy
- 3.5. Spain
- 3.6. Russia
- 3.7. Benelux
- 3.8. Nordics
- 3.9. Rest of Europe
-
4. Middle East & Africa
- 4.1. Turkey
- 4.2. Israel
- 4.3. GCC
- 4.4. North Africa
- 4.5. South Africa
- 4.6. Rest of Middle East & Africa
-
5. Asia Pacific
- 5.1. China
- 5.2. India
- 5.3. Japan
- 5.4. South Korea
- 5.5. ASEAN
- 5.6. Oceania
- 5.7. Rest of Asia Pacific
Orthotic Devices REPORT HIGHLIGHTS
| Aspects | Details |
|---|---|
| Study Period | 2019-2033 |
| Base Year | 2024 |
| Estimated Year | 2025 |
| Forecast Period | 2025-2033 |
| Historical Period | 2019-2024 |
| Growth Rate | CAGR of 4.2% from 2019-2033 |
| Segmentation |
|
Table of Contents
- 1. Introduction
- 1.1. Research Scope
- 1.2. Market Segmentation
- 1.3. Research Methodology
- 1.4. Definitions and Assumptions
- 2. Executive Summary
- 2.1. Introduction
- 3. Market Dynamics
- 3.1. Introduction
- 3.2. Market Drivers
- 3.3. Market Restrains
- 3.4. Market Trends
- 4. Market Factor Analysis
- 4.1. Porters Five Forces
- 4.2. Supply/Value Chain
- 4.3. PESTEL analysis
- 4.4. Market Entropy
- 4.5. Patent/Trademark Analysis
- 5. Global Orthotic Devices Analysis, Insights and Forecast, 2019-2031
- 5.1. Market Analysis, Insights and Forecast - by Application
- 5.1.1. Hospital
- 5.1.2. Specialty Clinic
- 5.1.3. Others
- 5.2. Market Analysis, Insights and Forecast - by Type
- 5.2.1. Orthopedic Braces and Support
- 5.2.2. Orthotic Splints
- 5.3. Market Analysis, Insights and Forecast - by Region
- 5.3.1. North America
- 5.3.2. South America
- 5.3.3. Europe
- 5.3.4. Middle East & Africa
- 5.3.5. Asia Pacific
- 5.1. Market Analysis, Insights and Forecast - by Application
- 6. North America Orthotic Devices Analysis, Insights and Forecast, 2019-2031
- 6.1. Market Analysis, Insights and Forecast - by Application
- 6.1.1. Hospital
- 6.1.2. Specialty Clinic
- 6.1.3. Others
- 6.2. Market Analysis, Insights and Forecast - by Type
- 6.2.1. Orthopedic Braces and Support
- 6.2.2. Orthotic Splints
- 6.1. Market Analysis, Insights and Forecast - by Application
- 7. South America Orthotic Devices Analysis, Insights and Forecast, 2019-2031
- 7.1. Market Analysis, Insights and Forecast - by Application
- 7.1.1. Hospital
- 7.1.2. Specialty Clinic
- 7.1.3. Others
- 7.2. Market Analysis, Insights and Forecast - by Type
- 7.2.1. Orthopedic Braces and Support
- 7.2.2. Orthotic Splints
- 7.1. Market Analysis, Insights and Forecast - by Application
- 8. Europe Orthotic Devices Analysis, Insights and Forecast, 2019-2031
- 8.1. Market Analysis, Insights and Forecast - by Application
- 8.1.1. Hospital
- 8.1.2. Specialty Clinic
- 8.1.3. Others
- 8.2. Market Analysis, Insights and Forecast - by Type
- 8.2.1. Orthopedic Braces and Support
- 8.2.2. Orthotic Splints
- 8.1. Market Analysis, Insights and Forecast - by Application
- 9. Middle East & Africa Orthotic Devices Analysis, Insights and Forecast, 2019-2031
- 9.1. Market Analysis, Insights and Forecast - by Application
- 9.1.1. Hospital
- 9.1.2. Specialty Clinic
- 9.1.3. Others
- 9.2. Market Analysis, Insights and Forecast - by Type
- 9.2.1. Orthopedic Braces and Support
- 9.2.2. Orthotic Splints
- 9.1. Market Analysis, Insights and Forecast - by Application
- 10. Asia Pacific Orthotic Devices Analysis, Insights and Forecast, 2019-2031
- 10.1. Market Analysis, Insights and Forecast - by Application
- 10.1.1. Hospital
- 10.1.2. Specialty Clinic
- 10.1.3. Others
- 10.2. Market Analysis, Insights and Forecast - by Type
- 10.2.1. Orthopedic Braces and Support
- 10.2.2. Orthotic Splints
- 10.1. Market Analysis, Insights and Forecast - by Application
- 11. Competitive Analysis
- 11.1. Global Market Share Analysis 2024
- 11.2. Company Profiles
- 11.2.1 Alvimedica
- 11.2.1.1. Overview
- 11.2.1.2. Products
- 11.2.1.3. SWOT Analysis
- 11.2.1.4. Recent Developments
- 11.2.1.5. Financials (Based on Availability)
- 11.2.2 Saudi Pharmaceutical Industries & Medical Appliances Corporation
- 11.2.2.1. Overview
- 11.2.2.2. Products
- 11.2.2.3. SWOT Analysis
- 11.2.2.4. Recent Developments
- 11.2.2.5. Financials (Based on Availability)
- 11.2.3 Itamar Medical
- 11.2.3.1. Overview
- 11.2.3.2. Products
- 11.2.3.3. SWOT Analysis
- 11.2.3.4. Recent Developments
- 11.2.3.5. Financials (Based on Availability)
- 11.2.4 Alshifa Medical Syringes Manufacturing
- 11.2.4.1. Overview
- 11.2.4.2. Products
- 11.2.4.3. SWOT Analysis
- 11.2.4.4. Recent Developments
- 11.2.4.5. Financials (Based on Availability)
- 11.2.5 Jamjoon Hospital Supply
- 11.2.5.1. Overview
- 11.2.5.2. Products
- 11.2.5.3. SWOT Analysis
- 11.2.5.4. Recent Developments
- 11.2.5.5. Financials (Based on Availability)
- 11.2.1 Alvimedica
List of Figures
- Figure 1: Global Orthotic Devices Revenue Breakdown (million, %) by Region 2024 & 2032
- Figure 2: Global Orthotic Devices Volume Breakdown (K, %) by Region 2024 & 2032
- Figure 3: North America Orthotic Devices Revenue (million), by Application 2024 & 2032
- Figure 4: North America Orthotic Devices Volume (K), by Application 2024 & 2032
- Figure 5: North America Orthotic Devices Revenue Share (%), by Application 2024 & 2032
- Figure 6: North America Orthotic Devices Volume Share (%), by Application 2024 & 2032
- Figure 7: North America Orthotic Devices Revenue (million), by Type 2024 & 2032
- Figure 8: North America Orthotic Devices Volume (K), by Type 2024 & 2032
- Figure 9: North America Orthotic Devices Revenue Share (%), by Type 2024 & 2032
- Figure 10: North America Orthotic Devices Volume Share (%), by Type 2024 & 2032
- Figure 11: North America Orthotic Devices Revenue (million), by Country 2024 & 2032
- Figure 12: North America Orthotic Devices Volume (K), by Country 2024 & 2032
- Figure 13: North America Orthotic Devices Revenue Share (%), by Country 2024 & 2032
- Figure 14: North America Orthotic Devices Volume Share (%), by Country 2024 & 2032
- Figure 15: South America Orthotic Devices Revenue (million), by Application 2024 & 2032
- Figure 16: South America Orthotic Devices Volume (K), by Application 2024 & 2032
- Figure 17: South America Orthotic Devices Revenue Share (%), by Application 2024 & 2032
- Figure 18: South America Orthotic Devices Volume Share (%), by Application 2024 & 2032
- Figure 19: South America Orthotic Devices Revenue (million), by Type 2024 & 2032
- Figure 20: South America Orthotic Devices Volume (K), by Type 2024 & 2032
- Figure 21: South America Orthotic Devices Revenue Share (%), by Type 2024 & 2032
- Figure 22: South America Orthotic Devices Volume Share (%), by Type 2024 & 2032
- Figure 23: South America Orthotic Devices Revenue (million), by Country 2024 & 2032
- Figure 24: South America Orthotic Devices Volume (K), by Country 2024 & 2032
- Figure 25: South America Orthotic Devices Revenue Share (%), by Country 2024 & 2032
- Figure 26: South America Orthotic Devices Volume Share (%), by Country 2024 & 2032
- Figure 27: Europe Orthotic Devices Revenue (million), by Application 2024 & 2032
- Figure 28: Europe Orthotic Devices Volume (K), by Application 2024 & 2032
- Figure 29: Europe Orthotic Devices Revenue Share (%), by Application 2024 & 2032
- Figure 30: Europe Orthotic Devices Volume Share (%), by Application 2024 & 2032
- Figure 31: Europe Orthotic Devices Revenue (million), by Type 2024 & 2032
- Figure 32: Europe Orthotic Devices Volume (K), by Type 2024 & 2032
- Figure 33: Europe Orthotic Devices Revenue Share (%), by Type 2024 & 2032
- Figure 34: Europe Orthotic Devices Volume Share (%), by Type 2024 & 2032
- Figure 35: Europe Orthotic Devices Revenue (million), by Country 2024 & 2032
- Figure 36: Europe Orthotic Devices Volume (K), by Country 2024 & 2032
- Figure 37: Europe Orthotic Devices Revenue Share (%), by Country 2024 & 2032
- Figure 38: Europe Orthotic Devices Volume Share (%), by Country 2024 & 2032
- Figure 39: Middle East & Africa Orthotic Devices Revenue (million), by Application 2024 & 2032
- Figure 40: Middle East & Africa Orthotic Devices Volume (K), by Application 2024 & 2032
- Figure 41: Middle East & Africa Orthotic Devices Revenue Share (%), by Application 2024 & 2032
- Figure 42: Middle East & Africa Orthotic Devices Volume Share (%), by Application 2024 & 2032
- Figure 43: Middle East & Africa Orthotic Devices Revenue (million), by Type 2024 & 2032
- Figure 44: Middle East & Africa Orthotic Devices Volume (K), by Type 2024 & 2032
- Figure 45: Middle East & Africa Orthotic Devices Revenue Share (%), by Type 2024 & 2032
- Figure 46: Middle East & Africa Orthotic Devices Volume Share (%), by Type 2024 & 2032
- Figure 47: Middle East & Africa Orthotic Devices Revenue (million), by Country 2024 & 2032
- Figure 48: Middle East & Africa Orthotic Devices Volume (K), by Country 2024 & 2032
- Figure 49: Middle East & Africa Orthotic Devices Revenue Share (%), by Country 2024 & 2032
- Figure 50: Middle East & Africa Orthotic Devices Volume Share (%), by Country 2024 & 2032
- Figure 51: Asia Pacific Orthotic Devices Revenue (million), by Application 2024 & 2032
- Figure 52: Asia Pacific Orthotic Devices Volume (K), by Application 2024 & 2032
- Figure 53: Asia Pacific Orthotic Devices Revenue Share (%), by Application 2024 & 2032
- Figure 54: Asia Pacific Orthotic Devices Volume Share (%), by Application 2024 & 2032
- Figure 55: Asia Pacific Orthotic Devices Revenue (million), by Type 2024 & 2032
- Figure 56: Asia Pacific Orthotic Devices Volume (K), by Type 2024 & 2032
- Figure 57: Asia Pacific Orthotic Devices Revenue Share (%), by Type 2024 & 2032
- Figure 58: Asia Pacific Orthotic Devices Volume Share (%), by Type 2024 & 2032
- Figure 59: Asia Pacific Orthotic Devices Revenue (million), by Country 2024 & 2032
- Figure 60: Asia Pacific Orthotic Devices Volume (K), by Country 2024 & 2032
- Figure 61: Asia Pacific Orthotic Devices Revenue Share (%), by Country 2024 & 2032
- Figure 62: Asia Pacific Orthotic Devices Volume Share (%), by Country 2024 & 2032
List of Tables
- Table 1: Global Orthotic Devices Revenue million Forecast, by Region 2019 & 2032
- Table 2: Global Orthotic Devices Volume K Forecast, by Region 2019 & 2032
- Table 3: Global Orthotic Devices Revenue million Forecast, by Application 2019 & 2032
- Table 4: Global Orthotic Devices Volume K Forecast, by Application 2019 & 2032
- Table 5: Global Orthotic Devices Revenue million Forecast, by Type 2019 & 2032
- Table 6: Global Orthotic Devices Volume K Forecast, by Type 2019 & 2032
- Table 7: Global Orthotic Devices Revenue million Forecast, by Region 2019 & 2032
- Table 8: Global Orthotic Devices Volume K Forecast, by Region 2019 & 2032
- Table 9: Global Orthotic Devices Revenue million Forecast, by Application 2019 & 2032
- Table 10: Global Orthotic Devices Volume K Forecast, by Application 2019 & 2032
- Table 11: Global Orthotic Devices Revenue million Forecast, by Type 2019 & 2032
- Table 12: Global Orthotic Devices Volume K Forecast, by Type 2019 & 2032
- Table 13: Global Orthotic Devices Revenue million Forecast, by Country 2019 & 2032
- Table 14: Global Orthotic Devices Volume K Forecast, by Country 2019 & 2032
- Table 15: United States Orthotic Devices Revenue (million) Forecast, by Application 2019 & 2032
- Table 16: United States Orthotic Devices Volume (K) Forecast, by Application 2019 & 2032
- Table 17: Canada Orthotic Devices Revenue (million) Forecast, by Application 2019 & 2032
- Table 18: Canada Orthotic Devices Volume (K) Forecast, by Application 2019 & 2032
- Table 19: Mexico Orthotic Devices Revenue (million) Forecast, by Application 2019 & 2032
- Table 20: Mexico Orthotic Devices Volume (K) Forecast, by Application 2019 & 2032
- Table 21: Global Orthotic Devices Revenue million Forecast, by Application 2019 & 2032
- Table 22: Global Orthotic Devices Volume K Forecast, by Application 2019 & 2032
- Table 23: Global Orthotic Devices Revenue million Forecast, by Type 2019 & 2032
- Table 24: Global Orthotic Devices Volume K Forecast, by Type 2019 & 2032
- Table 25: Global Orthotic Devices Revenue million Forecast, by Country 2019 & 2032
- Table 26: Global Orthotic Devices Volume K Forecast, by Country 2019 & 2032
- Table 27: Brazil Orthotic Devices Revenue (million) Forecast, by Application 2019 & 2032
- Table 28: Brazil Orthotic Devices Volume (K) Forecast, by Application 2019 & 2032
- Table 29: Argentina Orthotic Devices Revenue (million) Forecast, by Application 2019 & 2032
- Table 30: Argentina Orthotic Devices Volume (K) Forecast, by Application 2019 & 2032
- Table 31: Rest of South America Orthotic Devices Revenue (million) Forecast, by Application 2019 & 2032
- Table 32: Rest of South America Orthotic Devices Volume (K) Forecast, by Application 2019 & 2032
- Table 33: Global Orthotic Devices Revenue million Forecast, by Application 2019 & 2032
- Table 34: Global Orthotic Devices Volume K Forecast, by Application 2019 & 2032
- Table 35: Global Orthotic Devices Revenue million Forecast, by Type 2019 & 2032
- Table 36: Global Orthotic Devices Volume K Forecast, by Type 2019 & 2032
- Table 37: Global Orthotic Devices Revenue million Forecast, by Country 2019 & 2032
- Table 38: Global Orthotic Devices Volume K Forecast, by Country 2019 & 2032
- Table 39: United Kingdom Orthotic Devices Revenue (million) Forecast, by Application 2019 & 2032
- Table 40: United Kingdom Orthotic Devices Volume (K) Forecast, by Application 2019 & 2032
- Table 41: Germany Orthotic Devices Revenue (million) Forecast, by Application 2019 & 2032
- Table 42: Germany Orthotic Devices Volume (K) Forecast, by Application 2019 & 2032
- Table 43: France Orthotic Devices Revenue (million) Forecast, by Application 2019 & 2032
- Table 44: France Orthotic Devices Volume (K) Forecast, by Application 2019 & 2032
- Table 45: Italy Orthotic Devices Revenue (million) Forecast, by Application 2019 & 2032
- Table 46: Italy Orthotic Devices Volume (K) Forecast, by Application 2019 & 2032
- Table 47: Spain Orthotic Devices Revenue (million) Forecast, by Application 2019 & 2032
- Table 48: Spain Orthotic Devices Volume (K) Forecast, by Application 2019 & 2032
- Table 49: Russia Orthotic Devices Revenue (million) Forecast, by Application 2019 & 2032
- Table 50: Russia Orthotic Devices Volume (K) Forecast, by Application 2019 & 2032
- Table 51: Benelux Orthotic Devices Revenue (million) Forecast, by Application 2019 & 2032
- Table 52: Benelux Orthotic Devices Volume (K) Forecast, by Application 2019 & 2032
- Table 53: Nordics Orthotic Devices Revenue (million) Forecast, by Application 2019 & 2032
- Table 54: Nordics Orthotic Devices Volume (K) Forecast, by Application 2019 & 2032
- Table 55: Rest of Europe Orthotic Devices Revenue (million) Forecast, by Application 2019 & 2032
- Table 56: Rest of Europe Orthotic Devices Volume (K) Forecast, by Application 2019 & 2032
- Table 57: Global Orthotic Devices Revenue million Forecast, by Application 2019 & 2032
- Table 58: Global Orthotic Devices Volume K Forecast, by Application 2019 & 2032
- Table 59: Global Orthotic Devices Revenue million Forecast, by Type 2019 & 2032
- Table 60: Global Orthotic Devices Volume K Forecast, by Type 2019 & 2032
- Table 61: Global Orthotic Devices Revenue million Forecast, by Country 2019 & 2032
- Table 62: Global Orthotic Devices Volume K Forecast, by Country 2019 & 2032
- Table 63: Turkey Orthotic Devices Revenue (million) Forecast, by Application 2019 & 2032
- Table 64: Turkey Orthotic Devices Volume (K) Forecast, by Application 2019 & 2032
- Table 65: Israel Orthotic Devices Revenue (million) Forecast, by Application 2019 & 2032
- Table 66: Israel Orthotic Devices Volume (K) Forecast, by Application 2019 & 2032
- Table 67: GCC Orthotic Devices Revenue (million) Forecast, by Application 2019 & 2032
- Table 68: GCC Orthotic Devices Volume (K) Forecast, by Application 2019 & 2032
- Table 69: North Africa Orthotic Devices Revenue (million) Forecast, by Application 2019 & 2032
- Table 70: North Africa Orthotic Devices Volume (K) Forecast, by Application 2019 & 2032
- Table 71: South Africa Orthotic Devices Revenue (million) Forecast, by Application 2019 & 2032
- Table 72: South Africa Orthotic Devices Volume (K) Forecast, by Application 2019 & 2032
- Table 73: Rest of Middle East & Africa Orthotic Devices Revenue (million) Forecast, by Application 2019 & 2032
- Table 74: Rest of Middle East & Africa Orthotic Devices Volume (K) Forecast, by Application 2019 & 2032
- Table 75: Global Orthotic Devices Revenue million Forecast, by Application 2019 & 2032
- Table 76: Global Orthotic Devices Volume K Forecast, by Application 2019 & 2032
- Table 77: Global Orthotic Devices Revenue million Forecast, by Type 2019 & 2032
- Table 78: Global Orthotic Devices Volume K Forecast, by Type 2019 & 2032
- Table 79: Global Orthotic Devices Revenue million Forecast, by Country 2019 & 2032
- Table 80: Global Orthotic Devices Volume K Forecast, by Country 2019 & 2032
- Table 81: China Orthotic Devices Revenue (million) Forecast, by Application 2019 & 2032
- Table 82: China Orthotic Devices Volume (K) Forecast, by Application 2019 & 2032
- Table 83: India Orthotic Devices Revenue (million) Forecast, by Application 2019 & 2032
- Table 84: India Orthotic Devices Volume (K) Forecast, by Application 2019 & 2032
- Table 85: Japan Orthotic Devices Revenue (million) Forecast, by Application 2019 & 2032
- Table 86: Japan Orthotic Devices Volume (K) Forecast, by Application 2019 & 2032
- Table 87: South Korea Orthotic Devices Revenue (million) Forecast, by Application 2019 & 2032
- Table 88: South Korea Orthotic Devices Volume (K) Forecast, by Application 2019 & 2032
- Table 89: ASEAN Orthotic Devices Revenue (million) Forecast, by Application 2019 & 2032
- Table 90: ASEAN Orthotic Devices Volume (K) Forecast, by Application 2019 & 2032
- Table 91: Oceania Orthotic Devices Revenue (million) Forecast, by Application 2019 & 2032
- Table 92: Oceania Orthotic Devices Volume (K) Forecast, by Application 2019 & 2032
- Table 93: Rest of Asia Pacific Orthotic Devices Revenue (million) Forecast, by Application 2019 & 2032
- Table 94: Rest of Asia Pacific Orthotic Devices Volume (K) Forecast, by Application 2019 & 2032
Frequently Asked Questions
1. What is the projected Compound Annual Growth Rate (CAGR) of the Orthotic Devices?
The projected CAGR is approximately 4.2%.
2. Which companies are prominent players in the Orthotic Devices?
Key companies in the market include Alvimedica, Saudi Pharmaceutical Industries & Medical Appliances Corporation, Itamar Medical, Alshifa Medical Syringes Manufacturing, Jamjoon Hospital Supply.
3. What are the main segments of the Orthotic Devices?
The market segments include Application, Type.
4. Can you provide details about the market size?
The market size is estimated to be USD 522 million as of 2022.
5. What are some drivers contributing to market growth?
N/A
6. What are the notable trends driving market growth?
N/A
7. Are there any restraints impacting market growth?
N/A
8. Can you provide examples of recent developments in the market?
N/A
9. What pricing options are available for accessing the report?
Pricing options include single-user, multi-user, and enterprise licenses priced at USD 3950.00, USD 5925.00, and USD 7900.00 respectively.
10. Is the market size provided in terms of value or volume?
The market size is provided in terms of value, measured in million and volume, measured in K.
11. Are there any specific market keywords associated with the report?
Yes, the market keyword associated with the report is "Orthotic Devices," which aids in identifying and referencing the specific market segment covered.
12. How do I determine which pricing option suits my needs best?
The pricing options vary based on user requirements and access needs. Individual users may opt for single-user licenses, while businesses requiring broader access may choose multi-user or enterprise licenses for cost-effective access to the report.
13. Are there any additional resources or data provided in the Orthotic Devices report?
While the report offers comprehensive insights, it's advisable to review the specific contents or supplementary materials provided to ascertain if additional resources or data are available.
14. How can I stay updated on further developments or reports in the Orthotic Devices?
To stay informed about further developments, trends, and reports in the Orthotic Devices, consider subscribing to industry newsletters, following relevant companies and organizations, or regularly checking reputable industry news sources and publications.
Methodology
Step 1 - Identification of Relevant Samples Size from Population Database


Step 2 - Approaches for Defining Global Market Size (Value, Volume* & Price*)

Note*: In applicable scenarios
Step 3 - Data Sources
Primary Research
- Web Analytics
- Survey Reports
- Research Institute
- Latest Research Reports
- Opinion Leaders
Secondary Research
- Annual Reports
- White Paper
- Latest Press Release
- Industry Association
- Paid Database
- Investor Presentations

Step 4 - Data Triangulation
Involves using different sources of information in order to increase the validity of a study
These sources are likely to be stakeholders in a program - participants, other researchers, program staff, other community members, and so on.
Then we put all data in single framework & apply various statistical tools to find out the dynamic on the market.
During the analysis stage, feedback from the stakeholder groups would be compared to determine areas of agreement as well as areas of divergence
