

Key Insights
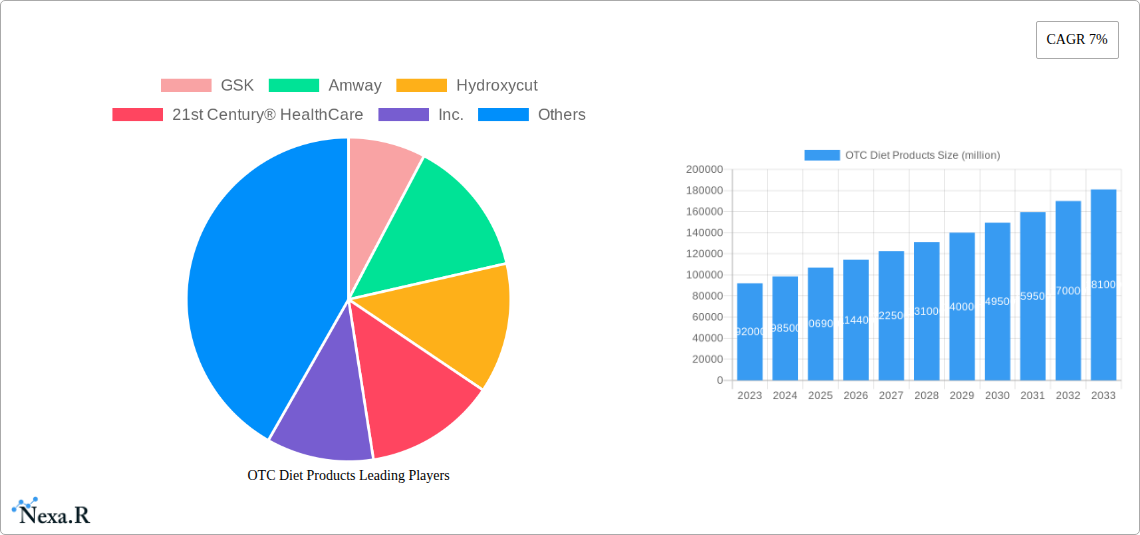
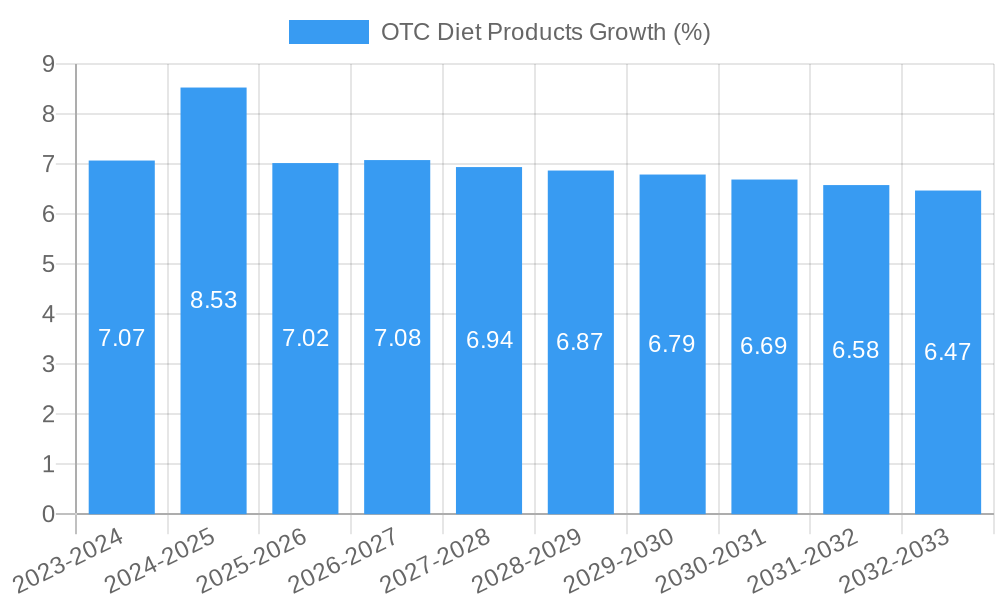
The global market for Over-the-Counter (OTC) Diet Products is poised for robust expansion, projected to reach an estimated USD 106,900 million by 2025. This substantial market size underscores the significant consumer demand for accessible weight management solutions. The industry is expected to witness a Compound Annual Growth Rate (CAGR) of 7% between 2019 and 2033, indicating sustained and healthy growth throughout the forecast period. This growth is primarily driven by a confluence of factors, including the increasing prevalence of obesity and related health concerns globally, coupled with a growing consumer awareness and proactive approach towards health and wellness. The convenience and accessibility offered by OTC products, bypassing the need for prescriptions, further fuel their adoption. Evolving consumer lifestyles, characterized by busy schedules and a preference for self-directed health management, are also significant contributors to market expansion. Furthermore, the continuous innovation in product formulations, focusing on natural ingredients and scientifically backed efficacy, is attracting a broader consumer base and fostering market vitality.
The market segmentation reveals a dynamic landscape with diverse distribution channels and product types catering to varied consumer needs. Online sales are emerging as a dominant channel, driven by the ease of access, wider product selection, and competitive pricing offered by e-commerce platforms. Drugstores and weight loss agencies also play a crucial role, providing personalized recommendations and immediate availability. Within product types, Over-the-Counter Weight Loss Pills and Over-the-Counter Diet Supplements represent the core offerings. The increasing adoption of these products is also influenced by significant investment in marketing and product development by leading players such as GSK, Amway, and Herbalife International. Emerging trends also point towards a greater emphasis on personalized nutrition and the integration of digital tools for tracking and support, which are likely to shape future market dynamics. Despite the strong growth trajectory, certain restraints such as stringent regulatory scrutiny and the need for consumer education regarding product efficacy and safety may present challenges. However, the overarching trends of health consciousness and the demand for convenient weight management solutions indicate a bright outlook for the OTC Diet Products market.
OTC Diet Products Market Analysis Report: Navigating Growth in the Health & Wellness Sector
This comprehensive report offers an in-depth analysis of the global Over-the-Counter (OTC) Diet Products market, a dynamic segment within the broader health and wellness industry. Covering the historical period from 2019 to 2024 and extending through a robust forecast period of 2025–2033, with a base year of 2025, this study provides critical insights for stakeholders seeking to capitalize on evolving consumer demands and industry trends. We delve into market dynamics, growth drivers, regional dominance, product innovation, and the competitive landscape, offering actionable intelligence for strategic decision-making.
OTC Diet Products Market Dynamics & Structure
The Over-the-Counter (OTC) Diet Products market exhibits a moderately concentrated structure, with key players like GSK, Amway, and Hydroxycut holding significant market shares. Technological innovation is a major driver, fueled by advancements in ingredient research, formulation science, and delivery systems aimed at enhancing efficacy and consumer appeal. Regulatory frameworks, including stringent FDA approvals and labeling requirements in major markets, play a crucial role in shaping market entry and product development. Competitive product substitutes, ranging from prescription weight loss medications to emerging wellness technologies, present a constant challenge, forcing manufacturers to focus on differentiation through product benefits and marketing. End-user demographics are increasingly shifting towards health-conscious millennials and Gen Z consumers actively seeking convenient and accessible weight management solutions. Mergers and acquisitions (M&A) are a notable trend, with larger entities acquiring smaller, innovative brands to expand their portfolios and market reach.
- Market Concentration: Moderate, with top players dominating, but ample room for specialized brands.
- Technological Innovation Drivers: Novel ingredient discovery, improved bioavailability, and sustainable sourcing.
- Regulatory Frameworks: Strict adherence to FDA and equivalent international bodies is paramount.
- Competitive Substitutes: Prescription drugs, bariatric surgery, and digital health platforms.
- End-User Demographics: Growing influence of younger, digitally-savvy consumers seeking holistic wellness.
- M&A Trends: Consolidation through acquisitions of niche brands by established giants.
OTC Diet Products Growth Trends & Insights
The OTC Diet Products market is experiencing robust growth, projected to expand significantly from its historical valuation in the tens of billions of dollars in 2024 to hundreds of billions of dollars by 2033. The Compound Annual Growth Rate (CAGR) is estimated at a healthy XX% during the forecast period. Adoption rates are steadily increasing, driven by heightened consumer awareness of health and wellness issues, coupled with the accessibility and affordability of OTC options. Technological disruptions, including the integration of AI in product development and personalized nutrition recommendations, are further accelerating market penetration. Consumer behavior shifts towards proactive health management and a preference for natural or plant-based ingredients are shaping product development and marketing strategies. The parent market, encompassing the broader health and wellness sector, provides a strong foundation for this growth, with the child market of OTC diet products benefiting from spillover effects and a dedicated consumer base. The increasing prevalence of obesity and related health conditions globally serves as a fundamental driver for sustained demand.
- Market Size Evolution: From tens of billions of dollars in 2024 to an estimated hundreds of billions of dollars by 2033.
- CAGR: Projected at XX% between 2025 and 2033.
- Adoption Rates: Rising due to increased health consciousness and product accessibility.
- Technological Disruptions: AI-driven formulation, personalized nutrition, and advanced ingredient sourcing.
- Consumer Behavior Shifts: Focus on preventive health, natural ingredients, and sustainable practices.
- Parent Market Influence: The expansive health and wellness sector supports the growth of OTC diet products.
- Child Market Dynamics: Dedicated consumer base seeking specialized weight management solutions.
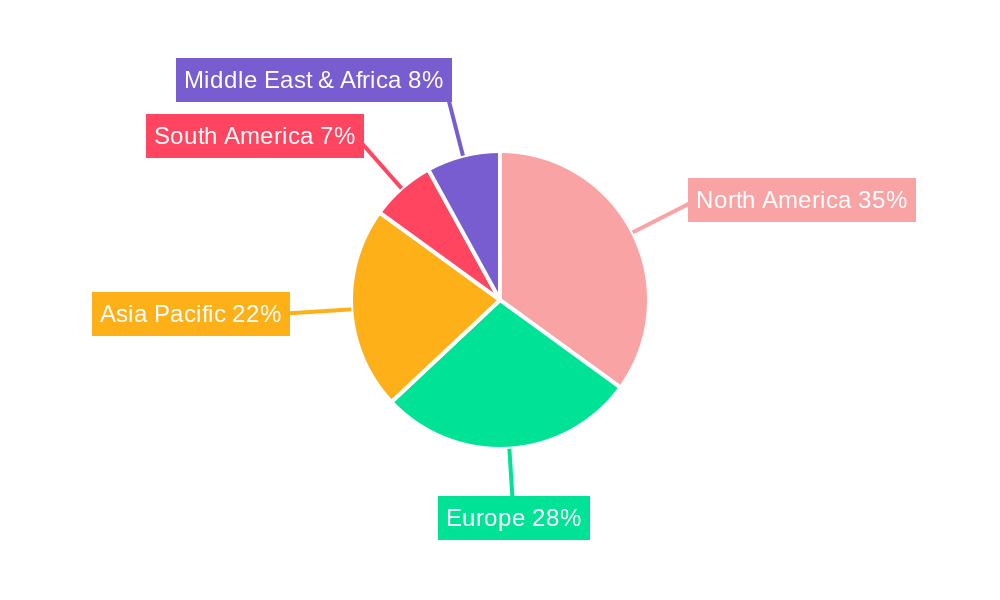
Dominant Regions, Countries, or Segments in OTC Diet Products
North America, particularly the United States, currently dominates the OTC Diet Products market, driven by a large and health-conscious consumer base, high disposable incomes, and a well-established retail infrastructure for health and wellness products. The Drugstore segment, accounting for approximately XX% of the market share in 2025, remains a primary distribution channel due to its convenience and accessibility. However, Online Sales are experiencing rapid growth, projected to capture XX% of the market by 2033, fueled by e-commerce expansion and direct-to-consumer strategies. The Over-the-Counter Weight Loss Pill type segment, representing XX% of the market, is the leading product category, followed closely by Over-the-Counter Diet Supplements at XX%. Economic policies supporting healthcare and wellness initiatives, coupled with robust marketing campaigns by key players, contribute to regional dominance.
- Dominant Region: North America, led by the United States.
- Leading Application Segment: Drugstore, accounting for XX% in 2025, with Online Sales projected to reach XX% by 2033.
- Leading Product Type: Over-the-Counter Weight Loss Pills, representing XX% of the market.
- Key Growth Drivers: Consumer spending power, health awareness, and strong retail/online presence.
- Market Share & Growth Potential: North America holds the largest share, with Asia-Pacific showing significant growth potential.
OTC Diet Products Product Landscape
The OTC Diet Products market is characterized by a continuous stream of product innovations designed to meet diverse consumer needs. Key advancements include the development of novel, science-backed formulations featuring ingredients like Garcinia Cambogia, Green Tea Extract, and Conjugated Linoleic Acid (CLA), aimed at boosting metabolism and suppressing appetite. Product applications range from single-ingredient supplements to comprehensive multi-ingredient solutions offering synergistic benefits. Performance metrics are increasingly focused on ingredient efficacy, purity, and bioavailability, supported by clinical studies and third-party certifications. Unique selling propositions often highlight natural sourcing, plant-based formulations, gluten-free options, and specific dietary compatibility (e.g., keto-friendly). Technological advancements in encapsulation and delivery systems are improving the absorption rates and overall effectiveness of these products, setting them apart in a competitive marketplace.
Key Drivers, Barriers & Challenges in OTC Diet Products
The OTC Diet Products market is propelled by several key drivers, including a growing global emphasis on public health and preventative care, leading to increased consumer interest in weight management solutions. The rising prevalence of obesity and related chronic diseases acts as a significant demand generator. Technological advancements in ingredient research and product formulation offer more effective and appealing options. Furthermore, the convenience and accessibility of OTC products compared to prescription alternatives are crucial growth accelerators.
However, the market faces several significant barriers and challenges. Stringent and evolving regulatory landscapes across different countries can create hurdles for product approvals and marketing. Intense competition from established brands and new market entrants, coupled with the availability of substitute products, necessitates continuous innovation and effective marketing strategies. Supply chain disruptions, ingredient sourcing complexities, and concerns regarding product safety and efficacy can also pose challenges. Consumer skepticism due to past product failures or misleading claims requires brands to build trust through transparency and scientific backing.
Emerging Opportunities in OTC Diet Products
Emerging opportunities in the OTC Diet Products industry lie in the development of personalized nutrition solutions leveraging advanced diagnostics and AI. Untapped markets in developing economies with rising disposable incomes and increasing health consciousness present significant expansion potential. Innovative applications focusing on holistic wellness, including stress management and sleep improvement, alongside weight management, are gaining traction. Evolving consumer preferences for sustainable and ethically sourced ingredients, coupled with a demand for transparent labeling and clean product formulations, offer a distinct competitive advantage. The integration of smart packaging and digital platforms for tracking progress and providing personalized guidance also represents a promising avenue.
Growth Accelerators in the OTC Diet Products Industry
Several catalysts are accelerating long-term growth in the OTC Diet Products industry. Technological breakthroughs in the discovery and synthesis of novel active ingredients with enhanced efficacy and safety profiles are paramount. Strategic partnerships between supplement manufacturers, research institutions, and technology companies are fostering innovation and accelerating product development cycles. Market expansion strategies, including penetration into underserved geographical regions and the diversification of product portfolios to cater to niche consumer segments (e.g., pregnant women, athletes), are driving sustained growth. The increasing demand for scientifically validated products, supported by robust clinical trials and endorsements from health professionals, is also a significant growth accelerator.
Key Players Shaping the OTC Diet Products Market
- GSK
- Amway
- Hydroxycut
- 21st Century® HealthCare, Inc.
- Herbalife International
- Bluebonnet Nutrition
- ESTEEM MD
- Absolute Nutrition
- Revolution
- BSN
- MuscleTech
- Applied Nutriceuticals
- Genesis Today
Notable Milestones in OTC Diet Products Sector
- 2019: Increased focus on plant-based and vegan diet supplements.
- 2020: Surge in online sales and direct-to-consumer marketing due to global health events.
- 2021: Introduction of innovative ingredient combinations for enhanced metabolic support.
- 2022: Greater emphasis on sustainable sourcing and eco-friendly packaging.
- 2023: Advancements in personalized nutrition platforms influencing supplement development.
- 2024: Growing consumer demand for clinically supported efficacy and transparency.
In-Depth OTC Diet Products Market Outlook
The outlook for the OTC Diet Products market remains exceptionally strong, underpinned by enduring growth accelerators. The increasing demand for convenient and accessible weight management solutions, coupled with a global shift towards proactive health and wellness, will continue to fuel market expansion. Innovations in product formulation, driven by scientific research and consumer demand for natural and effective ingredients, will pave the way for new product launches. Strategic partnerships and market expansion into emerging economies present significant opportunities for revenue growth. The industry is poised for sustained growth, driven by its ability to adapt to evolving consumer preferences and technological advancements, making it an attractive sector for investment and development.
OTC Diet Products Segmentation
-
1. Application
- 1.1. Drugstore
- 1.2. Online Sales
- 1.3. Weight Loss Agency
- 1.4. Other
-
2. Types
- 2.1. Over-the-Counter Weight Loss Pill
- 2.2. Over-the-Counter Diet Supplements
OTC Diet Products Segmentation By Geography
-
1. North America
- 1.1. United States
- 1.2. Canada
- 1.3. Mexico
-
2. South America
- 2.1. Brazil
- 2.2. Argentina
- 2.3. Rest of South America
-
3. Europe
- 3.1. United Kingdom
- 3.2. Germany
- 3.3. France
- 3.4. Italy
- 3.5. Spain
- 3.6. Russia
- 3.7. Benelux
- 3.8. Nordics
- 3.9. Rest of Europe
-
4. Middle East & Africa
- 4.1. Turkey
- 4.2. Israel
- 4.3. GCC
- 4.4. North Africa
- 4.5. South Africa
- 4.6. Rest of Middle East & Africa
-
5. Asia Pacific
- 5.1. China
- 5.2. India
- 5.3. Japan
- 5.4. South Korea
- 5.5. ASEAN
- 5.6. Oceania
- 5.7. Rest of Asia Pacific
OTC Diet Products REPORT HIGHLIGHTS
| Aspects | Details |
|---|---|
| Study Period | 2019-2033 |
| Base Year | 2024 |
| Estimated Year | 2025 |
| Forecast Period | 2025-2033 |
| Historical Period | 2019-2024 |
| Growth Rate | CAGR of 7% from 2019-2033 |
| Segmentation |
|
Table of Contents
- 1. Introduction
- 1.1. Research Scope
- 1.2. Market Segmentation
- 1.3. Research Methodology
- 1.4. Definitions and Assumptions
- 2. Executive Summary
- 2.1. Introduction
- 3. Market Dynamics
- 3.1. Introduction
- 3.2. Market Drivers
- 3.3. Market Restrains
- 3.4. Market Trends
- 4. Market Factor Analysis
- 4.1. Porters Five Forces
- 4.2. Supply/Value Chain
- 4.3. PESTEL analysis
- 4.4. Market Entropy
- 4.5. Patent/Trademark Analysis
- 5. Global OTC Diet Products Analysis, Insights and Forecast, 2019-2031
- 5.1. Market Analysis, Insights and Forecast - by Application
- 5.1.1. Drugstore
- 5.1.2. Online Sales
- 5.1.3. Weight Loss Agency
- 5.1.4. Other
- 5.2. Market Analysis, Insights and Forecast - by Types
- 5.2.1. Over-the-Counter Weight Loss Pill
- 5.2.2. Over-the-Counter Diet Supplements
- 5.3. Market Analysis, Insights and Forecast - by Region
- 5.3.1. North America
- 5.3.2. South America
- 5.3.3. Europe
- 5.3.4. Middle East & Africa
- 5.3.5. Asia Pacific
- 5.1. Market Analysis, Insights and Forecast - by Application
- 6. North America OTC Diet Products Analysis, Insights and Forecast, 2019-2031
- 6.1. Market Analysis, Insights and Forecast - by Application
- 6.1.1. Drugstore
- 6.1.2. Online Sales
- 6.1.3. Weight Loss Agency
- 6.1.4. Other
- 6.2. Market Analysis, Insights and Forecast - by Types
- 6.2.1. Over-the-Counter Weight Loss Pill
- 6.2.2. Over-the-Counter Diet Supplements
- 6.1. Market Analysis, Insights and Forecast - by Application
- 7. South America OTC Diet Products Analysis, Insights and Forecast, 2019-2031
- 7.1. Market Analysis, Insights and Forecast - by Application
- 7.1.1. Drugstore
- 7.1.2. Online Sales
- 7.1.3. Weight Loss Agency
- 7.1.4. Other
- 7.2. Market Analysis, Insights and Forecast - by Types
- 7.2.1. Over-the-Counter Weight Loss Pill
- 7.2.2. Over-the-Counter Diet Supplements
- 7.1. Market Analysis, Insights and Forecast - by Application
- 8. Europe OTC Diet Products Analysis, Insights and Forecast, 2019-2031
- 8.1. Market Analysis, Insights and Forecast - by Application
- 8.1.1. Drugstore
- 8.1.2. Online Sales
- 8.1.3. Weight Loss Agency
- 8.1.4. Other
- 8.2. Market Analysis, Insights and Forecast - by Types
- 8.2.1. Over-the-Counter Weight Loss Pill
- 8.2.2. Over-the-Counter Diet Supplements
- 8.1. Market Analysis, Insights and Forecast - by Application
- 9. Middle East & Africa OTC Diet Products Analysis, Insights and Forecast, 2019-2031
- 9.1. Market Analysis, Insights and Forecast - by Application
- 9.1.1. Drugstore
- 9.1.2. Online Sales
- 9.1.3. Weight Loss Agency
- 9.1.4. Other
- 9.2. Market Analysis, Insights and Forecast - by Types
- 9.2.1. Over-the-Counter Weight Loss Pill
- 9.2.2. Over-the-Counter Diet Supplements
- 9.1. Market Analysis, Insights and Forecast - by Application
- 10. Asia Pacific OTC Diet Products Analysis, Insights and Forecast, 2019-2031
- 10.1. Market Analysis, Insights and Forecast - by Application
- 10.1.1. Drugstore
- 10.1.2. Online Sales
- 10.1.3. Weight Loss Agency
- 10.1.4. Other
- 10.2. Market Analysis, Insights and Forecast - by Types
- 10.2.1. Over-the-Counter Weight Loss Pill
- 10.2.2. Over-the-Counter Diet Supplements
- 10.1. Market Analysis, Insights and Forecast - by Application
- 11. Competitive Analysis
- 11.1. Global Market Share Analysis 2024
- 11.2. Company Profiles
- 11.2.1 GSK
- 11.2.1.1. Overview
- 11.2.1.2. Products
- 11.2.1.3. SWOT Analysis
- 11.2.1.4. Recent Developments
- 11.2.1.5. Financials (Based on Availability)
- 11.2.2 Amway
- 11.2.2.1. Overview
- 11.2.2.2. Products
- 11.2.2.3. SWOT Analysis
- 11.2.2.4. Recent Developments
- 11.2.2.5. Financials (Based on Availability)
- 11.2.3 Hydroxycut
- 11.2.3.1. Overview
- 11.2.3.2. Products
- 11.2.3.3. SWOT Analysis
- 11.2.3.4. Recent Developments
- 11.2.3.5. Financials (Based on Availability)
- 11.2.4 21st Century® HealthCare
- 11.2.4.1. Overview
- 11.2.4.2. Products
- 11.2.4.3. SWOT Analysis
- 11.2.4.4. Recent Developments
- 11.2.4.5. Financials (Based on Availability)
- 11.2.5 Inc.
- 11.2.5.1. Overview
- 11.2.5.2. Products
- 11.2.5.3. SWOT Analysis
- 11.2.5.4. Recent Developments
- 11.2.5.5. Financials (Based on Availability)
- 11.2.6 Herbalife International
- 11.2.6.1. Overview
- 11.2.6.2. Products
- 11.2.6.3. SWOT Analysis
- 11.2.6.4. Recent Developments
- 11.2.6.5. Financials (Based on Availability)
- 11.2.7 Bluebonnet Nutrition
- 11.2.7.1. Overview
- 11.2.7.2. Products
- 11.2.7.3. SWOT Analysis
- 11.2.7.4. Recent Developments
- 11.2.7.5. Financials (Based on Availability)
- 11.2.8 ESTEEM MD
- 11.2.8.1. Overview
- 11.2.8.2. Products
- 11.2.8.3. SWOT Analysis
- 11.2.8.4. Recent Developments
- 11.2.8.5. Financials (Based on Availability)
- 11.2.9 Absolute Nutrition
- 11.2.9.1. Overview
- 11.2.9.2. Products
- 11.2.9.3. SWOT Analysis
- 11.2.9.4. Recent Developments
- 11.2.9.5. Financials (Based on Availability)
- 11.2.10 Revolution
- 11.2.10.1. Overview
- 11.2.10.2. Products
- 11.2.10.3. SWOT Analysis
- 11.2.10.4. Recent Developments
- 11.2.10.5. Financials (Based on Availability)
- 11.2.11 BSN
- 11.2.11.1. Overview
- 11.2.11.2. Products
- 11.2.11.3. SWOT Analysis
- 11.2.11.4. Recent Developments
- 11.2.11.5. Financials (Based on Availability)
- 11.2.12 MuscleTech
- 11.2.12.1. Overview
- 11.2.12.2. Products
- 11.2.12.3. SWOT Analysis
- 11.2.12.4. Recent Developments
- 11.2.12.5. Financials (Based on Availability)
- 11.2.13 Applied Nutriceuticals
- 11.2.13.1. Overview
- 11.2.13.2. Products
- 11.2.13.3. SWOT Analysis
- 11.2.13.4. Recent Developments
- 11.2.13.5. Financials (Based on Availability)
- 11.2.14 Genesis Today
- 11.2.14.1. Overview
- 11.2.14.2. Products
- 11.2.14.3. SWOT Analysis
- 11.2.14.4. Recent Developments
- 11.2.14.5. Financials (Based on Availability)
- 11.2.1 GSK
List of Figures
- Figure 1: Global OTC Diet Products Revenue Breakdown (million, %) by Region 2024 & 2032
- Figure 2: North America OTC Diet Products Revenue (million), by Application 2024 & 2032
- Figure 3: North America OTC Diet Products Revenue Share (%), by Application 2024 & 2032
- Figure 4: North America OTC Diet Products Revenue (million), by Types 2024 & 2032
- Figure 5: North America OTC Diet Products Revenue Share (%), by Types 2024 & 2032
- Figure 6: North America OTC Diet Products Revenue (million), by Country 2024 & 2032
- Figure 7: North America OTC Diet Products Revenue Share (%), by Country 2024 & 2032
- Figure 8: South America OTC Diet Products Revenue (million), by Application 2024 & 2032
- Figure 9: South America OTC Diet Products Revenue Share (%), by Application 2024 & 2032
- Figure 10: South America OTC Diet Products Revenue (million), by Types 2024 & 2032
- Figure 11: South America OTC Diet Products Revenue Share (%), by Types 2024 & 2032
- Figure 12: South America OTC Diet Products Revenue (million), by Country 2024 & 2032
- Figure 13: South America OTC Diet Products Revenue Share (%), by Country 2024 & 2032
- Figure 14: Europe OTC Diet Products Revenue (million), by Application 2024 & 2032
- Figure 15: Europe OTC Diet Products Revenue Share (%), by Application 2024 & 2032
- Figure 16: Europe OTC Diet Products Revenue (million), by Types 2024 & 2032
- Figure 17: Europe OTC Diet Products Revenue Share (%), by Types 2024 & 2032
- Figure 18: Europe OTC Diet Products Revenue (million), by Country 2024 & 2032
- Figure 19: Europe OTC Diet Products Revenue Share (%), by Country 2024 & 2032
- Figure 20: Middle East & Africa OTC Diet Products Revenue (million), by Application 2024 & 2032
- Figure 21: Middle East & Africa OTC Diet Products Revenue Share (%), by Application 2024 & 2032
- Figure 22: Middle East & Africa OTC Diet Products Revenue (million), by Types 2024 & 2032
- Figure 23: Middle East & Africa OTC Diet Products Revenue Share (%), by Types 2024 & 2032
- Figure 24: Middle East & Africa OTC Diet Products Revenue (million), by Country 2024 & 2032
- Figure 25: Middle East & Africa OTC Diet Products Revenue Share (%), by Country 2024 & 2032
- Figure 26: Asia Pacific OTC Diet Products Revenue (million), by Application 2024 & 2032
- Figure 27: Asia Pacific OTC Diet Products Revenue Share (%), by Application 2024 & 2032
- Figure 28: Asia Pacific OTC Diet Products Revenue (million), by Types 2024 & 2032
- Figure 29: Asia Pacific OTC Diet Products Revenue Share (%), by Types 2024 & 2032
- Figure 30: Asia Pacific OTC Diet Products Revenue (million), by Country 2024 & 2032
- Figure 31: Asia Pacific OTC Diet Products Revenue Share (%), by Country 2024 & 2032
List of Tables
- Table 1: Global OTC Diet Products Revenue million Forecast, by Region 2019 & 2032
- Table 2: Global OTC Diet Products Revenue million Forecast, by Application 2019 & 2032
- Table 3: Global OTC Diet Products Revenue million Forecast, by Types 2019 & 2032
- Table 4: Global OTC Diet Products Revenue million Forecast, by Region 2019 & 2032
- Table 5: Global OTC Diet Products Revenue million Forecast, by Application 2019 & 2032
- Table 6: Global OTC Diet Products Revenue million Forecast, by Types 2019 & 2032
- Table 7: Global OTC Diet Products Revenue million Forecast, by Country 2019 & 2032
- Table 8: United States OTC Diet Products Revenue (million) Forecast, by Application 2019 & 2032
- Table 9: Canada OTC Diet Products Revenue (million) Forecast, by Application 2019 & 2032
- Table 10: Mexico OTC Diet Products Revenue (million) Forecast, by Application 2019 & 2032
- Table 11: Global OTC Diet Products Revenue million Forecast, by Application 2019 & 2032
- Table 12: Global OTC Diet Products Revenue million Forecast, by Types 2019 & 2032
- Table 13: Global OTC Diet Products Revenue million Forecast, by Country 2019 & 2032
- Table 14: Brazil OTC Diet Products Revenue (million) Forecast, by Application 2019 & 2032
- Table 15: Argentina OTC Diet Products Revenue (million) Forecast, by Application 2019 & 2032
- Table 16: Rest of South America OTC Diet Products Revenue (million) Forecast, by Application 2019 & 2032
- Table 17: Global OTC Diet Products Revenue million Forecast, by Application 2019 & 2032
- Table 18: Global OTC Diet Products Revenue million Forecast, by Types 2019 & 2032
- Table 19: Global OTC Diet Products Revenue million Forecast, by Country 2019 & 2032
- Table 20: United Kingdom OTC Diet Products Revenue (million) Forecast, by Application 2019 & 2032
- Table 21: Germany OTC Diet Products Revenue (million) Forecast, by Application 2019 & 2032
- Table 22: France OTC Diet Products Revenue (million) Forecast, by Application 2019 & 2032
- Table 23: Italy OTC Diet Products Revenue (million) Forecast, by Application 2019 & 2032
- Table 24: Spain OTC Diet Products Revenue (million) Forecast, by Application 2019 & 2032
- Table 25: Russia OTC Diet Products Revenue (million) Forecast, by Application 2019 & 2032
- Table 26: Benelux OTC Diet Products Revenue (million) Forecast, by Application 2019 & 2032
- Table 27: Nordics OTC Diet Products Revenue (million) Forecast, by Application 2019 & 2032
- Table 28: Rest of Europe OTC Diet Products Revenue (million) Forecast, by Application 2019 & 2032
- Table 29: Global OTC Diet Products Revenue million Forecast, by Application 2019 & 2032
- Table 30: Global OTC Diet Products Revenue million Forecast, by Types 2019 & 2032
- Table 31: Global OTC Diet Products Revenue million Forecast, by Country 2019 & 2032
- Table 32: Turkey OTC Diet Products Revenue (million) Forecast, by Application 2019 & 2032
- Table 33: Israel OTC Diet Products Revenue (million) Forecast, by Application 2019 & 2032
- Table 34: GCC OTC Diet Products Revenue (million) Forecast, by Application 2019 & 2032
- Table 35: North Africa OTC Diet Products Revenue (million) Forecast, by Application 2019 & 2032
- Table 36: South Africa OTC Diet Products Revenue (million) Forecast, by Application 2019 & 2032
- Table 37: Rest of Middle East & Africa OTC Diet Products Revenue (million) Forecast, by Application 2019 & 2032
- Table 38: Global OTC Diet Products Revenue million Forecast, by Application 2019 & 2032
- Table 39: Global OTC Diet Products Revenue million Forecast, by Types 2019 & 2032
- Table 40: Global OTC Diet Products Revenue million Forecast, by Country 2019 & 2032
- Table 41: China OTC Diet Products Revenue (million) Forecast, by Application 2019 & 2032
- Table 42: India OTC Diet Products Revenue (million) Forecast, by Application 2019 & 2032
- Table 43: Japan OTC Diet Products Revenue (million) Forecast, by Application 2019 & 2032
- Table 44: South Korea OTC Diet Products Revenue (million) Forecast, by Application 2019 & 2032
- Table 45: ASEAN OTC Diet Products Revenue (million) Forecast, by Application 2019 & 2032
- Table 46: Oceania OTC Diet Products Revenue (million) Forecast, by Application 2019 & 2032
- Table 47: Rest of Asia Pacific OTC Diet Products Revenue (million) Forecast, by Application 2019 & 2032
Frequently Asked Questions
1. What is the projected Compound Annual Growth Rate (CAGR) of the OTC Diet Products?
The projected CAGR is approximately 7%.
2. Which companies are prominent players in the OTC Diet Products?
Key companies in the market include GSK, Amway, Hydroxycut, 21st Century® HealthCare, Inc., Herbalife International, Bluebonnet Nutrition, ESTEEM MD, Absolute Nutrition, Revolution, BSN, MuscleTech, Applied Nutriceuticals, Genesis Today.
3. What are the main segments of the OTC Diet Products?
The market segments include Application, Types.
4. Can you provide details about the market size?
The market size is estimated to be USD 106900 million as of 2022.
5. What are some drivers contributing to market growth?
N/A
6. What are the notable trends driving market growth?
N/A
7. Are there any restraints impacting market growth?
N/A
8. Can you provide examples of recent developments in the market?
N/A
9. What pricing options are available for accessing the report?
Pricing options include single-user, multi-user, and enterprise licenses priced at USD 3350.00, USD 5025.00, and USD 6700.00 respectively.
10. Is the market size provided in terms of value or volume?
The market size is provided in terms of value, measured in million.
11. Are there any specific market keywords associated with the report?
Yes, the market keyword associated with the report is "OTC Diet Products," which aids in identifying and referencing the specific market segment covered.
12. How do I determine which pricing option suits my needs best?
The pricing options vary based on user requirements and access needs. Individual users may opt for single-user licenses, while businesses requiring broader access may choose multi-user or enterprise licenses for cost-effective access to the report.
13. Are there any additional resources or data provided in the OTC Diet Products report?
While the report offers comprehensive insights, it's advisable to review the specific contents or supplementary materials provided to ascertain if additional resources or data are available.
14. How can I stay updated on further developments or reports in the OTC Diet Products?
To stay informed about further developments, trends, and reports in the OTC Diet Products, consider subscribing to industry newsletters, following relevant companies and organizations, or regularly checking reputable industry news sources and publications.
Methodology
Step 1 - Identification of Relevant Samples Size from Population Database


Step 2 - Approaches for Defining Global Market Size (Value, Volume* & Price*)

Note*: In applicable scenarios
Step 3 - Data Sources
Primary Research
- Web Analytics
- Survey Reports
- Research Institute
- Latest Research Reports
- Opinion Leaders
Secondary Research
- Annual Reports
- White Paper
- Latest Press Release
- Industry Association
- Paid Database
- Investor Presentations

Step 4 - Data Triangulation
Involves using different sources of information in order to increase the validity of a study
These sources are likely to be stakeholders in a program - participants, other researchers, program staff, other community members, and so on.
Then we put all data in single framework & apply various statistical tools to find out the dynamic on the market.
During the analysis stage, feedback from the stakeholder groups would be compared to determine areas of agreement as well as areas of divergence
