

Key Insights
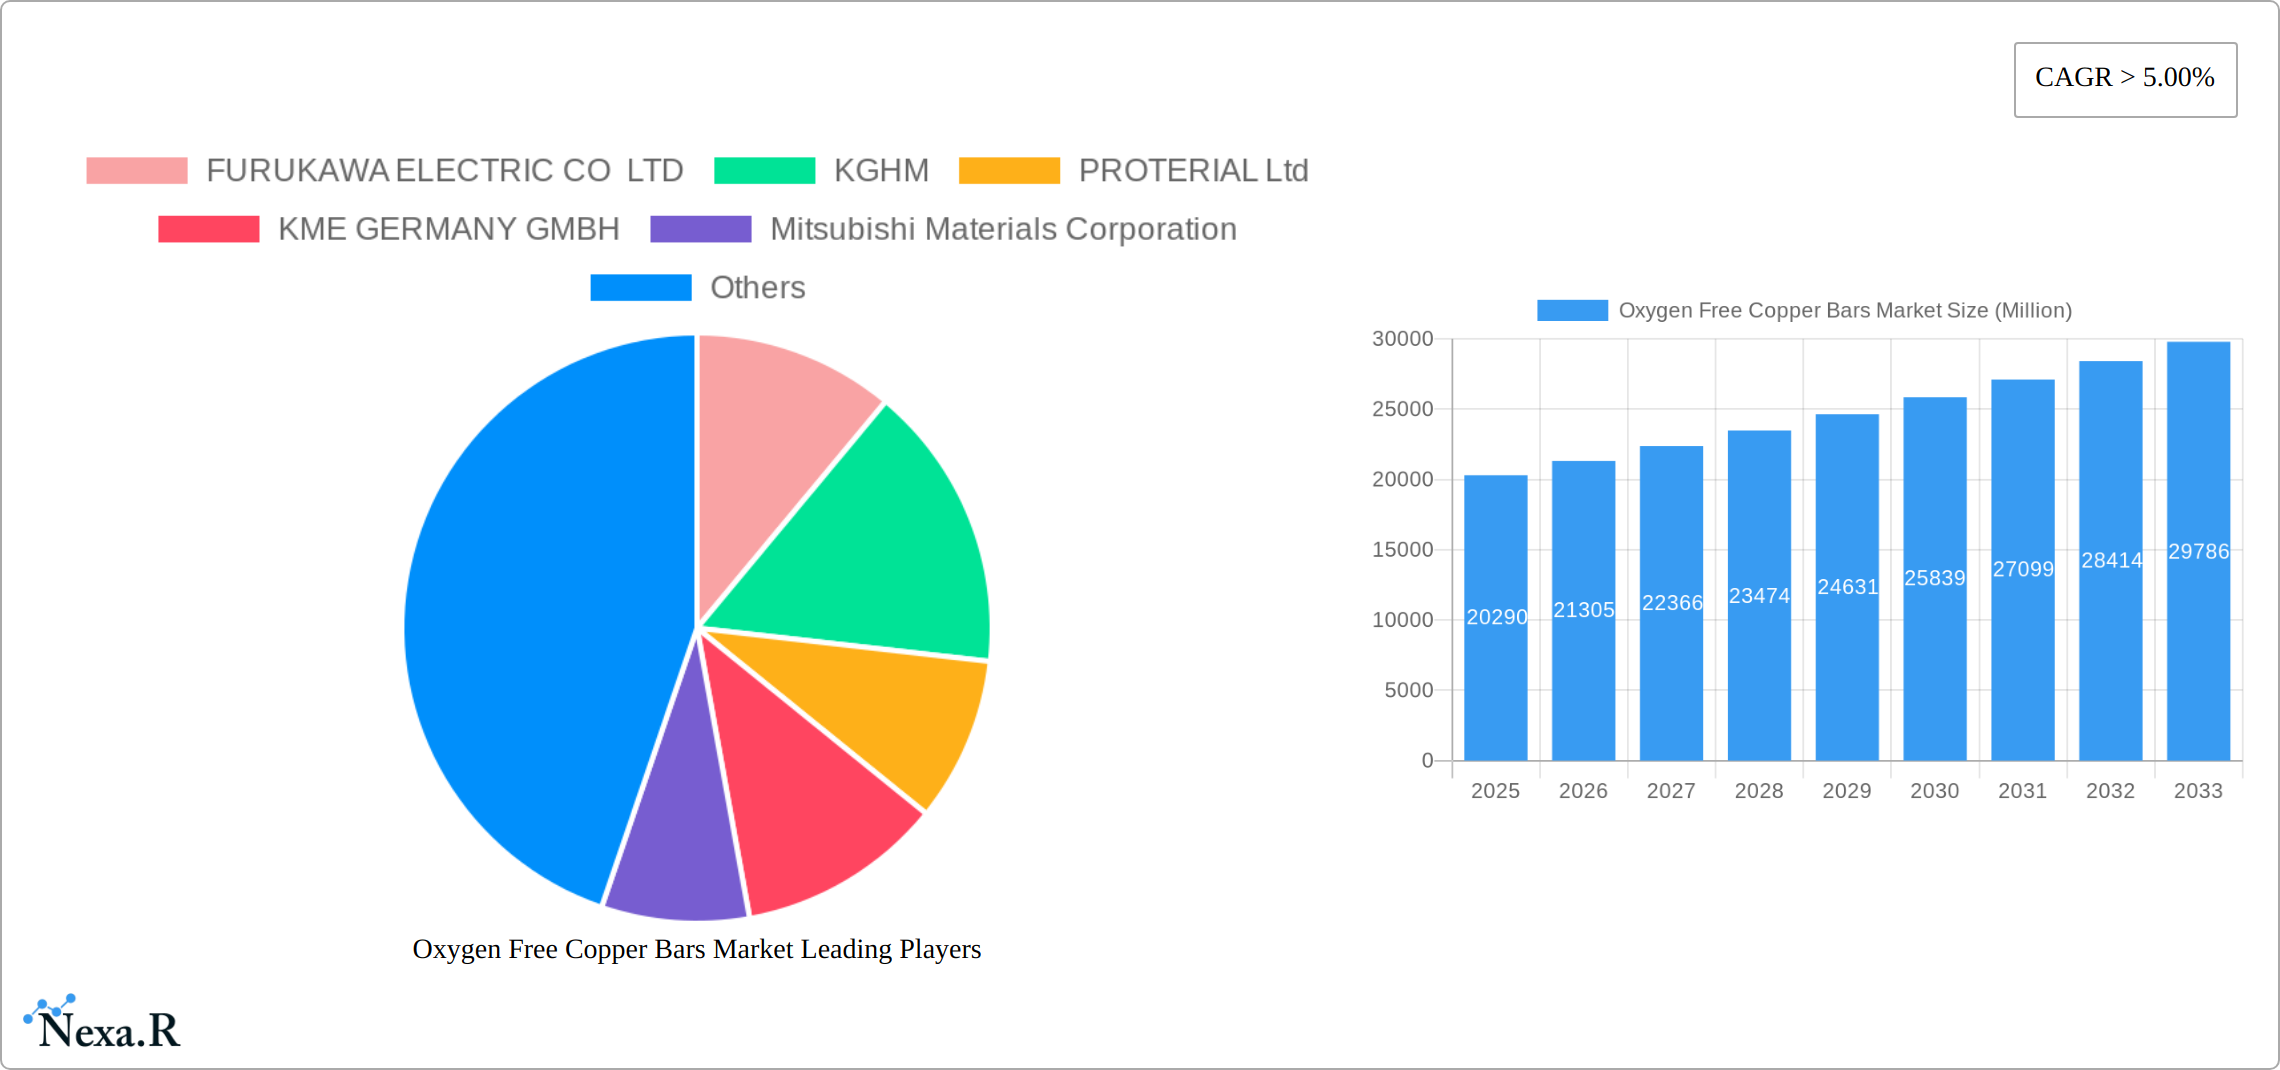
The Oxygen-Free Copper (OFC) bars market, valued at $20.29 billion in 2025, is projected to experience robust growth, exceeding a 5% Compound Annual Growth Rate (CAGR) through 2033. This expansion is driven by increasing demand from key end-use industries, particularly the electrical and electronics sector, fueled by the proliferation of electric vehicles, renewable energy infrastructure, and advanced electronics. The automotive industry's shift towards electric vehicles significantly boosts the demand for OFC bars due to their superior conductivity and durability in electric motor windings and power electronics. Furthermore, the burgeoning industrial sector, encompassing automation and robotics, contributes to market growth. Growth is also spurred by the high thermal and electrical conductivity properties of OFC bars making them ideal for various applications requiring high-performance materials. Product segmentation reveals that wires and strips dominate the market share, reflecting their widespread use in electrical applications. Geographically, North America and Asia-Pacific are major contributors, driven by strong manufacturing bases and technological advancements in these regions. However, the market faces restraints such as fluctuating copper prices and the potential for substitute materials. Nevertheless, the long-term outlook remains positive due to the inherent advantages of OFC bars and the continued growth of its key end-use sectors.
The competitive landscape is characterized by both established players and emerging regional manufacturers. Major companies like Furukawa Electric, KGHM, and Mitsubishi Materials Corporation hold significant market share, leveraging their established supply chains and technological expertise. However, smaller, regional companies are emerging, particularly in rapidly developing economies, offering competitive pricing and localized service. Future growth strategies will likely focus on technological innovation, particularly in developing high-purity OFC bars for specialized applications, as well as expanding into new geographical markets and exploring partnerships to secure raw material supply chains. The development of sustainable and environmentally friendly manufacturing processes will also play a significant role in shaping the industry's future. The ongoing demand for higher efficiency and improved performance in electronics and electric vehicles strongly suggests that the OFC bars market will continue its trajectory of growth in the coming years.
Oxygen-Free Copper Bars Market Report: A Comprehensive Analysis (2019-2033)
This comprehensive report provides an in-depth analysis of the Oxygen-Free Copper Bars market, encompassing market dynamics, growth trends, regional analysis, product landscape, and competitive intelligence. With a focus on the parent market of copper products and the child market of oxygen-free copper bars, this report is essential for industry professionals, investors, and strategic decision-makers seeking to navigate this dynamic sector. The study period covers 2019-2033, with a base year of 2025 and a forecast period of 2025-2033. The market size is presented in million units.
Oxygen Free Copper Bars Market Market Dynamics & Structure
The Oxygen-Free Copper Bars market is characterized by moderate concentration, with key players such as FURUKAWA ELECTRIC CO LTD, KGHM, PROTERIAL Ltd, KME GERMANY GMBH, and Mitsubishi Materials Corporation holding significant market share. The market exhibits strong technological innovation, particularly in improving conductivity and enhancing manufacturing processes. Stringent regulatory frameworks concerning material purity and environmental impact influence market dynamics. Competitive substitutes include aluminum and other conductive materials, though oxygen-free copper retains a strong advantage in performance for specific applications. The end-user demographics are diverse, with significant demand from the electrical and electronics, automotive, and industrial sectors. Recent M&A activity, such as the acquisition of Lacroix + Kress GmbH by Superior Essex Inc. in January 2023, highlights the strategic importance of OFC in growth sectors like electric vehicles.
- Market Concentration: Moderately concentrated, with top 5 players holding xx% market share in 2024.
- Technological Innovation: Focus on enhanced conductivity, improved manufacturing efficiency, and eco-friendly production processes.
- Regulatory Framework: Stringent regulations regarding purity, traceability, and environmental impact.
- Competitive Substitutes: Aluminum and other conductive materials pose limited competition due to OFC's superior performance in specific applications.
- End-User Demographics: Primarily electrical & electronics, automotive, and industrial sectors; growing demand from renewable energy and aerospace.
- M&A Activity: xx major M&A deals recorded between 2019-2024, signifying industry consolidation and strategic expansion.
Oxygen Free Copper Bars Market Growth Trends & Insights
The Oxygen-Free Copper Bars market is projected to experience robust growth during the forecast period, driven by the increasing demand from key end-user industries. The market size is estimated at xx million units in 2025, with a projected Compound Annual Growth Rate (CAGR) of xx% from 2025 to 2033. This growth is fueled by the rising adoption of electric vehicles, increasing investments in renewable energy infrastructure, and the ongoing expansion of the electronics industry. Technological advancements, including the development of high-purity OFC materials, are further contributing to market expansion. Consumer behavior shifts towards sustainable and high-performance materials also favor OFC's market penetration. The market penetration rate is expected to increase from xx% in 2025 to xx% by 2033.

Dominant Regions, Countries, or Segments in Oxygen Free Copper Bars Market
The Asia-Pacific region is poised for continued dominance in the Oxygen-Free Copper Bars (OFC) market throughout the forecast period. This projection is fueled by several key factors: rapid industrialization across the region, substantial growth within the electronics and automotive sectors, and supportive government initiatives promoting technological advancement and infrastructure development. Within Asia-Pacific, China and Japan are expected to remain the leading national markets. The CU-OFE grade and wires and strips product segments are anticipated to retain the largest market shares, reflecting robust demand from these core applications. The electrical and electronics end-user industry remains the dominant application segment, with significant growth anticipated in the automotive sector, driven by the increasing electrification of vehicles and the expanding adoption of advanced driver-assistance systems (ADAS).
- Key Drivers in Asia-Pacific: Rapid industrialization, robust growth in electronics and automotive sectors, supportive government policies fostering technological innovation, and increasing investments in renewable energy infrastructure.
- Dominant Segments: CU-OFE grade and wires & strips, driven by strong demand from the electrical & electronics and automotive sectors. Growing demand is also observed in renewable energy applications like solar panels and wind turbines.
- Growth Potential: Significant growth potential exists in emerging economies within Asia-Pacific, coupled with rising demand from the automotive and renewable energy sectors in developed markets. Expansion into new applications and geographical markets offers further growth opportunities.
Oxygen Free Copper Bars Market Product Landscape
Oxygen-free copper bars are available in various grades (CU-OF, CU-OFE) and forms (wires, strips, busbars, rods, and other products like tubes and pipes). Recent innovations focus on enhancing conductivity, improving mechanical properties, and developing specialized alloys for specific applications. Unique selling propositions emphasize high purity, superior electrical conductivity, and excellent corrosion resistance. Technological advancements include the optimization of manufacturing processes for increased efficiency and reduced costs.
Key Drivers, Barriers & Challenges in Oxygen Free Copper Bars Market
Key Drivers: The primary drivers for the market are the increasing demand from the automotive (EVs), renewable energy (solar, wind), and electronics industries. Government regulations promoting sustainable and energy-efficient technologies further stimulate growth. Technological advancements in production methods and alloy development contribute to improvements in product performance and cost-effectiveness.
Challenges & Restraints: Fluctuations in copper prices, supply chain disruptions, and competition from alternative materials pose significant challenges. Strict environmental regulations, and potential trade restrictions can also impact market growth. The estimated impact of these factors on market growth is xx% reduction in CAGR.
Emerging Opportunities in Oxygen Free Copper Bars Market
The OFC market presents compelling emerging opportunities driven by technological advancements and evolving industry trends. The expansion into new applications, such as advanced batteries for electric vehicles and energy storage systems (ESS), 5G infrastructure development (requiring high-purity copper for efficient signal transmission), and specialized medical equipment (where OFC's biocompatibility is advantageous) presents significant growth potential. Untapped markets in developing economies, particularly in Africa and Latin America, offer substantial opportunities for market penetration. Furthermore, the development of specialized alloys with enhanced performance characteristics for niche applications, such as high-frequency applications and cryogenic environments, will drive innovation and expansion within the OFC market.
Growth Accelerators in the Oxygen Free Copper Bars Market Industry
Several key factors are accelerating growth within the Oxygen Free Copper Bars market. Technological breakthroughs in materials science, leading to the development of higher-purity and performance-enhanced OFC with improved conductivity and reduced oxidation, are crucial growth drivers. Strategic collaborations and partnerships between raw material suppliers, manufacturers, and end-users are optimizing supply chains, enhancing product availability, and fostering innovation. Expansion into new geographic markets and diversification into emerging application areas are also contributing significantly to long-term market growth. The increasing focus on sustainability and the demand for environmentally friendly materials also create a favorable environment for OFC, which is highly recyclable.
Key Players Shaping the Oxygen Free Copper Bars Market Market
- FURUKAWA ELECTRIC CO LTD
- KGHM
- PROTERIAL Ltd
- KME GERMANY GMBH
- Mitsubishi Materials Corporation
- Metrod Holdings Berhad
- Sam Dong
- Farmers Copper LTD
- Lacroix + Kress GmbH
- Aviva Metals
- Cupori
- Citizen Metalloys Ltd
- Copper Braid Products
Notable Milestones in Oxygen Free Copper Bars Market Sector
- January 2023: Hitachi Metals Ltd. rebranded as Proterial Ltd., signifying a strategic shift towards advanced materials and highlighting the growing importance of OFC in this sector.
- January 2023: Superior Essex Inc.'s acquisition of Lacroix + Kress GmbH strengthened its market position in OFC and expanded its presence in the rapidly growing electric vehicle market, emphasizing the increasing demand for high-quality copper in this sector.
- [Add other relevant recent milestones here, e.g., new product launches, expansions, partnerships, etc.]
In-Depth Oxygen Free Copper Bars Market Market Outlook
The Oxygen-Free Copper Bars market is poised for continued growth driven by the increasing demand from key end-user industries and technological advancements. Strategic investments in research and development, focusing on enhancing material properties and optimizing manufacturing processes, will be crucial for maintaining a competitive advantage. Expansion into new markets and applications, along with strategic partnerships, will unlock significant long-term growth opportunities. The market is anticipated to reach xx million units by 2033, representing substantial growth potential for industry players.
Oxygen Free Copper Bars Market Segmentation
-
1. Grade
- 1.1. CU-OF
- 1.2. CU-OFE
-
2. Product
- 2.1. Wires
- 2.2. Strips
- 2.3. Busbars and Rods
- 2.4. Other Products (Tubes and Pipes, Etc.)
-
3. End-user Industry
- 3.1. Electrical and Electronics
- 3.2. Automotive
- 3.3. Industrial
- 3.4. Other End-user Industry
Oxygen Free Copper Bars Market Segmentation By Geography
-
1. Asia Pacific
- 1.1. China
- 1.2. India
- 1.3. Japan
- 1.4. South Korea
- 1.5. Rest of Asia Pacific
-
2. North America
- 2.1. United States
- 2.2. Canada
- 2.3. Mexico
-
3. Europe
- 3.1. Germany
- 3.2. United Kingdom
- 3.3. France
- 3.4. Italy
- 3.5. Spain
- 3.6. Rest of Europe
-
4. South America
- 4.1. Brazil
- 4.2. Argentina
- 4.3. Rest of South America
-
5. Middle East and Africa
- 5.1. Saudi Arabia
- 5.2. South Africa
- 5.3. UAE
- 5.4. Rest of Middle East and Africa

Oxygen Free Copper Bars Market REPORT HIGHLIGHTS
| Aspects | Details |
|---|---|
| Study Period | 2019-2033 |
| Base Year | 2024 |
| Estimated Year | 2025 |
| Forecast Period | 2025-2033 |
| Historical Period | 2019-2024 |
| Growth Rate | CAGR of > 5.00% from 2019-2033 |
| Segmentation |
|
Table of Contents
- 1. Introduction
- 1.1. Research Scope
- 1.2. Market Segmentation
- 1.3. Research Methodology
- 1.4. Definitions and Assumptions
- 2. Executive Summary
- 2.1. Introduction
- 3. Market Dynamics
- 3.1. Introduction
- 3.2. Market Drivers
- 3.2.1. Increasing Demand from Semiconductor; Increasing Demand from Automotive Sector; Other Drivers
- 3.3. Market Restrains
- 3.3.1. High Cost of Copper; Other Restraints
- 3.4. Market Trends
- 3.4.1. Electrical and Electronics Industry to Dominate the Market
- 4. Market Factor Analysis
- 4.1. Porters Five Forces
- 4.2. Supply/Value Chain
- 4.3. PESTEL analysis
- 4.4. Market Entropy
- 4.5. Patent/Trademark Analysis
- 5. Global Oxygen Free Copper Bars Market Analysis, Insights and Forecast, 2019-2031
- 5.1. Market Analysis, Insights and Forecast - by Grade
- 5.1.1. CU-OF
- 5.1.2. CU-OFE
- 5.2. Market Analysis, Insights and Forecast - by Product
- 5.2.1. Wires
- 5.2.2. Strips
- 5.2.3. Busbars and Rods
- 5.2.4. Other Products (Tubes and Pipes, Etc.)
- 5.3. Market Analysis, Insights and Forecast - by End-user Industry
- 5.3.1. Electrical and Electronics
- 5.3.2. Automotive
- 5.3.3. Industrial
- 5.3.4. Other End-user Industry
- 5.4. Market Analysis, Insights and Forecast - by Region
- 5.4.1. Asia Pacific
- 5.4.2. North America
- 5.4.3. Europe
- 5.4.4. South America
- 5.4.5. Middle East and Africa
- 5.1. Market Analysis, Insights and Forecast - by Grade
- 6. Asia Pacific Oxygen Free Copper Bars Market Analysis, Insights and Forecast, 2019-2031
- 6.1. Market Analysis, Insights and Forecast - by Grade
- 6.1.1. CU-OF
- 6.1.2. CU-OFE
- 6.2. Market Analysis, Insights and Forecast - by Product
- 6.2.1. Wires
- 6.2.2. Strips
- 6.2.3. Busbars and Rods
- 6.2.4. Other Products (Tubes and Pipes, Etc.)
- 6.3. Market Analysis, Insights and Forecast - by End-user Industry
- 6.3.1. Electrical and Electronics
- 6.3.2. Automotive
- 6.3.3. Industrial
- 6.3.4. Other End-user Industry
- 6.1. Market Analysis, Insights and Forecast - by Grade
- 7. North America Oxygen Free Copper Bars Market Analysis, Insights and Forecast, 2019-2031
- 7.1. Market Analysis, Insights and Forecast - by Grade
- 7.1.1. CU-OF
- 7.1.2. CU-OFE
- 7.2. Market Analysis, Insights and Forecast - by Product
- 7.2.1. Wires
- 7.2.2. Strips
- 7.2.3. Busbars and Rods
- 7.2.4. Other Products (Tubes and Pipes, Etc.)
- 7.3. Market Analysis, Insights and Forecast - by End-user Industry
- 7.3.1. Electrical and Electronics
- 7.3.2. Automotive
- 7.3.3. Industrial
- 7.3.4. Other End-user Industry
- 7.1. Market Analysis, Insights and Forecast - by Grade
- 8. Europe Oxygen Free Copper Bars Market Analysis, Insights and Forecast, 2019-2031
- 8.1. Market Analysis, Insights and Forecast - by Grade
- 8.1.1. CU-OF
- 8.1.2. CU-OFE
- 8.2. Market Analysis, Insights and Forecast - by Product
- 8.2.1. Wires
- 8.2.2. Strips
- 8.2.3. Busbars and Rods
- 8.2.4. Other Products (Tubes and Pipes, Etc.)
- 8.3. Market Analysis, Insights and Forecast - by End-user Industry
- 8.3.1. Electrical and Electronics
- 8.3.2. Automotive
- 8.3.3. Industrial
- 8.3.4. Other End-user Industry
- 8.1. Market Analysis, Insights and Forecast - by Grade
- 9. South America Oxygen Free Copper Bars Market Analysis, Insights and Forecast, 2019-2031
- 9.1. Market Analysis, Insights and Forecast - by Grade
- 9.1.1. CU-OF
- 9.1.2. CU-OFE
- 9.2. Market Analysis, Insights and Forecast - by Product
- 9.2.1. Wires
- 9.2.2. Strips
- 9.2.3. Busbars and Rods
- 9.2.4. Other Products (Tubes and Pipes, Etc.)
- 9.3. Market Analysis, Insights and Forecast - by End-user Industry
- 9.3.1. Electrical and Electronics
- 9.3.2. Automotive
- 9.3.3. Industrial
- 9.3.4. Other End-user Industry
- 9.1. Market Analysis, Insights and Forecast - by Grade
- 10. Middle East and Africa Oxygen Free Copper Bars Market Analysis, Insights and Forecast, 2019-2031
- 10.1. Market Analysis, Insights and Forecast - by Grade
- 10.1.1. CU-OF
- 10.1.2. CU-OFE
- 10.2. Market Analysis, Insights and Forecast - by Product
- 10.2.1. Wires
- 10.2.2. Strips
- 10.2.3. Busbars and Rods
- 10.2.4. Other Products (Tubes and Pipes, Etc.)
- 10.3. Market Analysis, Insights and Forecast - by End-user Industry
- 10.3.1. Electrical and Electronics
- 10.3.2. Automotive
- 10.3.3. Industrial
- 10.3.4. Other End-user Industry
- 10.1. Market Analysis, Insights and Forecast - by Grade
- 11. North America Oxygen Free Copper Bars Market Analysis, Insights and Forecast, 2019-2031
- 11.1. Market Analysis, Insights and Forecast - By Country/Sub-region
- 11.1.1 United States
- 11.1.2 Canada
- 11.1.3 Mexico
- 12. Europe Oxygen Free Copper Bars Market Analysis, Insights and Forecast, 2019-2031
- 12.1. Market Analysis, Insights and Forecast - By Country/Sub-region
- 12.1.1 Germany
- 12.1.2 United Kingdom
- 12.1.3 France
- 12.1.4 Spain
- 12.1.5 Italy
- 12.1.6 Spain
- 12.1.7 Belgium
- 12.1.8 Netherland
- 12.1.9 Nordics
- 12.1.10 Rest of Europe
- 13. Asia Pacific Oxygen Free Copper Bars Market Analysis, Insights and Forecast, 2019-2031
- 13.1. Market Analysis, Insights and Forecast - By Country/Sub-region
- 13.1.1 China
- 13.1.2 Japan
- 13.1.3 India
- 13.1.4 South Korea
- 13.1.5 Southeast Asia
- 13.1.6 Australia
- 13.1.7 Indonesia
- 13.1.8 Phillipes
- 13.1.9 Singapore
- 13.1.10 Thailandc
- 13.1.11 Rest of Asia Pacific
- 14. South America Oxygen Free Copper Bars Market Analysis, Insights and Forecast, 2019-2031
- 14.1. Market Analysis, Insights and Forecast - By Country/Sub-region
- 14.1.1 Brazil
- 14.1.2 Argentina
- 14.1.3 Peru
- 14.1.4 Chile
- 14.1.5 Colombia
- 14.1.6 Ecuador
- 14.1.7 Venezuela
- 14.1.8 Rest of South America
- 15. North America Oxygen Free Copper Bars Market Analysis, Insights and Forecast, 2019-2031
- 15.1. Market Analysis, Insights and Forecast - By Country/Sub-region
- 15.1.1 United States
- 15.1.2 Canada
- 15.1.3 Mexico
- 16. MEA Oxygen Free Copper Bars Market Analysis, Insights and Forecast, 2019-2031
- 16.1. Market Analysis, Insights and Forecast - By Country/Sub-region
- 16.1.1 United Arab Emirates
- 16.1.2 Saudi Arabia
- 16.1.3 South Africa
- 16.1.4 Rest of Middle East and Africa
- 17. Competitive Analysis
- 17.1. Global Market Share Analysis 2024
- 17.2. Company Profiles
- 17.2.1 FURUKAWA ELECTRIC CO LTD
- 17.2.1.1. Overview
- 17.2.1.2. Products
- 17.2.1.3. SWOT Analysis
- 17.2.1.4. Recent Developments
- 17.2.1.5. Financials (Based on Availability)
- 17.2.2 KGHM
- 17.2.2.1. Overview
- 17.2.2.2. Products
- 17.2.2.3. SWOT Analysis
- 17.2.2.4. Recent Developments
- 17.2.2.5. Financials (Based on Availability)
- 17.2.3 PROTERIAL Ltd
- 17.2.3.1. Overview
- 17.2.3.2. Products
- 17.2.3.3. SWOT Analysis
- 17.2.3.4. Recent Developments
- 17.2.3.5. Financials (Based on Availability)
- 17.2.4 KME GERMANY GMBH
- 17.2.4.1. Overview
- 17.2.4.2. Products
- 17.2.4.3. SWOT Analysis
- 17.2.4.4. Recent Developments
- 17.2.4.5. Financials (Based on Availability)
- 17.2.5 Mitsubishi Materials Corporation
- 17.2.5.1. Overview
- 17.2.5.2. Products
- 17.2.5.3. SWOT Analysis
- 17.2.5.4. Recent Developments
- 17.2.5.5. Financials (Based on Availability)
- 17.2.6 Metrod Holdings Berhad
- 17.2.6.1. Overview
- 17.2.6.2. Products
- 17.2.6.3. SWOT Analysis
- 17.2.6.4. Recent Developments
- 17.2.6.5. Financials (Based on Availability)
- 17.2.7 Sam Dong
- 17.2.7.1. Overview
- 17.2.7.2. Products
- 17.2.7.3. SWOT Analysis
- 17.2.7.4. Recent Developments
- 17.2.7.5. Financials (Based on Availability)
- 17.2.8 Farmers Copper LTD
- 17.2.8.1. Overview
- 17.2.8.2. Products
- 17.2.8.3. SWOT Analysis
- 17.2.8.4. Recent Developments
- 17.2.8.5. Financials (Based on Availability)
- 17.2.9 Lacroix + Kress GmbH
- 17.2.9.1. Overview
- 17.2.9.2. Products
- 17.2.9.3. SWOT Analysis
- 17.2.9.4. Recent Developments
- 17.2.9.5. Financials (Based on Availability)
- 17.2.10 Aviva Metals
- 17.2.10.1. Overview
- 17.2.10.2. Products
- 17.2.10.3. SWOT Analysis
- 17.2.10.4. Recent Developments
- 17.2.10.5. Financials (Based on Availability)
- 17.2.11 Cupori
- 17.2.11.1. Overview
- 17.2.11.2. Products
- 17.2.11.3. SWOT Analysis
- 17.2.11.4. Recent Developments
- 17.2.11.5. Financials (Based on Availability)
- 17.2.12 Citizen Metalloys Ltd
- 17.2.12.1. Overview
- 17.2.12.2. Products
- 17.2.12.3. SWOT Analysis
- 17.2.12.4. Recent Developments
- 17.2.12.5. Financials (Based on Availability)
- 17.2.13 Copper Braid Products
- 17.2.13.1. Overview
- 17.2.13.2. Products
- 17.2.13.3. SWOT Analysis
- 17.2.13.4. Recent Developments
- 17.2.13.5. Financials (Based on Availability)
- 17.2.1 FURUKAWA ELECTRIC CO LTD
List of Figures
- Figure 1: Global Oxygen Free Copper Bars Market Revenue Breakdown (Million, %) by Region 2024 & 2032
- Figure 2: Global Oxygen Free Copper Bars Market Volume Breakdown (K Tons, %) by Region 2024 & 2032
- Figure 3: North America Oxygen Free Copper Bars Market Revenue (Million), by Country 2024 & 2032
- Figure 4: North America Oxygen Free Copper Bars Market Volume (K Tons), by Country 2024 & 2032
- Figure 5: North America Oxygen Free Copper Bars Market Revenue Share (%), by Country 2024 & 2032
- Figure 6: North America Oxygen Free Copper Bars Market Volume Share (%), by Country 2024 & 2032
- Figure 7: Europe Oxygen Free Copper Bars Market Revenue (Million), by Country 2024 & 2032
- Figure 8: Europe Oxygen Free Copper Bars Market Volume (K Tons), by Country 2024 & 2032
- Figure 9: Europe Oxygen Free Copper Bars Market Revenue Share (%), by Country 2024 & 2032
- Figure 10: Europe Oxygen Free Copper Bars Market Volume Share (%), by Country 2024 & 2032
- Figure 11: Asia Pacific Oxygen Free Copper Bars Market Revenue (Million), by Country 2024 & 2032
- Figure 12: Asia Pacific Oxygen Free Copper Bars Market Volume (K Tons), by Country 2024 & 2032
- Figure 13: Asia Pacific Oxygen Free Copper Bars Market Revenue Share (%), by Country 2024 & 2032
- Figure 14: Asia Pacific Oxygen Free Copper Bars Market Volume Share (%), by Country 2024 & 2032
- Figure 15: South America Oxygen Free Copper Bars Market Revenue (Million), by Country 2024 & 2032
- Figure 16: South America Oxygen Free Copper Bars Market Volume (K Tons), by Country 2024 & 2032
- Figure 17: South America Oxygen Free Copper Bars Market Revenue Share (%), by Country 2024 & 2032
- Figure 18: South America Oxygen Free Copper Bars Market Volume Share (%), by Country 2024 & 2032
- Figure 19: North America Oxygen Free Copper Bars Market Revenue (Million), by Country 2024 & 2032
- Figure 20: North America Oxygen Free Copper Bars Market Volume (K Tons), by Country 2024 & 2032
- Figure 21: North America Oxygen Free Copper Bars Market Revenue Share (%), by Country 2024 & 2032
- Figure 22: North America Oxygen Free Copper Bars Market Volume Share (%), by Country 2024 & 2032
- Figure 23: MEA Oxygen Free Copper Bars Market Revenue (Million), by Country 2024 & 2032
- Figure 24: MEA Oxygen Free Copper Bars Market Volume (K Tons), by Country 2024 & 2032
- Figure 25: MEA Oxygen Free Copper Bars Market Revenue Share (%), by Country 2024 & 2032
- Figure 26: MEA Oxygen Free Copper Bars Market Volume Share (%), by Country 2024 & 2032
- Figure 27: Asia Pacific Oxygen Free Copper Bars Market Revenue (Million), by Grade 2024 & 2032
- Figure 28: Asia Pacific Oxygen Free Copper Bars Market Volume (K Tons), by Grade 2024 & 2032
- Figure 29: Asia Pacific Oxygen Free Copper Bars Market Revenue Share (%), by Grade 2024 & 2032
- Figure 30: Asia Pacific Oxygen Free Copper Bars Market Volume Share (%), by Grade 2024 & 2032
- Figure 31: Asia Pacific Oxygen Free Copper Bars Market Revenue (Million), by Product 2024 & 2032
- Figure 32: Asia Pacific Oxygen Free Copper Bars Market Volume (K Tons), by Product 2024 & 2032
- Figure 33: Asia Pacific Oxygen Free Copper Bars Market Revenue Share (%), by Product 2024 & 2032
- Figure 34: Asia Pacific Oxygen Free Copper Bars Market Volume Share (%), by Product 2024 & 2032
- Figure 35: Asia Pacific Oxygen Free Copper Bars Market Revenue (Million), by End-user Industry 2024 & 2032
- Figure 36: Asia Pacific Oxygen Free Copper Bars Market Volume (K Tons), by End-user Industry 2024 & 2032
- Figure 37: Asia Pacific Oxygen Free Copper Bars Market Revenue Share (%), by End-user Industry 2024 & 2032
- Figure 38: Asia Pacific Oxygen Free Copper Bars Market Volume Share (%), by End-user Industry 2024 & 2032
- Figure 39: Asia Pacific Oxygen Free Copper Bars Market Revenue (Million), by Country 2024 & 2032
- Figure 40: Asia Pacific Oxygen Free Copper Bars Market Volume (K Tons), by Country 2024 & 2032
- Figure 41: Asia Pacific Oxygen Free Copper Bars Market Revenue Share (%), by Country 2024 & 2032
- Figure 42: Asia Pacific Oxygen Free Copper Bars Market Volume Share (%), by Country 2024 & 2032
- Figure 43: North America Oxygen Free Copper Bars Market Revenue (Million), by Grade 2024 & 2032
- Figure 44: North America Oxygen Free Copper Bars Market Volume (K Tons), by Grade 2024 & 2032
- Figure 45: North America Oxygen Free Copper Bars Market Revenue Share (%), by Grade 2024 & 2032
- Figure 46: North America Oxygen Free Copper Bars Market Volume Share (%), by Grade 2024 & 2032
- Figure 47: North America Oxygen Free Copper Bars Market Revenue (Million), by Product 2024 & 2032
- Figure 48: North America Oxygen Free Copper Bars Market Volume (K Tons), by Product 2024 & 2032
- Figure 49: North America Oxygen Free Copper Bars Market Revenue Share (%), by Product 2024 & 2032
- Figure 50: North America Oxygen Free Copper Bars Market Volume Share (%), by Product 2024 & 2032
- Figure 51: North America Oxygen Free Copper Bars Market Revenue (Million), by End-user Industry 2024 & 2032
- Figure 52: North America Oxygen Free Copper Bars Market Volume (K Tons), by End-user Industry 2024 & 2032
- Figure 53: North America Oxygen Free Copper Bars Market Revenue Share (%), by End-user Industry 2024 & 2032
- Figure 54: North America Oxygen Free Copper Bars Market Volume Share (%), by End-user Industry 2024 & 2032
- Figure 55: North America Oxygen Free Copper Bars Market Revenue (Million), by Country 2024 & 2032
- Figure 56: North America Oxygen Free Copper Bars Market Volume (K Tons), by Country 2024 & 2032
- Figure 57: North America Oxygen Free Copper Bars Market Revenue Share (%), by Country 2024 & 2032
- Figure 58: North America Oxygen Free Copper Bars Market Volume Share (%), by Country 2024 & 2032
- Figure 59: Europe Oxygen Free Copper Bars Market Revenue (Million), by Grade 2024 & 2032
- Figure 60: Europe Oxygen Free Copper Bars Market Volume (K Tons), by Grade 2024 & 2032
- Figure 61: Europe Oxygen Free Copper Bars Market Revenue Share (%), by Grade 2024 & 2032
- Figure 62: Europe Oxygen Free Copper Bars Market Volume Share (%), by Grade 2024 & 2032
- Figure 63: Europe Oxygen Free Copper Bars Market Revenue (Million), by Product 2024 & 2032
- Figure 64: Europe Oxygen Free Copper Bars Market Volume (K Tons), by Product 2024 & 2032
- Figure 65: Europe Oxygen Free Copper Bars Market Revenue Share (%), by Product 2024 & 2032
- Figure 66: Europe Oxygen Free Copper Bars Market Volume Share (%), by Product 2024 & 2032
- Figure 67: Europe Oxygen Free Copper Bars Market Revenue (Million), by End-user Industry 2024 & 2032
- Figure 68: Europe Oxygen Free Copper Bars Market Volume (K Tons), by End-user Industry 2024 & 2032
- Figure 69: Europe Oxygen Free Copper Bars Market Revenue Share (%), by End-user Industry 2024 & 2032
- Figure 70: Europe Oxygen Free Copper Bars Market Volume Share (%), by End-user Industry 2024 & 2032
- Figure 71: Europe Oxygen Free Copper Bars Market Revenue (Million), by Country 2024 & 2032
- Figure 72: Europe Oxygen Free Copper Bars Market Volume (K Tons), by Country 2024 & 2032
- Figure 73: Europe Oxygen Free Copper Bars Market Revenue Share (%), by Country 2024 & 2032
- Figure 74: Europe Oxygen Free Copper Bars Market Volume Share (%), by Country 2024 & 2032
- Figure 75: South America Oxygen Free Copper Bars Market Revenue (Million), by Grade 2024 & 2032
- Figure 76: South America Oxygen Free Copper Bars Market Volume (K Tons), by Grade 2024 & 2032
- Figure 77: South America Oxygen Free Copper Bars Market Revenue Share (%), by Grade 2024 & 2032
- Figure 78: South America Oxygen Free Copper Bars Market Volume Share (%), by Grade 2024 & 2032
- Figure 79: South America Oxygen Free Copper Bars Market Revenue (Million), by Product 2024 & 2032
- Figure 80: South America Oxygen Free Copper Bars Market Volume (K Tons), by Product 2024 & 2032
- Figure 81: South America Oxygen Free Copper Bars Market Revenue Share (%), by Product 2024 & 2032
- Figure 82: South America Oxygen Free Copper Bars Market Volume Share (%), by Product 2024 & 2032
- Figure 83: South America Oxygen Free Copper Bars Market Revenue (Million), by End-user Industry 2024 & 2032
- Figure 84: South America Oxygen Free Copper Bars Market Volume (K Tons), by End-user Industry 2024 & 2032
- Figure 85: South America Oxygen Free Copper Bars Market Revenue Share (%), by End-user Industry 2024 & 2032
- Figure 86: South America Oxygen Free Copper Bars Market Volume Share (%), by End-user Industry 2024 & 2032
- Figure 87: South America Oxygen Free Copper Bars Market Revenue (Million), by Country 2024 & 2032
- Figure 88: South America Oxygen Free Copper Bars Market Volume (K Tons), by Country 2024 & 2032
- Figure 89: South America Oxygen Free Copper Bars Market Revenue Share (%), by Country 2024 & 2032
- Figure 90: South America Oxygen Free Copper Bars Market Volume Share (%), by Country 2024 & 2032
- Figure 91: Middle East and Africa Oxygen Free Copper Bars Market Revenue (Million), by Grade 2024 & 2032
- Figure 92: Middle East and Africa Oxygen Free Copper Bars Market Volume (K Tons), by Grade 2024 & 2032
- Figure 93: Middle East and Africa Oxygen Free Copper Bars Market Revenue Share (%), by Grade 2024 & 2032
- Figure 94: Middle East and Africa Oxygen Free Copper Bars Market Volume Share (%), by Grade 2024 & 2032
- Figure 95: Middle East and Africa Oxygen Free Copper Bars Market Revenue (Million), by Product 2024 & 2032
- Figure 96: Middle East and Africa Oxygen Free Copper Bars Market Volume (K Tons), by Product 2024 & 2032
- Figure 97: Middle East and Africa Oxygen Free Copper Bars Market Revenue Share (%), by Product 2024 & 2032
- Figure 98: Middle East and Africa Oxygen Free Copper Bars Market Volume Share (%), by Product 2024 & 2032
- Figure 99: Middle East and Africa Oxygen Free Copper Bars Market Revenue (Million), by End-user Industry 2024 & 2032
- Figure 100: Middle East and Africa Oxygen Free Copper Bars Market Volume (K Tons), by End-user Industry 2024 & 2032
- Figure 101: Middle East and Africa Oxygen Free Copper Bars Market Revenue Share (%), by End-user Industry 2024 & 2032
- Figure 102: Middle East and Africa Oxygen Free Copper Bars Market Volume Share (%), by End-user Industry 2024 & 2032
- Figure 103: Middle East and Africa Oxygen Free Copper Bars Market Revenue (Million), by Country 2024 & 2032
- Figure 104: Middle East and Africa Oxygen Free Copper Bars Market Volume (K Tons), by Country 2024 & 2032
- Figure 105: Middle East and Africa Oxygen Free Copper Bars Market Revenue Share (%), by Country 2024 & 2032
- Figure 106: Middle East and Africa Oxygen Free Copper Bars Market Volume Share (%), by Country 2024 & 2032
List of Tables
- Table 1: Global Oxygen Free Copper Bars Market Revenue Million Forecast, by Region 2019 & 2032
- Table 2: Global Oxygen Free Copper Bars Market Volume K Tons Forecast, by Region 2019 & 2032
- Table 3: Global Oxygen Free Copper Bars Market Revenue Million Forecast, by Grade 2019 & 2032
- Table 4: Global Oxygen Free Copper Bars Market Volume K Tons Forecast, by Grade 2019 & 2032
- Table 5: Global Oxygen Free Copper Bars Market Revenue Million Forecast, by Product 2019 & 2032
- Table 6: Global Oxygen Free Copper Bars Market Volume K Tons Forecast, by Product 2019 & 2032
- Table 7: Global Oxygen Free Copper Bars Market Revenue Million Forecast, by End-user Industry 2019 & 2032
- Table 8: Global Oxygen Free Copper Bars Market Volume K Tons Forecast, by End-user Industry 2019 & 2032
- Table 9: Global Oxygen Free Copper Bars Market Revenue Million Forecast, by Region 2019 & 2032
- Table 10: Global Oxygen Free Copper Bars Market Volume K Tons Forecast, by Region 2019 & 2032
- Table 11: Global Oxygen Free Copper Bars Market Revenue Million Forecast, by Country 2019 & 2032
- Table 12: Global Oxygen Free Copper Bars Market Volume K Tons Forecast, by Country 2019 & 2032
- Table 13: United States Oxygen Free Copper Bars Market Revenue (Million) Forecast, by Application 2019 & 2032
- Table 14: United States Oxygen Free Copper Bars Market Volume (K Tons) Forecast, by Application 2019 & 2032
- Table 15: Canada Oxygen Free Copper Bars Market Revenue (Million) Forecast, by Application 2019 & 2032
- Table 16: Canada Oxygen Free Copper Bars Market Volume (K Tons) Forecast, by Application 2019 & 2032
- Table 17: Mexico Oxygen Free Copper Bars Market Revenue (Million) Forecast, by Application 2019 & 2032
- Table 18: Mexico Oxygen Free Copper Bars Market Volume (K Tons) Forecast, by Application 2019 & 2032
- Table 19: Global Oxygen Free Copper Bars Market Revenue Million Forecast, by Country 2019 & 2032
- Table 20: Global Oxygen Free Copper Bars Market Volume K Tons Forecast, by Country 2019 & 2032
- Table 21: Germany Oxygen Free Copper Bars Market Revenue (Million) Forecast, by Application 2019 & 2032
- Table 22: Germany Oxygen Free Copper Bars Market Volume (K Tons) Forecast, by Application 2019 & 2032
- Table 23: United Kingdom Oxygen Free Copper Bars Market Revenue (Million) Forecast, by Application 2019 & 2032
- Table 24: United Kingdom Oxygen Free Copper Bars Market Volume (K Tons) Forecast, by Application 2019 & 2032
- Table 25: France Oxygen Free Copper Bars Market Revenue (Million) Forecast, by Application 2019 & 2032
- Table 26: France Oxygen Free Copper Bars Market Volume (K Tons) Forecast, by Application 2019 & 2032
- Table 27: Spain Oxygen Free Copper Bars Market Revenue (Million) Forecast, by Application 2019 & 2032
- Table 28: Spain Oxygen Free Copper Bars Market Volume (K Tons) Forecast, by Application 2019 & 2032
- Table 29: Italy Oxygen Free Copper Bars Market Revenue (Million) Forecast, by Application 2019 & 2032
- Table 30: Italy Oxygen Free Copper Bars Market Volume (K Tons) Forecast, by Application 2019 & 2032
- Table 31: Spain Oxygen Free Copper Bars Market Revenue (Million) Forecast, by Application 2019 & 2032
- Table 32: Spain Oxygen Free Copper Bars Market Volume (K Tons) Forecast, by Application 2019 & 2032
- Table 33: Belgium Oxygen Free Copper Bars Market Revenue (Million) Forecast, by Application 2019 & 2032
- Table 34: Belgium Oxygen Free Copper Bars Market Volume (K Tons) Forecast, by Application 2019 & 2032
- Table 35: Netherland Oxygen Free Copper Bars Market Revenue (Million) Forecast, by Application 2019 & 2032
- Table 36: Netherland Oxygen Free Copper Bars Market Volume (K Tons) Forecast, by Application 2019 & 2032
- Table 37: Nordics Oxygen Free Copper Bars Market Revenue (Million) Forecast, by Application 2019 & 2032
- Table 38: Nordics Oxygen Free Copper Bars Market Volume (K Tons) Forecast, by Application 2019 & 2032
- Table 39: Rest of Europe Oxygen Free Copper Bars Market Revenue (Million) Forecast, by Application 2019 & 2032
- Table 40: Rest of Europe Oxygen Free Copper Bars Market Volume (K Tons) Forecast, by Application 2019 & 2032
- Table 41: Global Oxygen Free Copper Bars Market Revenue Million Forecast, by Country 2019 & 2032
- Table 42: Global Oxygen Free Copper Bars Market Volume K Tons Forecast, by Country 2019 & 2032
- Table 43: China Oxygen Free Copper Bars Market Revenue (Million) Forecast, by Application 2019 & 2032
- Table 44: China Oxygen Free Copper Bars Market Volume (K Tons) Forecast, by Application 2019 & 2032
- Table 45: Japan Oxygen Free Copper Bars Market Revenue (Million) Forecast, by Application 2019 & 2032
- Table 46: Japan Oxygen Free Copper Bars Market Volume (K Tons) Forecast, by Application 2019 & 2032
- Table 47: India Oxygen Free Copper Bars Market Revenue (Million) Forecast, by Application 2019 & 2032
- Table 48: India Oxygen Free Copper Bars Market Volume (K Tons) Forecast, by Application 2019 & 2032
- Table 49: South Korea Oxygen Free Copper Bars Market Revenue (Million) Forecast, by Application 2019 & 2032
- Table 50: South Korea Oxygen Free Copper Bars Market Volume (K Tons) Forecast, by Application 2019 & 2032
- Table 51: Southeast Asia Oxygen Free Copper Bars Market Revenue (Million) Forecast, by Application 2019 & 2032
- Table 52: Southeast Asia Oxygen Free Copper Bars Market Volume (K Tons) Forecast, by Application 2019 & 2032
- Table 53: Australia Oxygen Free Copper Bars Market Revenue (Million) Forecast, by Application 2019 & 2032
- Table 54: Australia Oxygen Free Copper Bars Market Volume (K Tons) Forecast, by Application 2019 & 2032
- Table 55: Indonesia Oxygen Free Copper Bars Market Revenue (Million) Forecast, by Application 2019 & 2032
- Table 56: Indonesia Oxygen Free Copper Bars Market Volume (K Tons) Forecast, by Application 2019 & 2032
- Table 57: Phillipes Oxygen Free Copper Bars Market Revenue (Million) Forecast, by Application 2019 & 2032
- Table 58: Phillipes Oxygen Free Copper Bars Market Volume (K Tons) Forecast, by Application 2019 & 2032
- Table 59: Singapore Oxygen Free Copper Bars Market Revenue (Million) Forecast, by Application 2019 & 2032
- Table 60: Singapore Oxygen Free Copper Bars Market Volume (K Tons) Forecast, by Application 2019 & 2032
- Table 61: Thailandc Oxygen Free Copper Bars Market Revenue (Million) Forecast, by Application 2019 & 2032
- Table 62: Thailandc Oxygen Free Copper Bars Market Volume (K Tons) Forecast, by Application 2019 & 2032
- Table 63: Rest of Asia Pacific Oxygen Free Copper Bars Market Revenue (Million) Forecast, by Application 2019 & 2032
- Table 64: Rest of Asia Pacific Oxygen Free Copper Bars Market Volume (K Tons) Forecast, by Application 2019 & 2032
- Table 65: Global Oxygen Free Copper Bars Market Revenue Million Forecast, by Country 2019 & 2032
- Table 66: Global Oxygen Free Copper Bars Market Volume K Tons Forecast, by Country 2019 & 2032
- Table 67: Brazil Oxygen Free Copper Bars Market Revenue (Million) Forecast, by Application 2019 & 2032
- Table 68: Brazil Oxygen Free Copper Bars Market Volume (K Tons) Forecast, by Application 2019 & 2032
- Table 69: Argentina Oxygen Free Copper Bars Market Revenue (Million) Forecast, by Application 2019 & 2032
- Table 70: Argentina Oxygen Free Copper Bars Market Volume (K Tons) Forecast, by Application 2019 & 2032
- Table 71: Peru Oxygen Free Copper Bars Market Revenue (Million) Forecast, by Application 2019 & 2032
- Table 72: Peru Oxygen Free Copper Bars Market Volume (K Tons) Forecast, by Application 2019 & 2032
- Table 73: Chile Oxygen Free Copper Bars Market Revenue (Million) Forecast, by Application 2019 & 2032
- Table 74: Chile Oxygen Free Copper Bars Market Volume (K Tons) Forecast, by Application 2019 & 2032
- Table 75: Colombia Oxygen Free Copper Bars Market Revenue (Million) Forecast, by Application 2019 & 2032
- Table 76: Colombia Oxygen Free Copper Bars Market Volume (K Tons) Forecast, by Application 2019 & 2032
- Table 77: Ecuador Oxygen Free Copper Bars Market Revenue (Million) Forecast, by Application 2019 & 2032
- Table 78: Ecuador Oxygen Free Copper Bars Market Volume (K Tons) Forecast, by Application 2019 & 2032
- Table 79: Venezuela Oxygen Free Copper Bars Market Revenue (Million) Forecast, by Application 2019 & 2032
- Table 80: Venezuela Oxygen Free Copper Bars Market Volume (K Tons) Forecast, by Application 2019 & 2032
- Table 81: Rest of South America Oxygen Free Copper Bars Market Revenue (Million) Forecast, by Application 2019 & 2032
- Table 82: Rest of South America Oxygen Free Copper Bars Market Volume (K Tons) Forecast, by Application 2019 & 2032
- Table 83: Global Oxygen Free Copper Bars Market Revenue Million Forecast, by Country 2019 & 2032
- Table 84: Global Oxygen Free Copper Bars Market Volume K Tons Forecast, by Country 2019 & 2032
- Table 85: United States Oxygen Free Copper Bars Market Revenue (Million) Forecast, by Application 2019 & 2032
- Table 86: United States Oxygen Free Copper Bars Market Volume (K Tons) Forecast, by Application 2019 & 2032
- Table 87: Canada Oxygen Free Copper Bars Market Revenue (Million) Forecast, by Application 2019 & 2032
- Table 88: Canada Oxygen Free Copper Bars Market Volume (K Tons) Forecast, by Application 2019 & 2032
- Table 89: Mexico Oxygen Free Copper Bars Market Revenue (Million) Forecast, by Application 2019 & 2032
- Table 90: Mexico Oxygen Free Copper Bars Market Volume (K Tons) Forecast, by Application 2019 & 2032
- Table 91: Global Oxygen Free Copper Bars Market Revenue Million Forecast, by Country 2019 & 2032
- Table 92: Global Oxygen Free Copper Bars Market Volume K Tons Forecast, by Country 2019 & 2032
- Table 93: United Arab Emirates Oxygen Free Copper Bars Market Revenue (Million) Forecast, by Application 2019 & 2032
- Table 94: United Arab Emirates Oxygen Free Copper Bars Market Volume (K Tons) Forecast, by Application 2019 & 2032
- Table 95: Saudi Arabia Oxygen Free Copper Bars Market Revenue (Million) Forecast, by Application 2019 & 2032
- Table 96: Saudi Arabia Oxygen Free Copper Bars Market Volume (K Tons) Forecast, by Application 2019 & 2032
- Table 97: South Africa Oxygen Free Copper Bars Market Revenue (Million) Forecast, by Application 2019 & 2032
- Table 98: South Africa Oxygen Free Copper Bars Market Volume (K Tons) Forecast, by Application 2019 & 2032
- Table 99: Rest of Middle East and Africa Oxygen Free Copper Bars Market Revenue (Million) Forecast, by Application 2019 & 2032
- Table 100: Rest of Middle East and Africa Oxygen Free Copper Bars Market Volume (K Tons) Forecast, by Application 2019 & 2032
- Table 101: Global Oxygen Free Copper Bars Market Revenue Million Forecast, by Grade 2019 & 2032
- Table 102: Global Oxygen Free Copper Bars Market Volume K Tons Forecast, by Grade 2019 & 2032
- Table 103: Global Oxygen Free Copper Bars Market Revenue Million Forecast, by Product 2019 & 2032
- Table 104: Global Oxygen Free Copper Bars Market Volume K Tons Forecast, by Product 2019 & 2032
- Table 105: Global Oxygen Free Copper Bars Market Revenue Million Forecast, by End-user Industry 2019 & 2032
- Table 106: Global Oxygen Free Copper Bars Market Volume K Tons Forecast, by End-user Industry 2019 & 2032
- Table 107: Global Oxygen Free Copper Bars Market Revenue Million Forecast, by Country 2019 & 2032
- Table 108: Global Oxygen Free Copper Bars Market Volume K Tons Forecast, by Country 2019 & 2032
- Table 109: China Oxygen Free Copper Bars Market Revenue (Million) Forecast, by Application 2019 & 2032
- Table 110: China Oxygen Free Copper Bars Market Volume (K Tons) Forecast, by Application 2019 & 2032
- Table 111: India Oxygen Free Copper Bars Market Revenue (Million) Forecast, by Application 2019 & 2032
- Table 112: India Oxygen Free Copper Bars Market Volume (K Tons) Forecast, by Application 2019 & 2032
- Table 113: Japan Oxygen Free Copper Bars Market Revenue (Million) Forecast, by Application 2019 & 2032
- Table 114: Japan Oxygen Free Copper Bars Market Volume (K Tons) Forecast, by Application 2019 & 2032
- Table 115: South Korea Oxygen Free Copper Bars Market Revenue (Million) Forecast, by Application 2019 & 2032
- Table 116: South Korea Oxygen Free Copper Bars Market Volume (K Tons) Forecast, by Application 2019 & 2032
- Table 117: Rest of Asia Pacific Oxygen Free Copper Bars Market Revenue (Million) Forecast, by Application 2019 & 2032
- Table 118: Rest of Asia Pacific Oxygen Free Copper Bars Market Volume (K Tons) Forecast, by Application 2019 & 2032
- Table 119: Global Oxygen Free Copper Bars Market Revenue Million Forecast, by Grade 2019 & 2032
- Table 120: Global Oxygen Free Copper Bars Market Volume K Tons Forecast, by Grade 2019 & 2032
- Table 121: Global Oxygen Free Copper Bars Market Revenue Million Forecast, by Product 2019 & 2032
- Table 122: Global Oxygen Free Copper Bars Market Volume K Tons Forecast, by Product 2019 & 2032
- Table 123: Global Oxygen Free Copper Bars Market Revenue Million Forecast, by End-user Industry 2019 & 2032
- Table 124: Global Oxygen Free Copper Bars Market Volume K Tons Forecast, by End-user Industry 2019 & 2032
- Table 125: Global Oxygen Free Copper Bars Market Revenue Million Forecast, by Country 2019 & 2032
- Table 126: Global Oxygen Free Copper Bars Market Volume K Tons Forecast, by Country 2019 & 2032
- Table 127: United States Oxygen Free Copper Bars Market Revenue (Million) Forecast, by Application 2019 & 2032
- Table 128: United States Oxygen Free Copper Bars Market Volume (K Tons) Forecast, by Application 2019 & 2032
- Table 129: Canada Oxygen Free Copper Bars Market Revenue (Million) Forecast, by Application 2019 & 2032
- Table 130: Canada Oxygen Free Copper Bars Market Volume (K Tons) Forecast, by Application 2019 & 2032
- Table 131: Mexico Oxygen Free Copper Bars Market Revenue (Million) Forecast, by Application 2019 & 2032
- Table 132: Mexico Oxygen Free Copper Bars Market Volume (K Tons) Forecast, by Application 2019 & 2032
- Table 133: Global Oxygen Free Copper Bars Market Revenue Million Forecast, by Grade 2019 & 2032
- Table 134: Global Oxygen Free Copper Bars Market Volume K Tons Forecast, by Grade 2019 & 2032
- Table 135: Global Oxygen Free Copper Bars Market Revenue Million Forecast, by Product 2019 & 2032
- Table 136: Global Oxygen Free Copper Bars Market Volume K Tons Forecast, by Product 2019 & 2032
- Table 137: Global Oxygen Free Copper Bars Market Revenue Million Forecast, by End-user Industry 2019 & 2032
- Table 138: Global Oxygen Free Copper Bars Market Volume K Tons Forecast, by End-user Industry 2019 & 2032
- Table 139: Global Oxygen Free Copper Bars Market Revenue Million Forecast, by Country 2019 & 2032
- Table 140: Global Oxygen Free Copper Bars Market Volume K Tons Forecast, by Country 2019 & 2032
- Table 141: Germany Oxygen Free Copper Bars Market Revenue (Million) Forecast, by Application 2019 & 2032
- Table 142: Germany Oxygen Free Copper Bars Market Volume (K Tons) Forecast, by Application 2019 & 2032
- Table 143: United Kingdom Oxygen Free Copper Bars Market Revenue (Million) Forecast, by Application 2019 & 2032
- Table 144: United Kingdom Oxygen Free Copper Bars Market Volume (K Tons) Forecast, by Application 2019 & 2032
- Table 145: France Oxygen Free Copper Bars Market Revenue (Million) Forecast, by Application 2019 & 2032
- Table 146: France Oxygen Free Copper Bars Market Volume (K Tons) Forecast, by Application 2019 & 2032
- Table 147: Italy Oxygen Free Copper Bars Market Revenue (Million) Forecast, by Application 2019 & 2032
- Table 148: Italy Oxygen Free Copper Bars Market Volume (K Tons) Forecast, by Application 2019 & 2032
- Table 149: Spain Oxygen Free Copper Bars Market Revenue (Million) Forecast, by Application 2019 & 2032
- Table 150: Spain Oxygen Free Copper Bars Market Volume (K Tons) Forecast, by Application 2019 & 2032
- Table 151: Rest of Europe Oxygen Free Copper Bars Market Revenue (Million) Forecast, by Application 2019 & 2032
- Table 152: Rest of Europe Oxygen Free Copper Bars Market Volume (K Tons) Forecast, by Application 2019 & 2032
- Table 153: Global Oxygen Free Copper Bars Market Revenue Million Forecast, by Grade 2019 & 2032
- Table 154: Global Oxygen Free Copper Bars Market Volume K Tons Forecast, by Grade 2019 & 2032
- Table 155: Global Oxygen Free Copper Bars Market Revenue Million Forecast, by Product 2019 & 2032
- Table 156: Global Oxygen Free Copper Bars Market Volume K Tons Forecast, by Product 2019 & 2032
- Table 157: Global Oxygen Free Copper Bars Market Revenue Million Forecast, by End-user Industry 2019 & 2032
- Table 158: Global Oxygen Free Copper Bars Market Volume K Tons Forecast, by End-user Industry 2019 & 2032
- Table 159: Global Oxygen Free Copper Bars Market Revenue Million Forecast, by Country 2019 & 2032
- Table 160: Global Oxygen Free Copper Bars Market Volume K Tons Forecast, by Country 2019 & 2032
- Table 161: Brazil Oxygen Free Copper Bars Market Revenue (Million) Forecast, by Application 2019 & 2032
- Table 162: Brazil Oxygen Free Copper Bars Market Volume (K Tons) Forecast, by Application 2019 & 2032
- Table 163: Argentina Oxygen Free Copper Bars Market Revenue (Million) Forecast, by Application 2019 & 2032
- Table 164: Argentina Oxygen Free Copper Bars Market Volume (K Tons) Forecast, by Application 2019 & 2032
- Table 165: Rest of South America Oxygen Free Copper Bars Market Revenue (Million) Forecast, by Application 2019 & 2032
- Table 166: Rest of South America Oxygen Free Copper Bars Market Volume (K Tons) Forecast, by Application 2019 & 2032
- Table 167: Global Oxygen Free Copper Bars Market Revenue Million Forecast, by Grade 2019 & 2032
- Table 168: Global Oxygen Free Copper Bars Market Volume K Tons Forecast, by Grade 2019 & 2032
- Table 169: Global Oxygen Free Copper Bars Market Revenue Million Forecast, by Product 2019 & 2032
- Table 170: Global Oxygen Free Copper Bars Market Volume K Tons Forecast, by Product 2019 & 2032
- Table 171: Global Oxygen Free Copper Bars Market Revenue Million Forecast, by End-user Industry 2019 & 2032
- Table 172: Global Oxygen Free Copper Bars Market Volume K Tons Forecast, by End-user Industry 2019 & 2032
- Table 173: Global Oxygen Free Copper Bars Market Revenue Million Forecast, by Country 2019 & 2032
- Table 174: Global Oxygen Free Copper Bars Market Volume K Tons Forecast, by Country 2019 & 2032
- Table 175: Saudi Arabia Oxygen Free Copper Bars Market Revenue (Million) Forecast, by Application 2019 & 2032
- Table 176: Saudi Arabia Oxygen Free Copper Bars Market Volume (K Tons) Forecast, by Application 2019 & 2032
- Table 177: South Africa Oxygen Free Copper Bars Market Revenue (Million) Forecast, by Application 2019 & 2032
- Table 178: South Africa Oxygen Free Copper Bars Market Volume (K Tons) Forecast, by Application 2019 & 2032
- Table 179: UAE Oxygen Free Copper Bars Market Revenue (Million) Forecast, by Application 2019 & 2032
- Table 180: UAE Oxygen Free Copper Bars Market Volume (K Tons) Forecast, by Application 2019 & 2032
- Table 181: Rest of Middle East and Africa Oxygen Free Copper Bars Market Revenue (Million) Forecast, by Application 2019 & 2032
- Table 182: Rest of Middle East and Africa Oxygen Free Copper Bars Market Volume (K Tons) Forecast, by Application 2019 & 2032
Frequently Asked Questions
1. What is the projected Compound Annual Growth Rate (CAGR) of the Oxygen Free Copper Bars Market?
The projected CAGR is approximately > 5.00%.
2. Which companies are prominent players in the Oxygen Free Copper Bars Market?
Key companies in the market include FURUKAWA ELECTRIC CO LTD, KGHM, PROTERIAL Ltd, KME GERMANY GMBH, Mitsubishi Materials Corporation, Metrod Holdings Berhad, Sam Dong, Farmers Copper LTD, Lacroix + Kress GmbH, Aviva Metals, Cupori, Citizen Metalloys Ltd, Copper Braid Products.
3. What are the main segments of the Oxygen Free Copper Bars Market?
The market segments include Grade, Product, End-user Industry.
4. Can you provide details about the market size?
The market size is estimated to be USD 20.29 Million as of 2022.
5. What are some drivers contributing to market growth?
Increasing Demand from Semiconductor; Increasing Demand from Automotive Sector; Other Drivers.
6. What are the notable trends driving market growth?
Electrical and Electronics Industry to Dominate the Market.
7. Are there any restraints impacting market growth?
High Cost of Copper; Other Restraints.
8. Can you provide examples of recent developments in the market?
Jan 2023: Effective January 04, 2023, Hitachi Metals Ltd changed its name to Proterial Ltd.
9. What pricing options are available for accessing the report?
Pricing options include single-user, multi-user, and enterprise licenses priced at USD 4750, USD 5250, and USD 8750 respectively.
10. Is the market size provided in terms of value or volume?
The market size is provided in terms of value, measured in Million and volume, measured in K Tons.
11. Are there any specific market keywords associated with the report?
Yes, the market keyword associated with the report is "Oxygen Free Copper Bars Market," which aids in identifying and referencing the specific market segment covered.
12. How do I determine which pricing option suits my needs best?
The pricing options vary based on user requirements and access needs. Individual users may opt for single-user licenses, while businesses requiring broader access may choose multi-user or enterprise licenses for cost-effective access to the report.
13. Are there any additional resources or data provided in the Oxygen Free Copper Bars Market report?
While the report offers comprehensive insights, it's advisable to review the specific contents or supplementary materials provided to ascertain if additional resources or data are available.
14. How can I stay updated on further developments or reports in the Oxygen Free Copper Bars Market?
To stay informed about further developments, trends, and reports in the Oxygen Free Copper Bars Market, consider subscribing to industry newsletters, following relevant companies and organizations, or regularly checking reputable industry news sources and publications.
Methodology
Step 1 - Identification of Relevant Samples Size from Population Database


Step 2 - Approaches for Defining Global Market Size (Value, Volume* & Price*)

Note*: In applicable scenarios
Step 3 - Data Sources
Primary Research
- Web Analytics
- Survey Reports
- Research Institute
- Latest Research Reports
- Opinion Leaders
Secondary Research
- Annual Reports
- White Paper
- Latest Press Release
- Industry Association
- Paid Database
- Investor Presentations

Step 4 - Data Triangulation
Involves using different sources of information in order to increase the validity of a study
These sources are likely to be stakeholders in a program - participants, other researchers, program staff, other community members, and so on.
Then we put all data in single framework & apply various statistical tools to find out the dynamic on the market.
During the analysis stage, feedback from the stakeholder groups would be compared to determine areas of agreement as well as areas of divergence
