

Key Insights
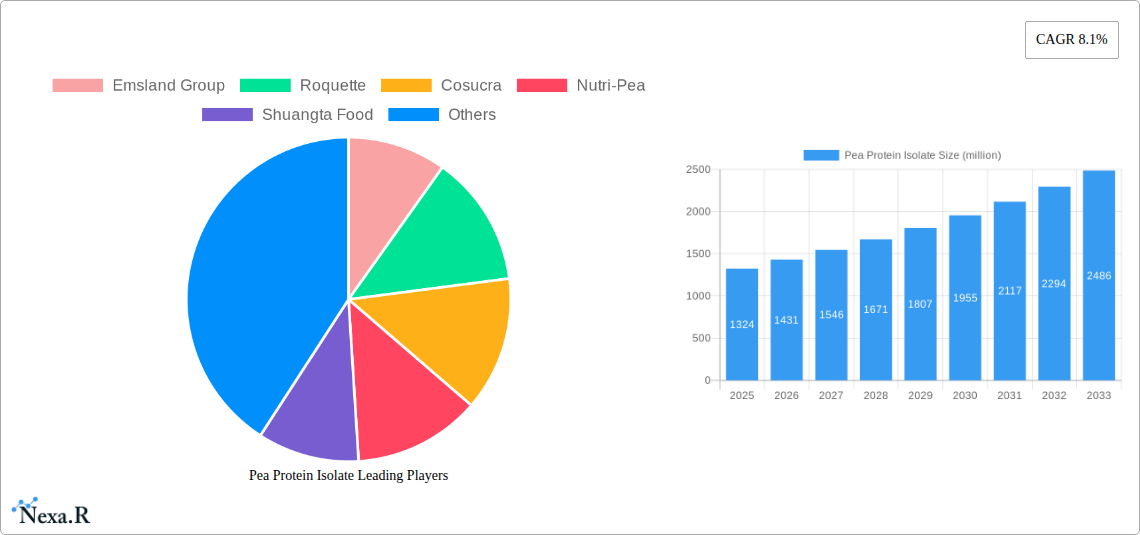
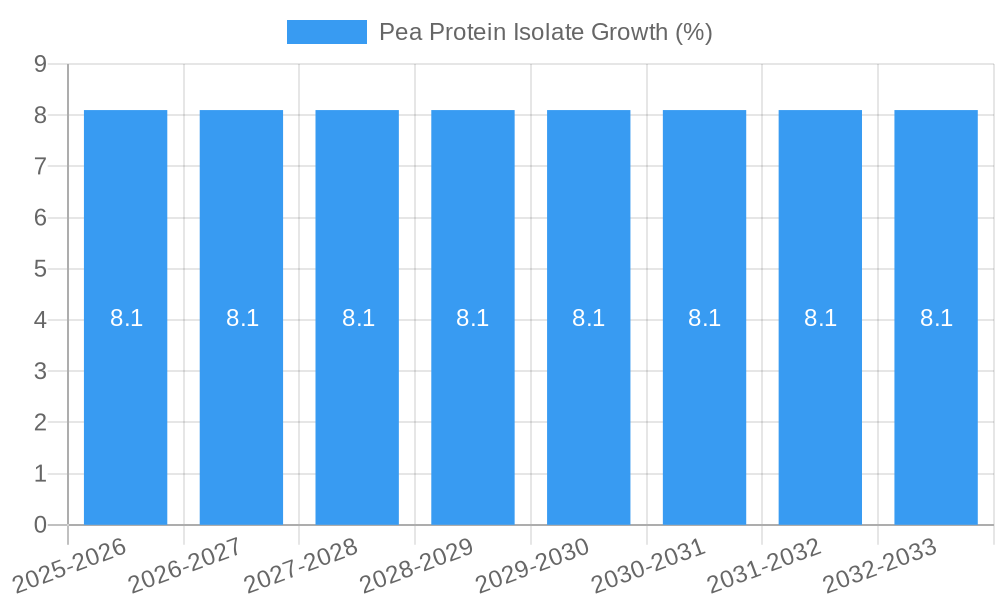
The global Pea Protein Isolate market is projected for substantial growth, with an estimated market size of $1324 million in 2025 and a robust Compound Annual Growth Rate (CAGR) of 8.1% anticipated through 2033. This expansion is primarily fueled by the escalating consumer demand for plant-based protein alternatives, driven by health consciousness, ethical considerations regarding animal agriculture, and growing environmental awareness. The burgeoning popularity of plant-based diets has significantly propelled the use of pea protein isolate across various applications, most notably in dietary supplements due to its high protein content and favorable nutritional profile. The food and beverage industry is also a key driver, incorporating pea protein isolate into a widening array of products, including baked goods, meat substitutes, and pet food, to enhance nutritional value and cater to vegan and vegetarian consumers. Emerging markets and evolving dietary preferences are expected to further accelerate this growth trajectory.
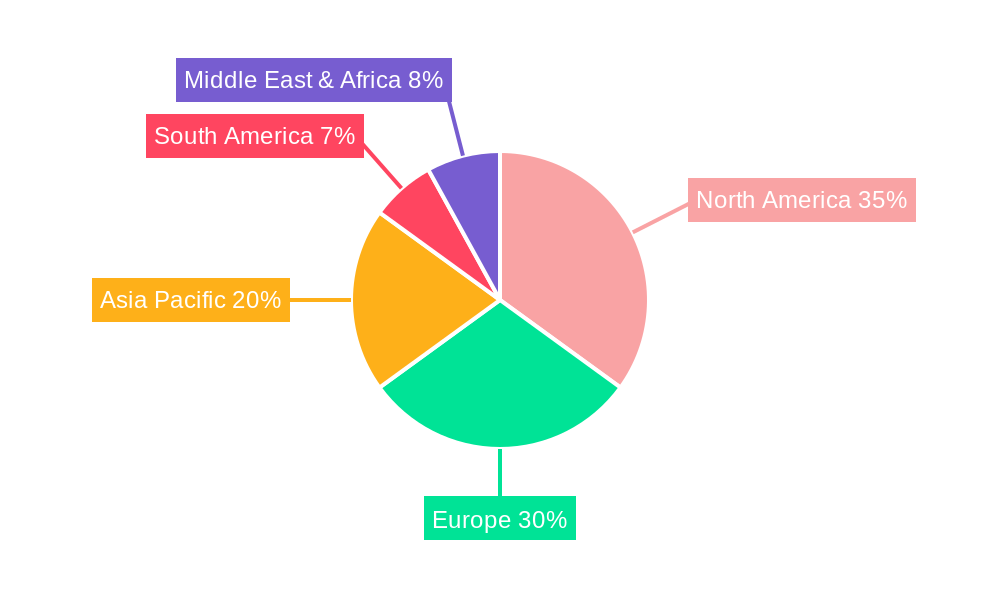
Further analysis reveals that market segmentation by purity level highlights a strong preference for high-purity pea protein isolate (>85%), indicating a demand for premium ingredients in specialized applications. While medium and low-purity variants also hold significant market share, the trend leans towards higher concentrations for enhanced functionality and perceived health benefits. Geographically, North America and Europe currently dominate the market, owing to established vegan and flexitarian consumer bases and advanced food processing technologies. However, the Asia Pacific region is poised for rapid expansion, driven by increasing disposable incomes, rising health awareness, and a growing adoption of Western dietary trends. Key restraints for the market include the potential for price volatility in raw materials and the need for continued innovation to address taste and texture challenges, though advancements in processing technologies are steadily mitigating these concerns.
Pea Protein Isolate Market: A Comprehensive Analysis & Forecast (2019-2033)
This in-depth report offers a strategic overview of the global Pea Protein Isolate market, a rapidly expanding segment within the broader plant-based protein industry. By analyzing market dynamics, growth trends, regional dominance, product innovations, and key players, this research provides invaluable insights for stakeholders across the food, beverage, dietary supplement, and animal nutrition sectors. The study encompasses a comprehensive historical period (2019-2024), a base year (2025), and a robust forecast period (2025-2033), projecting a significant CAGR of XX%.
Pea Protein Isolate Market Dynamics & Structure
The global Pea Protein Isolate market is characterized by a moderately concentrated structure, with leading players like Emsland Group, Roquette, and Cosucra holding significant market shares. Technological innovation is a primary driver, fueled by advancements in extraction and purification processes that enhance protein yield, purity, and functionality. Regulatory frameworks, particularly those surrounding food safety and labeling in regions like North America and Europe, are also shaping market entry and product development. Competitive product substitutes, including soy protein isolate, whey protein, and other plant-based proteins, pose a constant challenge, necessitating continuous product differentiation and cost-effectiveness. End-user demographics are evolving, with a growing consumer base driven by health consciousness, ethical considerations, and dietary preferences such as veganism and vegetarianism. Mergers and acquisitions (M&A) are a notable trend, with companies seeking to expand their product portfolios, gain market access, and secure supply chains. For instance, in the historical period (2019-2024), there were an estimated XX major M&A deals aimed at consolidating market positions. Innovation barriers include the cost of advanced processing technologies and the need for extensive research and development to meet diverse application requirements.
Pea Protein Isolate Growth Trends & Insights
The Pea Protein Isolate market size is projected for substantial growth, driven by escalating consumer demand for plant-based alternatives and its versatility across numerous applications. The market is anticipated to reach an estimated $XX million by 2033, up from approximately $XX million in 2025. Adoption rates are accelerating, particularly within the dietary supplements and meat substitutes segments, where consumers actively seek protein-rich, non-animal derived ingredients. Technological disruptions in processing have led to higher purity isolates and improved functional properties, such as enhanced emulsification and gelation, making pea protein isolates more attractive for food manufacturers. Consumer behavior shifts are paramount, with a growing preference for clean-label products, allergen-free options, and sustainable sourcing, all of which align favorably with pea protein's attributes. The overall market penetration is expected to increase from XX% in 2025 to XX% by 2033. This growth is further underpinned by ongoing research highlighting the health benefits of pea protein, including its high amino acid profile and digestibility. The influence of social media and health influencers is also playing a crucial role in educating consumers and driving demand for plant-based protein solutions, further solidifying the upward trajectory of the pea protein isolate industry.
Dominant Regions, Countries, or Segments in Pea Protein Isolate
The North America region currently dominates the Pea Protein Isolate market, driven by a well-established health and wellness culture, significant consumer adoption of plant-based diets, and robust R&D investments. The United States, in particular, represents a substantial market share due to its large population and a strong presence of major food and supplement manufacturers. Within applications, Dietary Supplements consistently emerge as a leading segment, accounting for an estimated XX% of the market share in 2025. This dominance is attributed to the perception of pea protein as a superior protein source for muscle building, recovery, and overall health, coupled with its hypoallergenic nature compared to other protein sources.
The High Purity Pea Protein Isolate (>85%) segment is also a significant growth engine. Its superior functional properties and cleaner taste profile make it highly sought after in premium food and beverage products, as well as specialized dietary supplements. This segment is projected to witness a CAGR of XX% during the forecast period. Key drivers of dominance in this segment include:
- Consumer Preferences: A rising demand for plant-based, non-GMO, and allergen-free ingredients in premium food products and functional beverages.
- Technological Advancements: Improved extraction and purification techniques that enable the production of higher purity isolates with enhanced solubility and neutral flavor.
- Regulatory Support: Favorable regulations in key markets encouraging the use of plant-based proteins in food fortification and new product development.
- Economic Factors: Growing disposable incomes in developed economies enable consumers to opt for premium, health-oriented food choices.
In terms of country-specific growth, beyond the US, Europe is another critical region exhibiting strong growth, supported by increasing environmental consciousness and government initiatives promoting sustainable food systems. The Meat Substitutes application segment is also rapidly gaining traction across both North America and Europe, presenting significant market share growth potential.
Pea Protein Isolate Product Landscape
The Pea Protein Isolate product landscape is evolving with a focus on enhanced functionality and application-specific formulations. Innovators are developing isolates with improved solubility, emulsification, and gelling properties, catering to a wider range of food and beverage applications, including dairy alternatives, baked goods, and protein bars. Product differentiation is increasingly achieved through superior taste profiles, reduced grittiness, and allergen-free certifications. Unique selling propositions include the development of specialized pea protein isolates for specific dietary needs, such as low-carbohydrate or high-fiber variants. Technological advancements are also enabling the creation of highly concentrated pea protein isolates, meeting the growing demand for potent protein sources in dietary supplements and performance nutrition products.
Key Drivers, Barriers & Challenges in Pea Protein Isolate
The Pea Protein Isolate market is propelled by several key drivers. The escalating global demand for plant-based protein sources, fueled by health consciousness, ethical considerations, and environmental sustainability, is the primary growth accelerator. Its hypoallergenic nature makes it an attractive alternative to common allergens like soy and dairy. Furthermore, advancements in processing technologies have led to improved taste, texture, and functionality, expanding its application scope.
However, significant barriers and challenges exist. The cost of production for high-purity isolates can be higher compared to other protein sources, impacting price competitiveness. Supply chain disruptions and price volatility of raw pea materials can also pose challenges. Regulatory hurdles in certain regions regarding novel food ingredients and labeling requirements can slow down market entry. Competitive pressures from established protein sources, including whey and soy, remain a constant concern. For instance, fluctuations in raw pea prices, estimated to impact production costs by XX% annually, can create instability.
Emerging Opportunities in Pea Protein Isolate
Emerging opportunities in the Pea Protein Isolate sector lie in the untapped potential within developing economies, where awareness and adoption of plant-based diets are growing rapidly. Innovative applications beyond traditional supplements and meat alternatives, such as in functional beverages, snacks, and even pharmaceutical applications, present significant growth avenues. The increasing consumer preference for clean-label and minimally processed ingredients also opens doors for pea protein isolates with fewer additives. Furthermore, the development of specialized pea protein isolates with enhanced bioavailability and specific amino acid profiles for targeted health benefits, such as cognitive function or gut health, represents a promising frontier. The expansion of Pet Food applications, driven by pet owners seeking healthier and more sustainable options for their companions, is another rapidly emerging opportunity.
Growth Accelerators in the Pea Protein Isolate Industry
Several factors are acting as growth accelerators for the Pea Protein Isolate industry. Technological breakthroughs in enzymatic hydrolysis and membrane filtration are continuously improving the quality, functionality, and cost-effectiveness of pea protein isolates, making them more competitive. Strategic partnerships between ingredient manufacturers and food and beverage companies are crucial for driving innovation and expanding market reach. For example, collaborations focusing on developing novel plant-based meat alternatives have significantly boosted demand. Furthermore, increasing government support for sustainable agriculture and plant-based food systems, coupled with a growing awareness of the environmental impact of animal agriculture, is creating a favorable market environment. The expansion into new geographic markets, particularly in Asia and Latin America, is also a significant growth catalyst.
Key Players Shaping the Pea Protein Isolate Market
- Emsland Group
- Roquette
- Cosucra
- Nutri-Pea
- Shuangta Food
- Yantai Oriental Protein Tech
- Shandong Jianyuan Foods
- Shandong Huatai Food
Notable Milestones in Pea Protein Isolate Sector
- 2019: Launch of a new generation of highly soluble pea protein isolates by Roquette, enhancing functionality in beverages.
- 2020: Emsland Group expands its pea protein production capacity to meet growing demand.
- 2021: Cosucra introduces pea protein isolates with improved taste profiles for the confectionery market.
- 2022: Nutri-Pea announces strategic partnerships to increase its market share in North America.
- 2023: Shuangta Food invests in advanced extraction technology to produce premium pea protein isolates.
- 2024: Yantai Oriental Protein Tech launches a new line of pea protein isolates targeting the pet food industry.
In-Depth Pea Protein Isolate Market Outlook
The future market outlook for Pea Protein Isolate remains exceptionally strong, fueled by sustained consumer demand for sustainable and healthy protein sources. Growth accelerators such as ongoing technological advancements in processing, leading to superior product quality and a wider range of applications, will continue to drive adoption. Strategic partnerships and market expansion efforts, particularly in emerging economies, will unlock new revenue streams. The increasing recognition of pea protein's health benefits and its role in supporting a circular economy will further solidify its position as a preferred protein ingredient. Stakeholders can capitalize on this trajectory by focusing on product innovation, supply chain optimization, and targeted marketing efforts to capture a significant share of this burgeoning market. The projected market valuation of $XX million by 2033 signifies a robust growth potential.
Pea Protein Isolate Segmentation
-
1. Application
- 1.1. Dietary Supplements
- 1.2. Baked Goods Ingredients
- 1.3. Meat Substitutes
- 1.4. Pet Food
- 1.5. Others
-
2. Type
- 2.1. Low Purity Pea Protein Isolate (75%-80%)
- 2.2. High Purity Pea Protein Isolate (>85%)
- 2.3. Medium Purity Pea Protein Isolate (80%-85%)
Pea Protein Isolate Segmentation By Geography
-
1. North America
- 1.1. United States
- 1.2. Canada
- 1.3. Mexico
-
2. South America
- 2.1. Brazil
- 2.2. Argentina
- 2.3. Rest of South America
-
3. Europe
- 3.1. United Kingdom
- 3.2. Germany
- 3.3. France
- 3.4. Italy
- 3.5. Spain
- 3.6. Russia
- 3.7. Benelux
- 3.8. Nordics
- 3.9. Rest of Europe
-
4. Middle East & Africa
- 4.1. Turkey
- 4.2. Israel
- 4.3. GCC
- 4.4. North Africa
- 4.5. South Africa
- 4.6. Rest of Middle East & Africa
-
5. Asia Pacific
- 5.1. China
- 5.2. India
- 5.3. Japan
- 5.4. South Korea
- 5.5. ASEAN
- 5.6. Oceania
- 5.7. Rest of Asia Pacific
Pea Protein Isolate REPORT HIGHLIGHTS
| Aspects | Details |
|---|---|
| Study Period | 2019-2033 |
| Base Year | 2024 |
| Estimated Year | 2025 |
| Forecast Period | 2025-2033 |
| Historical Period | 2019-2024 |
| Growth Rate | CAGR of 8.1% from 2019-2033 |
| Segmentation |
|
Table of Contents
- 1. Introduction
- 1.1. Research Scope
- 1.2. Market Segmentation
- 1.3. Research Methodology
- 1.4. Definitions and Assumptions
- 2. Executive Summary
- 2.1. Introduction
- 3. Market Dynamics
- 3.1. Introduction
- 3.2. Market Drivers
- 3.3. Market Restrains
- 3.4. Market Trends
- 4. Market Factor Analysis
- 4.1. Porters Five Forces
- 4.2. Supply/Value Chain
- 4.3. PESTEL analysis
- 4.4. Market Entropy
- 4.5. Patent/Trademark Analysis
- 5. Global Pea Protein Isolate Analysis, Insights and Forecast, 2019-2031
- 5.1. Market Analysis, Insights and Forecast - by Application
- 5.1.1. Dietary Supplements
- 5.1.2. Baked Goods Ingredients
- 5.1.3. Meat Substitutes
- 5.1.4. Pet Food
- 5.1.5. Others
- 5.2. Market Analysis, Insights and Forecast - by Type
- 5.2.1. Low Purity Pea Protein Isolate (75%-80%)
- 5.2.2. High Purity Pea Protein Isolate (>85%)
- 5.2.3. Medium Purity Pea Protein Isolate (80%-85%)
- 5.3. Market Analysis, Insights and Forecast - by Region
- 5.3.1. North America
- 5.3.2. South America
- 5.3.3. Europe
- 5.3.4. Middle East & Africa
- 5.3.5. Asia Pacific
- 5.1. Market Analysis, Insights and Forecast - by Application
- 6. North America Pea Protein Isolate Analysis, Insights and Forecast, 2019-2031
- 6.1. Market Analysis, Insights and Forecast - by Application
- 6.1.1. Dietary Supplements
- 6.1.2. Baked Goods Ingredients
- 6.1.3. Meat Substitutes
- 6.1.4. Pet Food
- 6.1.5. Others
- 6.2. Market Analysis, Insights and Forecast - by Type
- 6.2.1. Low Purity Pea Protein Isolate (75%-80%)
- 6.2.2. High Purity Pea Protein Isolate (>85%)
- 6.2.3. Medium Purity Pea Protein Isolate (80%-85%)
- 6.1. Market Analysis, Insights and Forecast - by Application
- 7. South America Pea Protein Isolate Analysis, Insights and Forecast, 2019-2031
- 7.1. Market Analysis, Insights and Forecast - by Application
- 7.1.1. Dietary Supplements
- 7.1.2. Baked Goods Ingredients
- 7.1.3. Meat Substitutes
- 7.1.4. Pet Food
- 7.1.5. Others
- 7.2. Market Analysis, Insights and Forecast - by Type
- 7.2.1. Low Purity Pea Protein Isolate (75%-80%)
- 7.2.2. High Purity Pea Protein Isolate (>85%)
- 7.2.3. Medium Purity Pea Protein Isolate (80%-85%)
- 7.1. Market Analysis, Insights and Forecast - by Application
- 8. Europe Pea Protein Isolate Analysis, Insights and Forecast, 2019-2031
- 8.1. Market Analysis, Insights and Forecast - by Application
- 8.1.1. Dietary Supplements
- 8.1.2. Baked Goods Ingredients
- 8.1.3. Meat Substitutes
- 8.1.4. Pet Food
- 8.1.5. Others
- 8.2. Market Analysis, Insights and Forecast - by Type
- 8.2.1. Low Purity Pea Protein Isolate (75%-80%)
- 8.2.2. High Purity Pea Protein Isolate (>85%)
- 8.2.3. Medium Purity Pea Protein Isolate (80%-85%)
- 8.1. Market Analysis, Insights and Forecast - by Application
- 9. Middle East & Africa Pea Protein Isolate Analysis, Insights and Forecast, 2019-2031
- 9.1. Market Analysis, Insights and Forecast - by Application
- 9.1.1. Dietary Supplements
- 9.1.2. Baked Goods Ingredients
- 9.1.3. Meat Substitutes
- 9.1.4. Pet Food
- 9.1.5. Others
- 9.2. Market Analysis, Insights and Forecast - by Type
- 9.2.1. Low Purity Pea Protein Isolate (75%-80%)
- 9.2.2. High Purity Pea Protein Isolate (>85%)
- 9.2.3. Medium Purity Pea Protein Isolate (80%-85%)
- 9.1. Market Analysis, Insights and Forecast - by Application
- 10. Asia Pacific Pea Protein Isolate Analysis, Insights and Forecast, 2019-2031
- 10.1. Market Analysis, Insights and Forecast - by Application
- 10.1.1. Dietary Supplements
- 10.1.2. Baked Goods Ingredients
- 10.1.3. Meat Substitutes
- 10.1.4. Pet Food
- 10.1.5. Others
- 10.2. Market Analysis, Insights and Forecast - by Type
- 10.2.1. Low Purity Pea Protein Isolate (75%-80%)
- 10.2.2. High Purity Pea Protein Isolate (>85%)
- 10.2.3. Medium Purity Pea Protein Isolate (80%-85%)
- 10.1. Market Analysis, Insights and Forecast - by Application
- 11. Competitive Analysis
- 11.1. Global Market Share Analysis 2024
- 11.2. Company Profiles
- 11.2.1 Emsland Group
- 11.2.1.1. Overview
- 11.2.1.2. Products
- 11.2.1.3. SWOT Analysis
- 11.2.1.4. Recent Developments
- 11.2.1.5. Financials (Based on Availability)
- 11.2.2 Roquette
- 11.2.2.1. Overview
- 11.2.2.2. Products
- 11.2.2.3. SWOT Analysis
- 11.2.2.4. Recent Developments
- 11.2.2.5. Financials (Based on Availability)
- 11.2.3 Cosucra
- 11.2.3.1. Overview
- 11.2.3.2. Products
- 11.2.3.3. SWOT Analysis
- 11.2.3.4. Recent Developments
- 11.2.3.5. Financials (Based on Availability)
- 11.2.4 Nutri-Pea
- 11.2.4.1. Overview
- 11.2.4.2. Products
- 11.2.4.3. SWOT Analysis
- 11.2.4.4. Recent Developments
- 11.2.4.5. Financials (Based on Availability)
- 11.2.5 Shuangta Food
- 11.2.5.1. Overview
- 11.2.5.2. Products
- 11.2.5.3. SWOT Analysis
- 11.2.5.4. Recent Developments
- 11.2.5.5. Financials (Based on Availability)
- 11.2.6 Yantai Oriental Protein Tech
- 11.2.6.1. Overview
- 11.2.6.2. Products
- 11.2.6.3. SWOT Analysis
- 11.2.6.4. Recent Developments
- 11.2.6.5. Financials (Based on Availability)
- 11.2.7 Shandong Jianyuan Foods
- 11.2.7.1. Overview
- 11.2.7.2. Products
- 11.2.7.3. SWOT Analysis
- 11.2.7.4. Recent Developments
- 11.2.7.5. Financials (Based on Availability)
- 11.2.8 Shandong Huatai Food
- 11.2.8.1. Overview
- 11.2.8.2. Products
- 11.2.8.3. SWOT Analysis
- 11.2.8.4. Recent Developments
- 11.2.8.5. Financials (Based on Availability)
- 11.2.1 Emsland Group
List of Figures
- Figure 1: Global Pea Protein Isolate Revenue Breakdown (million, %) by Region 2024 & 2032
- Figure 2: Global Pea Protein Isolate Volume Breakdown (K, %) by Region 2024 & 2032
- Figure 3: North America Pea Protein Isolate Revenue (million), by Application 2024 & 2032
- Figure 4: North America Pea Protein Isolate Volume (K), by Application 2024 & 2032
- Figure 5: North America Pea Protein Isolate Revenue Share (%), by Application 2024 & 2032
- Figure 6: North America Pea Protein Isolate Volume Share (%), by Application 2024 & 2032
- Figure 7: North America Pea Protein Isolate Revenue (million), by Type 2024 & 2032
- Figure 8: North America Pea Protein Isolate Volume (K), by Type 2024 & 2032
- Figure 9: North America Pea Protein Isolate Revenue Share (%), by Type 2024 & 2032
- Figure 10: North America Pea Protein Isolate Volume Share (%), by Type 2024 & 2032
- Figure 11: North America Pea Protein Isolate Revenue (million), by Country 2024 & 2032
- Figure 12: North America Pea Protein Isolate Volume (K), by Country 2024 & 2032
- Figure 13: North America Pea Protein Isolate Revenue Share (%), by Country 2024 & 2032
- Figure 14: North America Pea Protein Isolate Volume Share (%), by Country 2024 & 2032
- Figure 15: South America Pea Protein Isolate Revenue (million), by Application 2024 & 2032
- Figure 16: South America Pea Protein Isolate Volume (K), by Application 2024 & 2032
- Figure 17: South America Pea Protein Isolate Revenue Share (%), by Application 2024 & 2032
- Figure 18: South America Pea Protein Isolate Volume Share (%), by Application 2024 & 2032
- Figure 19: South America Pea Protein Isolate Revenue (million), by Type 2024 & 2032
- Figure 20: South America Pea Protein Isolate Volume (K), by Type 2024 & 2032
- Figure 21: South America Pea Protein Isolate Revenue Share (%), by Type 2024 & 2032
- Figure 22: South America Pea Protein Isolate Volume Share (%), by Type 2024 & 2032
- Figure 23: South America Pea Protein Isolate Revenue (million), by Country 2024 & 2032
- Figure 24: South America Pea Protein Isolate Volume (K), by Country 2024 & 2032
- Figure 25: South America Pea Protein Isolate Revenue Share (%), by Country 2024 & 2032
- Figure 26: South America Pea Protein Isolate Volume Share (%), by Country 2024 & 2032
- Figure 27: Europe Pea Protein Isolate Revenue (million), by Application 2024 & 2032
- Figure 28: Europe Pea Protein Isolate Volume (K), by Application 2024 & 2032
- Figure 29: Europe Pea Protein Isolate Revenue Share (%), by Application 2024 & 2032
- Figure 30: Europe Pea Protein Isolate Volume Share (%), by Application 2024 & 2032
- Figure 31: Europe Pea Protein Isolate Revenue (million), by Type 2024 & 2032
- Figure 32: Europe Pea Protein Isolate Volume (K), by Type 2024 & 2032
- Figure 33: Europe Pea Protein Isolate Revenue Share (%), by Type 2024 & 2032
- Figure 34: Europe Pea Protein Isolate Volume Share (%), by Type 2024 & 2032
- Figure 35: Europe Pea Protein Isolate Revenue (million), by Country 2024 & 2032
- Figure 36: Europe Pea Protein Isolate Volume (K), by Country 2024 & 2032
- Figure 37: Europe Pea Protein Isolate Revenue Share (%), by Country 2024 & 2032
- Figure 38: Europe Pea Protein Isolate Volume Share (%), by Country 2024 & 2032
- Figure 39: Middle East & Africa Pea Protein Isolate Revenue (million), by Application 2024 & 2032
- Figure 40: Middle East & Africa Pea Protein Isolate Volume (K), by Application 2024 & 2032
- Figure 41: Middle East & Africa Pea Protein Isolate Revenue Share (%), by Application 2024 & 2032
- Figure 42: Middle East & Africa Pea Protein Isolate Volume Share (%), by Application 2024 & 2032
- Figure 43: Middle East & Africa Pea Protein Isolate Revenue (million), by Type 2024 & 2032
- Figure 44: Middle East & Africa Pea Protein Isolate Volume (K), by Type 2024 & 2032
- Figure 45: Middle East & Africa Pea Protein Isolate Revenue Share (%), by Type 2024 & 2032
- Figure 46: Middle East & Africa Pea Protein Isolate Volume Share (%), by Type 2024 & 2032
- Figure 47: Middle East & Africa Pea Protein Isolate Revenue (million), by Country 2024 & 2032
- Figure 48: Middle East & Africa Pea Protein Isolate Volume (K), by Country 2024 & 2032
- Figure 49: Middle East & Africa Pea Protein Isolate Revenue Share (%), by Country 2024 & 2032
- Figure 50: Middle East & Africa Pea Protein Isolate Volume Share (%), by Country 2024 & 2032
- Figure 51: Asia Pacific Pea Protein Isolate Revenue (million), by Application 2024 & 2032
- Figure 52: Asia Pacific Pea Protein Isolate Volume (K), by Application 2024 & 2032
- Figure 53: Asia Pacific Pea Protein Isolate Revenue Share (%), by Application 2024 & 2032
- Figure 54: Asia Pacific Pea Protein Isolate Volume Share (%), by Application 2024 & 2032
- Figure 55: Asia Pacific Pea Protein Isolate Revenue (million), by Type 2024 & 2032
- Figure 56: Asia Pacific Pea Protein Isolate Volume (K), by Type 2024 & 2032
- Figure 57: Asia Pacific Pea Protein Isolate Revenue Share (%), by Type 2024 & 2032
- Figure 58: Asia Pacific Pea Protein Isolate Volume Share (%), by Type 2024 & 2032
- Figure 59: Asia Pacific Pea Protein Isolate Revenue (million), by Country 2024 & 2032
- Figure 60: Asia Pacific Pea Protein Isolate Volume (K), by Country 2024 & 2032
- Figure 61: Asia Pacific Pea Protein Isolate Revenue Share (%), by Country 2024 & 2032
- Figure 62: Asia Pacific Pea Protein Isolate Volume Share (%), by Country 2024 & 2032
List of Tables
- Table 1: Global Pea Protein Isolate Revenue million Forecast, by Region 2019 & 2032
- Table 2: Global Pea Protein Isolate Volume K Forecast, by Region 2019 & 2032
- Table 3: Global Pea Protein Isolate Revenue million Forecast, by Application 2019 & 2032
- Table 4: Global Pea Protein Isolate Volume K Forecast, by Application 2019 & 2032
- Table 5: Global Pea Protein Isolate Revenue million Forecast, by Type 2019 & 2032
- Table 6: Global Pea Protein Isolate Volume K Forecast, by Type 2019 & 2032
- Table 7: Global Pea Protein Isolate Revenue million Forecast, by Region 2019 & 2032
- Table 8: Global Pea Protein Isolate Volume K Forecast, by Region 2019 & 2032
- Table 9: Global Pea Protein Isolate Revenue million Forecast, by Application 2019 & 2032
- Table 10: Global Pea Protein Isolate Volume K Forecast, by Application 2019 & 2032
- Table 11: Global Pea Protein Isolate Revenue million Forecast, by Type 2019 & 2032
- Table 12: Global Pea Protein Isolate Volume K Forecast, by Type 2019 & 2032
- Table 13: Global Pea Protein Isolate Revenue million Forecast, by Country 2019 & 2032
- Table 14: Global Pea Protein Isolate Volume K Forecast, by Country 2019 & 2032
- Table 15: United States Pea Protein Isolate Revenue (million) Forecast, by Application 2019 & 2032
- Table 16: United States Pea Protein Isolate Volume (K) Forecast, by Application 2019 & 2032
- Table 17: Canada Pea Protein Isolate Revenue (million) Forecast, by Application 2019 & 2032
- Table 18: Canada Pea Protein Isolate Volume (K) Forecast, by Application 2019 & 2032
- Table 19: Mexico Pea Protein Isolate Revenue (million) Forecast, by Application 2019 & 2032
- Table 20: Mexico Pea Protein Isolate Volume (K) Forecast, by Application 2019 & 2032
- Table 21: Global Pea Protein Isolate Revenue million Forecast, by Application 2019 & 2032
- Table 22: Global Pea Protein Isolate Volume K Forecast, by Application 2019 & 2032
- Table 23: Global Pea Protein Isolate Revenue million Forecast, by Type 2019 & 2032
- Table 24: Global Pea Protein Isolate Volume K Forecast, by Type 2019 & 2032
- Table 25: Global Pea Protein Isolate Revenue million Forecast, by Country 2019 & 2032
- Table 26: Global Pea Protein Isolate Volume K Forecast, by Country 2019 & 2032
- Table 27: Brazil Pea Protein Isolate Revenue (million) Forecast, by Application 2019 & 2032
- Table 28: Brazil Pea Protein Isolate Volume (K) Forecast, by Application 2019 & 2032
- Table 29: Argentina Pea Protein Isolate Revenue (million) Forecast, by Application 2019 & 2032
- Table 30: Argentina Pea Protein Isolate Volume (K) Forecast, by Application 2019 & 2032
- Table 31: Rest of South America Pea Protein Isolate Revenue (million) Forecast, by Application 2019 & 2032
- Table 32: Rest of South America Pea Protein Isolate Volume (K) Forecast, by Application 2019 & 2032
- Table 33: Global Pea Protein Isolate Revenue million Forecast, by Application 2019 & 2032
- Table 34: Global Pea Protein Isolate Volume K Forecast, by Application 2019 & 2032
- Table 35: Global Pea Protein Isolate Revenue million Forecast, by Type 2019 & 2032
- Table 36: Global Pea Protein Isolate Volume K Forecast, by Type 2019 & 2032
- Table 37: Global Pea Protein Isolate Revenue million Forecast, by Country 2019 & 2032
- Table 38: Global Pea Protein Isolate Volume K Forecast, by Country 2019 & 2032
- Table 39: United Kingdom Pea Protein Isolate Revenue (million) Forecast, by Application 2019 & 2032
- Table 40: United Kingdom Pea Protein Isolate Volume (K) Forecast, by Application 2019 & 2032
- Table 41: Germany Pea Protein Isolate Revenue (million) Forecast, by Application 2019 & 2032
- Table 42: Germany Pea Protein Isolate Volume (K) Forecast, by Application 2019 & 2032
- Table 43: France Pea Protein Isolate Revenue (million) Forecast, by Application 2019 & 2032
- Table 44: France Pea Protein Isolate Volume (K) Forecast, by Application 2019 & 2032
- Table 45: Italy Pea Protein Isolate Revenue (million) Forecast, by Application 2019 & 2032
- Table 46: Italy Pea Protein Isolate Volume (K) Forecast, by Application 2019 & 2032
- Table 47: Spain Pea Protein Isolate Revenue (million) Forecast, by Application 2019 & 2032
- Table 48: Spain Pea Protein Isolate Volume (K) Forecast, by Application 2019 & 2032
- Table 49: Russia Pea Protein Isolate Revenue (million) Forecast, by Application 2019 & 2032
- Table 50: Russia Pea Protein Isolate Volume (K) Forecast, by Application 2019 & 2032
- Table 51: Benelux Pea Protein Isolate Revenue (million) Forecast, by Application 2019 & 2032
- Table 52: Benelux Pea Protein Isolate Volume (K) Forecast, by Application 2019 & 2032
- Table 53: Nordics Pea Protein Isolate Revenue (million) Forecast, by Application 2019 & 2032
- Table 54: Nordics Pea Protein Isolate Volume (K) Forecast, by Application 2019 & 2032
- Table 55: Rest of Europe Pea Protein Isolate Revenue (million) Forecast, by Application 2019 & 2032
- Table 56: Rest of Europe Pea Protein Isolate Volume (K) Forecast, by Application 2019 & 2032
- Table 57: Global Pea Protein Isolate Revenue million Forecast, by Application 2019 & 2032
- Table 58: Global Pea Protein Isolate Volume K Forecast, by Application 2019 & 2032
- Table 59: Global Pea Protein Isolate Revenue million Forecast, by Type 2019 & 2032
- Table 60: Global Pea Protein Isolate Volume K Forecast, by Type 2019 & 2032
- Table 61: Global Pea Protein Isolate Revenue million Forecast, by Country 2019 & 2032
- Table 62: Global Pea Protein Isolate Volume K Forecast, by Country 2019 & 2032
- Table 63: Turkey Pea Protein Isolate Revenue (million) Forecast, by Application 2019 & 2032
- Table 64: Turkey Pea Protein Isolate Volume (K) Forecast, by Application 2019 & 2032
- Table 65: Israel Pea Protein Isolate Revenue (million) Forecast, by Application 2019 & 2032
- Table 66: Israel Pea Protein Isolate Volume (K) Forecast, by Application 2019 & 2032
- Table 67: GCC Pea Protein Isolate Revenue (million) Forecast, by Application 2019 & 2032
- Table 68: GCC Pea Protein Isolate Volume (K) Forecast, by Application 2019 & 2032
- Table 69: North Africa Pea Protein Isolate Revenue (million) Forecast, by Application 2019 & 2032
- Table 70: North Africa Pea Protein Isolate Volume (K) Forecast, by Application 2019 & 2032
- Table 71: South Africa Pea Protein Isolate Revenue (million) Forecast, by Application 2019 & 2032
- Table 72: South Africa Pea Protein Isolate Volume (K) Forecast, by Application 2019 & 2032
- Table 73: Rest of Middle East & Africa Pea Protein Isolate Revenue (million) Forecast, by Application 2019 & 2032
- Table 74: Rest of Middle East & Africa Pea Protein Isolate Volume (K) Forecast, by Application 2019 & 2032
- Table 75: Global Pea Protein Isolate Revenue million Forecast, by Application 2019 & 2032
- Table 76: Global Pea Protein Isolate Volume K Forecast, by Application 2019 & 2032
- Table 77: Global Pea Protein Isolate Revenue million Forecast, by Type 2019 & 2032
- Table 78: Global Pea Protein Isolate Volume K Forecast, by Type 2019 & 2032
- Table 79: Global Pea Protein Isolate Revenue million Forecast, by Country 2019 & 2032
- Table 80: Global Pea Protein Isolate Volume K Forecast, by Country 2019 & 2032
- Table 81: China Pea Protein Isolate Revenue (million) Forecast, by Application 2019 & 2032
- Table 82: China Pea Protein Isolate Volume (K) Forecast, by Application 2019 & 2032
- Table 83: India Pea Protein Isolate Revenue (million) Forecast, by Application 2019 & 2032
- Table 84: India Pea Protein Isolate Volume (K) Forecast, by Application 2019 & 2032
- Table 85: Japan Pea Protein Isolate Revenue (million) Forecast, by Application 2019 & 2032
- Table 86: Japan Pea Protein Isolate Volume (K) Forecast, by Application 2019 & 2032
- Table 87: South Korea Pea Protein Isolate Revenue (million) Forecast, by Application 2019 & 2032
- Table 88: South Korea Pea Protein Isolate Volume (K) Forecast, by Application 2019 & 2032
- Table 89: ASEAN Pea Protein Isolate Revenue (million) Forecast, by Application 2019 & 2032
- Table 90: ASEAN Pea Protein Isolate Volume (K) Forecast, by Application 2019 & 2032
- Table 91: Oceania Pea Protein Isolate Revenue (million) Forecast, by Application 2019 & 2032
- Table 92: Oceania Pea Protein Isolate Volume (K) Forecast, by Application 2019 & 2032
- Table 93: Rest of Asia Pacific Pea Protein Isolate Revenue (million) Forecast, by Application 2019 & 2032
- Table 94: Rest of Asia Pacific Pea Protein Isolate Volume (K) Forecast, by Application 2019 & 2032
Frequently Asked Questions
1. What is the projected Compound Annual Growth Rate (CAGR) of the Pea Protein Isolate?
The projected CAGR is approximately 8.1%.
2. Which companies are prominent players in the Pea Protein Isolate?
Key companies in the market include Emsland Group, Roquette, Cosucra, Nutri-Pea, Shuangta Food, Yantai Oriental Protein Tech, Shandong Jianyuan Foods, Shandong Huatai Food.
3. What are the main segments of the Pea Protein Isolate?
The market segments include Application, Type.
4. Can you provide details about the market size?
The market size is estimated to be USD 1324 million as of 2022.
5. What are some drivers contributing to market growth?
N/A
6. What are the notable trends driving market growth?
N/A
7. Are there any restraints impacting market growth?
N/A
8. Can you provide examples of recent developments in the market?
N/A
9. What pricing options are available for accessing the report?
Pricing options include single-user, multi-user, and enterprise licenses priced at USD 3950.00, USD 5925.00, and USD 7900.00 respectively.
10. Is the market size provided in terms of value or volume?
The market size is provided in terms of value, measured in million and volume, measured in K.
11. Are there any specific market keywords associated with the report?
Yes, the market keyword associated with the report is "Pea Protein Isolate," which aids in identifying and referencing the specific market segment covered.
12. How do I determine which pricing option suits my needs best?
The pricing options vary based on user requirements and access needs. Individual users may opt for single-user licenses, while businesses requiring broader access may choose multi-user or enterprise licenses for cost-effective access to the report.
13. Are there any additional resources or data provided in the Pea Protein Isolate report?
While the report offers comprehensive insights, it's advisable to review the specific contents or supplementary materials provided to ascertain if additional resources or data are available.
14. How can I stay updated on further developments or reports in the Pea Protein Isolate?
To stay informed about further developments, trends, and reports in the Pea Protein Isolate, consider subscribing to industry newsletters, following relevant companies and organizations, or regularly checking reputable industry news sources and publications.
Methodology
Step 1 - Identification of Relevant Samples Size from Population Database


Step 2 - Approaches for Defining Global Market Size (Value, Volume* & Price*)

Note*: In applicable scenarios
Step 3 - Data Sources
Primary Research
- Web Analytics
- Survey Reports
- Research Institute
- Latest Research Reports
- Opinion Leaders
Secondary Research
- Annual Reports
- White Paper
- Latest Press Release
- Industry Association
- Paid Database
- Investor Presentations

Step 4 - Data Triangulation
Involves using different sources of information in order to increase the validity of a study
These sources are likely to be stakeholders in a program - participants, other researchers, program staff, other community members, and so on.
Then we put all data in single framework & apply various statistical tools to find out the dynamic on the market.
During the analysis stage, feedback from the stakeholder groups would be compared to determine areas of agreement as well as areas of divergence
